1625 Chilton St · Baltimore, MD
Flood risk 1/10 · Minimal
- FEMA flood zone
- X (unshaded)
- Chance of flooding over 30 yrs
- 0.0%
- Est. flood insurance / yr
- $473 – $860
Fire risk 1/10 · Minimal
- Est. fire insurance / yr
- $755 – $1,403
Heat risk 7/10 · Major
- Hot days now (above 103°F)
- 7 days/yr
- Hot days in 30 yrs
- 15 days/yr
Wind risk 6/10 · Moderate
- Chance of severe wind over 30 yrs
- 27.0%
Air-quality risk 4/10 · Minor
- Unhealthy air days now
- 6 days/yr
- Unhealthy air days in 30 yrs
- 7 days/yr
Risk factors via First Street. Map © Google.
Why this score? — see what drove the C grade
The composite is a weighted blend of 9 inputs, each scored 0–100. Each bar is that input's sub-score; the figure is the points it added to the 100-point composite (weight × sub-score).
- Cash flow +22.5/30.0
- ARV discount +14.6/15.0
- DSCR +7.2/10.0
- 1% rule +5.3/10.0
- Livability +3.8/5.0
- Rent growth +2.9/5.0
- Condition / age +2.5/5.0
- Schools +1.0/10.0
- Appreciation +0.0/10.0
$199,900
🖨 Deal sheet (PDF) 📄 Offer letter ✓ Due diligence
Listing remarks MLS
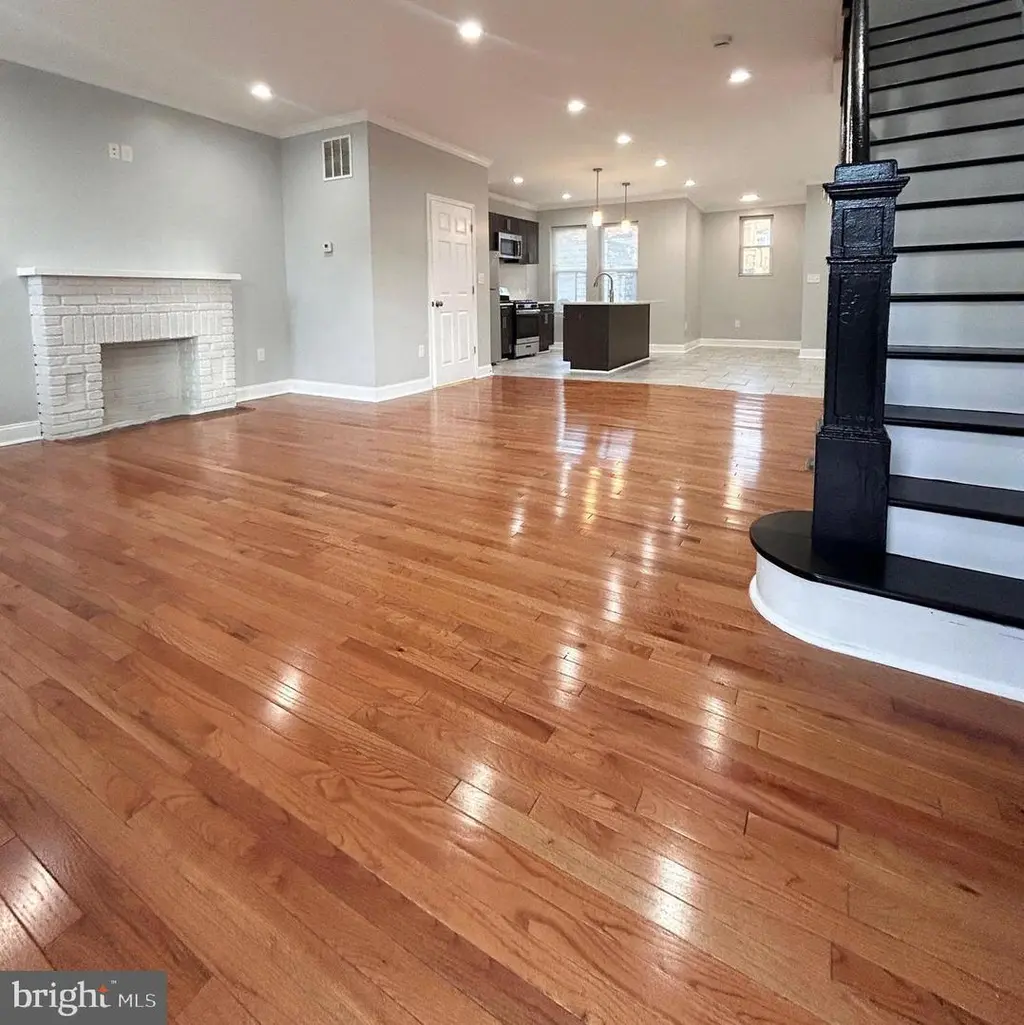
3 level town home minutes from major routes, schools, shopping, less than 1 mile to Clifton Park and Golf Course.
Key facts
- Baseboard molding
- Finished basement
- Recessed lighting
Tags
Property features AI
Exterior
- Parking: Driveway parking; Two driveway spaces (total of 2 garage/parking spaces)
- Utilities: Public water; Public sewer; Municipal trash service
- Home design: Interior townhouse/rowhouse; Effective year built 2020; Very good condition; Fee simple ownership
- Construction: Brick construction; Stone foundation; Building not winterized
- Exterior features: Above grade structures; Annual ground rent
Interior
- Kitchen: Built-in microwave; Cooktop; Oven/Range - Gas; Dishwasher; Refrigerator; Stainless steel appliances
- Bedrooms: Four bedrooms on the upper level
- Flooring: Hardwood
- Bathrooms: Two full bathrooms (all upper levels); One half bathroom on the main level
- Heating & cooling: Central heating (natural gas); Central air conditioning (electric); Natural gas hot water
- Interior features: Fully finished full basement; Not furnished
- Laundry & utility: Washer and dryer in unit; Laundry located in basement
Neighborhood map
What this means for you Summary
Snapshot
- This is a 4-bed/1.5-bath townhouse listed at $200k.
Deal economics
- At list price, monthly cash flow is $336 ($4k/yr) — positive.
- The deal already cash-flows at list — no discount required.
- Meets the 1% rule at list price ($2k rent vs $200k).
- Cap rate 8.3% vs local median 6.0% in Baltimore — top-decile yield for the area; either an underpriced asset or a hidden risk that comps aren't pricing in. Stress-test before assuming the spread holds.
Location & tenants
- Location reads 76/100 on livability (#90 in MD, #3,396 nationally) — a middle-class / working-renter tenant base. Strengths: amenities A+, commute A+, housing A+; Watch: crime F.
- Baltimore City Public Schools (urban): math 7% / reading 16% proficiency, ranked #24 of 24 in MD (top 100%) — low school quality limits family demand, transient renter base, plan for 1-2y turnover; 79% free/reduced lunch — lower-income household profile, screen leases tightly.
- Zoned schools: Elmer A. Henderson: A Johns Hopkins Partnership (math 2% / reading 16%, grade F, #650 of 860 statewide, top 77%, 642 students, 80% FRL); Baltimore Polytechnic Institute (math 71% / reading 84%, grade A-, #22 of 222 statewide, top 10%, 1,555 students, 43% FRL) — zoned schools average 62% FRL vs 79% district-wide (17 pts lower); this property's tenant base skews higher-income than the district average.
- Zoned-school proficiency averages 43% at this address vs 12% district-wide (+32 pts) — the actual schools serving this property are materially stronger than the Baltimore City Public Schools average implies; a family-tenant draw the district grade alone would hide.
- Market conditions: Rents rising (+1.6%/yr); 330 active listings in the ZIP; 40 comparable units currently listed for rent nearby; rentals at typical pace (median 26d on market — plan ~3-4 weeks tenant-placement turnaround); 1,273 units permitted in Baltimore city in 2024 (1,104 in 5+ unit buildings).
- This rent runs 39% of the median local income ($62k/yr) — at the standard rent-burdened threshold; future hikes will face affordability resistance.
Forward outlook
- Local home prices are declining (-3.0%/yr); year-one equity from $1k of loan paydown is wiped out by about $6k of value loss. Plan a longer hold.
- Baltimore County population projected to shrink 4% by 2050 — rents likely to lag national; underwrite the cash flow, not the appreciation.
Negotiation context
- Only 10 days on market — expect competitive offers; lowballing is unlikely to land.
- 2 sale attempts since 8y ago with the ask held roughly flat each time — persistent listings suggest the price (not the market) is what's stuck; bring a comps-based counter.
- Current owner paid $26k; list at $200k implies a 669% gain — meaningful room to come down on a strong offer.
Risks & watch-outs
- Watch-outs: built in 1930 — expect roof / HVAC / electrical / plumbing capex.
- Climate carrying-cost: major wind risk, 27% chance of damaging wind over 30y; extreme-heat days projected 7→15/yr by 2055 (HVAC capex compounding) — expect insurance premiums to compound above CPI over the hold.
Questions for the listing agent
- Built in 1930 — when were the roof, HVAC, electrical panel, plumbing, and water heater last replaced?
- Is there a deadline driving the sale (1031 exchange, divorce, estate, relocation)? That informs how much negotiation room exists.
- Schools are D-rated, which usually means shorter tenancies and higher turnover. Who's the typical renter profile here, and what's been the actual vacancy rate?
- Crime grade is F in this area — have there been break-ins, vandalism, or insurance claims at this property in the last 3 years? What carrier currently insures it and at what premium?
- What's the average days-on-market for RENTAL listings here right now (not sales)? A rising rental-DOM trend means longer vacancies and softer asking-rent achievability than the comps imply.
- What's the recent tenant-quality profile in this submarket — average credit score on applications, eviction rate, late-payment / NSF rate, and stable-employment percentage? A property-management company in the area should have these aggregated.
- How much new for-sale + rental construction is in the pipeline within 1–3 miles? Heavy new supply typically softens prices + rents 12–24 months out; constrained supply supports both.
Investment metrics
- 1% rule
- 1.03% ✓
- Cap rate
- 8.31%
- Cash-on-cash
- 7.20%
- DSCR
- 1.32
- GRM
- 8.1
CMA / ARV
- ARV (on-the-fly)
- $237,519
- Comps found
- 12
Show comp detail 12 sales within ~0.75 mi
| Address | Dist | Beds/Ba | Sqft | Sold | Price | $/sf | Match |
|---|---|---|---|---|---|---|---|
| 1632 E 31st St | 0.09mi | 3/1.0 (-1) | 1,280 (-8%) | 0mo | $94,500 | $74 | 76 |
| 1809 E 32nd St | 0.16mi | 3/1.5 (-1) | 1,280 (-8%) | 1mo | $82,000 | $64 | 74 |
| 1723 E 32nd St | 0.11mi | 3/2.0 (-1) | 1,280 (-8%) | 2mo | $128,000 | $100 | 73 |
| 3807 Elkader Rd | 0.70mi | 4/2.0 | 1,352 (-3%) | 0mo | $235,000 | $174 | 61 |
| 3825 Elkader Rd | 0.73mi | 4/2.0 | 1,352 (-3%) | 1mo | $275,000 | $203 | 59 |
| 2770 The Alameda | 0.35mi | 3/1.0 (-1) | 1,250 (-10%) | 3mo | $115,000 | $92 | 58 |
| 831 E 33rd St | 0.58mi | 3/2.0 (-1) | 1,470 (+6%) | 2mo | $300,000 | $204 | 54 |
| 2545 Cecil Ave | 0.64mi | 3/2.5 (-1) | 1,318 (-5%) | 1mo | $215,000 | $163 | 52 |
| 3626 Kimble Rd | 0.58mi | 3/1.0 (-1) | 1,280 (-8%) | 2mo | $310,000 | $242 | 51 |
| 1120 Montpelier St | 0.56mi | 3/2.0 (-1) | 1,260 (-9%) | 2mo | $70,000 | $56 | 50 |
| 1101 Andover Rd | 0.74mi | 4/2.0 | 1,500 (+8%) | 2mo | $257,000 | $171 | 49 |
| 2559 Garrett Ave | 0.60mi | 3/3.0 (-1) | 1,202 (-14%) | 2mo | $205,000 | $171 | 37 |
Match score weights: distance 35% · size 25% · config 20% · recency 20%. Top-matched comps best support the ARV.
Projected returns pro-forma
-3.0% appreciation · 1.63% rent growth · sell at horizon
- IRR
- -6.8%
- Equity multiple
- 0.75×
- Total profit
- $-13,822
- Equity at exit
- $29,806
- IRR
- 1.1%
- Equity multiple
- 1.08×
- Total profit
- $4,243
- Equity at exit
- $17,284
Cash invested: $55,972 (down + closing). Projections, not guarantees.
Landlord ↔ Tenant lean methodology
- Overall (CITY)
- 12 Strongly Tenant-Friendly
- State Maryland
- 27 Tenant-Leaning · D+14
- County
- — inherits STATE
- City Baltimore
- 12 Strongly Tenant-Friendly · D+58
ZIP-level market 21218
- Rents YoY
- 1.6%
- Active inventory
- 330
- Price-to-rent
- 8.1×
Monthly cashflow live
- Estimated rent
- $2,056 high interval (Pro) →
- Mortgage (P&I)
- −$1,048
- Tax from tax record
- −$157 /mo · $1,881/yr
- Insurance
- −$83
- HOA
- −$0
- Vacancy / Maint / Mgmt
- −$432
- Net cashflow
- $336
Break-even live
Sensitivity live
| Price | -10% $449 | -5% $392 | +0% $336 | +5% $279 | +10% $223 |
|---|---|---|---|---|---|
| Rent | -10% $173 | -5% $255 | +0% $336 | +5% $417 | +10% $498 |
| Rate | -1.0pp $437 | -0.5pp $387 | base $336 | +0.5pp $284 | +1.0pp $231 |
UW: 25.0% down · 7.5% · 30yr · 1.5% tax · 5.0% vac · 8.0% maint · 8.0% mgmt
Financing live
Cash to close
- Down payment
- $49,975
- Closing costs
- $5,997
- Reserves months
- —
- Total cash needed
- —
Loan-product check · same deal, 3 products live
Conventional
25% down · 7.5% · 30yr
- Down + closing
- —
- Monthly P&I
- —
- Monthly cashflow
- —
- DSCR
- —
- Eligible?
- —
Personal DTI + credit; lowest rate.
DSCR
20% down · 8.5% · 30yr
- Down + closing
- —
- Monthly P&I
- —
- Monthly cashflow
- —
- DSCR
- —
- Eligible?
- —
No personal income docs; deal must DSCR.
Hard money
10% down · 12.0% · 12mo
- Down + closing
- —
- Monthly P&I
- —
- Monthly cashflow
- —
- DSCR
- —
- Eligible?
- —
Short-term bridge; refi at stabilization.
Rent comps 40 comps
| Address | Beds | Baths | Sqft | Rent | $/sqft | DOM | Units | Dist |
|---|---|---|---|---|---|---|---|---|
| 1702 E 32nd St Baltimore, MD | 3.0 | 2.0 | 1344 | $2,300 | $1.71 | 45d | 1 | 0.06mi |
| 2915 Kirk Ave Baltimore, MD | 4.0 | 2.5 | 1710 | $2,200 | $1.29 | 0d | 1 | 0.17mi |
| 1519 E 28th St Baltimore, MD | 3.0 | 2.0 | 1100 | $1,350 | $1.23 | 45d | 1 | 0.24mi |
| 1802 E 28th St Baltimore, MD | 3.0 | 1.0 | 1300 | $1,600 | $1.23 | 25d | 1 | 0.24mi |
| 1832 E 28th St Baltimore, MD | 3.0 | 1.0 | 1066 | $1,495 | $1.40 | 25d | 1 | 0.27mi |
| 1539 Abbotston St Baltimore, MD | 3.0 | 2.0 | 1800 | $1,995 | $1.11 | 45d | 1 | 0.29mi |
| 1502 Fernley Rd Baltimore, MD | 3.0 | 2.0 | 1350 | $2,800 | $2.07 | 45d | 1 | 0.33mi |
| 2624 Garrett Ave Baltimore, MD | 3.0 | 1.0 | 1400 | $1,750 | $1.25 | 0d | 1 | 0.52mi |
| 3616 Yolando Rd Baltimore, MD | 3.0 | 2.0 | 1360 | $1,900 | $1.40 | 0d | 1 | 0.55mi |
| 3222 Ellerslie Ave Baltimore, MD | 4.0 | 1.5 | 1550 | $1,950 | $1.26 | 45d | 1 | 0.58mi |
| 724 E 35th St Baltimore, MD | 3.0 | 1.5 | 1368 | $2,000 | $1.46 | 16d | 1 | 0.72mi |
| 925 Chestnut Hill Ave Baltimore, MD | 3.0 | 1.0 | 1280 | $1,895 | $1.48 | 0d | 1 | 0.73mi |
| 2328 Aiken St Baltimore, MD | 3.0 | 1.0 | 1406 | $1,650 | $1.17 | 0d | 1 | 0.77mi |
| 616 Montpelier St Baltimore, MD | 3.0 | 1.0 | 1150 | $1,750 | $1.52 | 12d | 1 | 0.78mi |
| 1607 Cliftview Ave Baltimore, MD | 3.0 | 1.0 | 1200 | $1,475 | $1.23 | 45d | 1 | 0.84mi |
| 3721 Ellerslie Ave Baltimore, MD | 1.0–3.0 | 1.0–2.0 | 924 | $1,603 | $1.73 | 0d | 1 | 0.84mi |
| 2310 Aisquith St Baltimore, MD | 4.0 | 3.0 | 900 | $2,000 | $2.22 | 6d | 1 | 0.84mi |
| 1539 Ralworth Rd Baltimore, MD | 3.0 | 2.0 | 1580 | $1,950 | $1.23 | 16d | 1 | 0.84mi |
| 519 E 28th St Baltimore, MD | 3.0 | 2.0 | 1500 | $2,000 | $1.33 | 6d | 1 | 0.88mi |
| 1617 Argonne Dr Baltimore, MD | 4.0 | 2.0 | 1200 | $2,550 | $2.12 | 45d | 1 | 0.90mi |
| 3529 Greenmount Ave Baltimore, MD | 3.0 | 2.0 | 1316 | $1,575 | $1.20 | 45d | 1 | 0.93mi |
| 3203 Clarence Ave Baltimore, MD | 5.0 | 1.0 | 1388 | $1,865 | $1.34 | 45d | 1 | 0.98mi |
| 420 E 28th St Unit 1 Baltimore, MD | 5.0 | 2.5 | 1600 | $2,600 | $1.62 | 6d | 1 | 0.99mi |
| 348 E University Pkwy Baltimore, MD | 4.0 | 2.0 | 1809 | $2,400 | $1.33 | 45d | 1 | 1.00mi |
| 402 E 28th St Baltimore, MD | 3.0 | 1.0 | 1436 | $2,200 | $1.53 | 45d | 1 | 1.01mi |
| 450 E Lorraine Ave Baltimore, MD | 3.0 | 1.0 | 1344 | $1,695 | $1.26 | 45d | 1 | 1.01mi |
| 2113 Belair Rd Baltimore, MD | 4.0 | 1.0 | 1344 | $1,795 | $1.34 | 0d | 1 | 1.04mi |
| 428 E Lorraine Ave Unit 1 Baltimore, MD | 3.0 | 1.5 | 1344 | $1,875 | $1.40 | 45d | 1 | 1.04mi |
| 428 E Lorraine Ave Baltimore, MD | 3.0 | 2.0 | 1344 | $1,875 | $1.40 | 25d | 1 | 1.04mi |
| 411 E Lorraine Ave Baltimore, MD | 3.0 | 1.5 | 1344 | $2,200 | $1.64 | 25d | 1 | 1.07mi |
| 400 E Lorraine Ave Baltimore, MD | 3.0 | 1.0 | 1500 | $1,800 | $1.20 | 22d | 1 | 1.07mi |
| 2828 Lake Ave Baltimore, MD | 3.0 | 2.0 | 1164 | $1,850 | $1.59 | 6d | 1 | 1.08mi |
| 3221 Guilford Ave Apt A Baltimore, MD | 3.0 | 1.5 | 1025 | $2,925 | $2.85 | 19d | 1 | 1.08mi |
| 3218 Lyndale Ave Baltimore, MD | 3.0 | 1.5 | 1020 | $1,500 | $1.47 | 25d | 1 | 1.08mi |
| 3222 Lyndale Ave Unit 1 Baltimore, MD | 3.0 | 1.5 | 1500 | $2,200 | $1.47 | 14d | 1 | 1.09mi |
| 2735 Chesterfield Ave Baltimore, MD | 3.0 | 2.5 | 1536 | $2,000 | $1.30 | 12d | 1 | 1.09mi |
| 1814 E Lafayette Ave Baltimore, MD | 4.0 | 2.0 | 1200 | $1,995 | $1.66 | 25d | 1 | 1.11mi |
| 1333 E North Ave Baltimore, MD | 4.0 | 2.5 | 1860 | $2,200 | $1.18 | 25d | 1 | 1.12mi |
| 2516 Barclay St Baltimore, MD | 3.0 | 1.0 | 992 | $1,375 | $1.39 | 18d | 1 | 1.13mi |
| 2817 Pelham Ave Baltimore, MD | 3.0 | 2.0 | 1464 | $1,950 | $1.33 | 25d | 1 | 1.13mi |
Listing history 7 events
-
2026-06-21days on market $199,900 Active 10 DOM
-
2026-06-18days on market $199,900 Active 7 DOM
-
2026-06-17days on market $199,900 Active 6 DOM
-
2026-06-16days on market $199,900 Active 5 DOM
-
2026-06-15days on market $199,900 Active 4 DOM
-
2026-06-13remarks 699-char remark
-
2026-06-13$199,900 Active 2 DOM
ⓘ Source: listings_history table (triggers on properties + properties_extension) + one-shot
backfill from property_details.listing_events for pre-trigger history.
Tax reassessment forecast MD · Partial reset (capped growth)
- Current annual tax
- $1,881 · $157/mo
- Projected year-2 tax
- $2,030 · $169/mo
- Expected delta
- +$149/yr (+$12/mo · 7.9%)
ⓘ Screening estimate from a state-policy table — verify with the county assessor before closing.
Climate risk First Street
- Flood 1/10 Low FEMA zone X (unshaded) · 0% chance over 30 yrs
- Wildfire 1/10 Low
- Heat 7/10 Severe 7 d/yr ≥103°F today · 15 d/yr by 30 yrs out
- Wind 6/10 Major 27% chance of damaging wind over 30 yrs
- Air quality 4/10 Moderate 6 unhealthy d/yr today · 7 by 30 yrs out
Nearby sold comps map
Loading sold comps map…
Walkable amenities ~0.75 mi
Loading nearby amenities…
Taxation est. · year 1
- Rental income
- $24,672
- − Mortgage interest
- −$11,198
- − Property taxes
- −$1,881
- − Insurance
- −$1,000
- − Repairs & maintenance
- −$1,974
- − Management
- −$1,974
- − Depreciation
- −$5,815
- Taxable income
- $831
- Est. tax owed @ 24.0%
- −$199
- After-tax cash flow
- $3,831/yr
For passive investors: Depreciation is non-cash, so a rental often shows a tax loss while cash-flowing — sheltering income. Rental losses are passive: they offset passive income freely, and up to $25,000/yr can offset ordinary (W-2) income if you actively participate and your MAGI is under $100k (phasing out to $0 by $150k); unused losses carry forward. On sale, claimed depreciation is recaptured at up to 25%, and gains may owe capital-gains tax (a 1031 exchange can defer both). Figures are a year-1 estimate at your 24.0% rate — not tax advice; consult a CPA.
Schools (NCES district)
- District
- Baltimore City Public Schools
- NCES district ID
- 2400090
- Math proficiency
- 7% ▼ -9.00%
- Reading proficiency
- 16% ▼ -5.00%
- Median HH income
- $42,108
- Composite
- 10.08/100
- National rank
- #9805
- State rank
- #24 of 24 in MD
Livability — Baltimore
- Score
- 76/100
- State rank
- #90
- US rank
- #3396
Category grades
Schools grade is shown separately in the Schools card above.
Census & demographics
- Census place
- Baltimore, MD
- County
- Baltimore City · 558,601 people
- City population
- 588,727
- Metro
- Baltimore-Columbia-Towson, MD
- Population (ZIP)
- 44,014
- Household income
- $62,488
- Rent vs Own
- Severe rent burden
- 2564.0
Population outlook (Baltimore County) Hauer SSP2
- Today (2025)
- 624,249 people
- By 2030
- 621,541 · -0.4%
- By 2040
- 609,756 · -2.3%
- By 2050
- 597,249 · -4.3%
- By 2075
- 552,236 · -11.5%
- By 2100
- 513,934 · -17.7%
Race, ethnicity, and origin ACS 2023
- Neighborhood character
- Diverse neighborhood (Simpson 0.58)
- Race & ethnicity
- Black 60% White 26% Two or more races 6% Hispanic / Latino 5% Asian 5%
- Hispanic origin (detail)
- Common ancestry
- Romanian 2% Italian 1% Scotch-Irish 1%
- Foreign-born
- 10% · Canada, China, South Korea
- Languages at home
- 87% English-only · Spanish 4% French/Haitian/Cajun 2% Chinese 2%
Political lean MEDSL · Baltimore
- 2024 margin
- Solid D (+73.0) · D 85.2% · R 12.2% · Other 2.6%
- 2008→2024 swing
- -2.5pp toward R · 2008: 75.5pp · 2024: 73.0pp
- All cycles
- 2024: D+73.0 2020: D+76.6 2016: D+74.6 2012: D+76.4 2008: D+75.5
Not yet ingested
- Civics
- —
Market trends
- HPI YoY
- ▼ -463.14%
- Current HPI
- 292.3986
- Rent YoY
- ▲ 1.63%
- Metro
- Baltimore-Columbia-Towson, MD
- State GDP YoY
- ▲ 2.97%
- F500 in state
- 12
Industry mix (Fortune 500 HQ in MD)
| Industry | F500 HQs | Revenue |
|---|---|---|
| Aerospace / Defense | 1 | $71B |
|
||
| Utilities | 1 | $25B |
|
||
| Hotels | 1 | $24B |
|
||
| Consumer Goods | 1 | $7B |
|
||
| Real Estate | 1 | $6B |
|
||
| Chemicals | 1 | $2B |
|
||
Price history
+299.8% since first listed5 events — show timeline
- 2026-06-11 Listed $199,900 BRIGHT MLS
- 2019-03-31 Sold (MLS) $26,000 BRIGHT MLS
- 2019-02-06 Pending — BRIGHT MLS
- 2019-01-19 Price Changed $25,000 BRIGHT MLS
- 2018-10-29 Listed $50,000 BRIGHT MLS
Property tax history
-0.0%/yrLatest (2025): $1,881 · +4.3% YoY. Source: county tax records.
Cash-flow waterfall
monthlySold comps — $/sqft
last 12 mo · ≤1 miLoading sold comps…