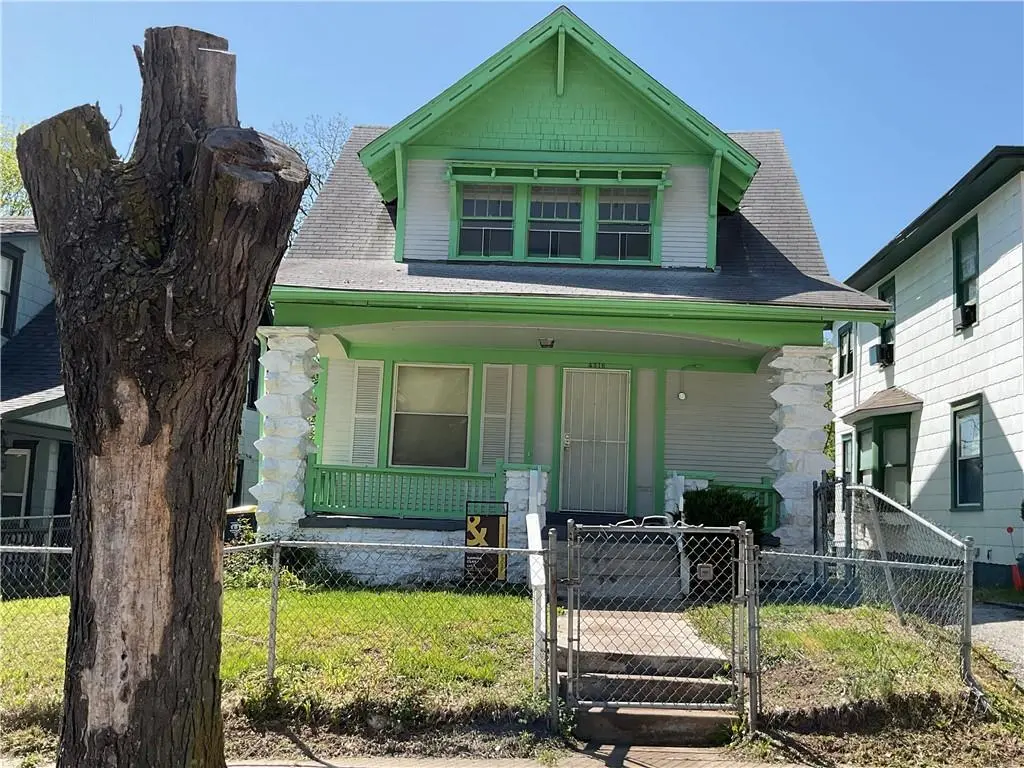
4516 Montgall Ave · Kansas City, MO
Flood risk 1/10 · Minimal
- FEMA flood zone
- X (unshaded)
- Chance of flooding over 30 yrs
- 0.0%
- Est. flood insurance / yr
- $473 – $860
Fire risk 1/10 · Minimal
- Est. fire insurance / yr
- $1,054 – $1,958
Heat risk 4/10 · Minor
- Hot days now (above 107°F)
- 7 days/yr
- Hot days in 30 yrs
- 17 days/yr
Wind risk 2/10 · Minimal
- Chance of severe wind over 30 yrs
- —
Air-quality risk 3/10 · Minor
- Unhealthy air days now
- 2 days/yr
- Unhealthy air days in 30 yrs
- 4 days/yr
Risk factors via First Street. Map © Google.
Why this score? — see what drove the B- grade
The composite is a weighted blend of 9 inputs, each scored 0–100. Each bar is that input's sub-score; the figure is the points it added to the 100-point composite (weight × sub-score).
- Cash flow +30.0/30.0
- ARV discount +10.6/15.0
- DSCR +10.0/10.0
- 1% rule +7.6/10.0
- Livability +3.9/5.0
- Rent growth +3.6/5.0
- Condition / age +2.5/5.0
- Schools +1.5/10.0
- Appreciation +0.0/10.0
$128,000
🖨 Deal sheet (PDF) 📄 Offer letter ✓ Due diligence
Listing remarks
Within the past year, the seller has completed updates to both the HVAC system and the electrical system. These improvements were professionally performed, and transferable warranties for the HVAC and electrical work are available. The seller has also obtained quotes for roof work, which will be provided to the buyer upon request to assist in evaluating potential future maintenance. Additionally, the property was recently exterminated as part of routine maintenance. Documentation or service details can be made available to the buyer.
Key facts
- Recent extermination
- Roof work quotes
- Hvac system updates
Tags
Neighborhood map
What this means for you Summary
Snapshot
- This is a 3-bed/1.0-bath single-family listed at $128k.
Deal economics
- At list price, monthly cash flow is $499 ($6k/yr) — positive.
- The deal already cash-flows at list — no discount required.
- Meets the 1% rule at list price ($2k rent vs $128k).
- Cap rate 11.0% vs local median 3.9% in Kansas City — top-decile yield for the area; either an underpriced asset or a hidden risk that comps aren't pricing in. Stress-test before assuming the spread holds.
Location & tenants
- Location reads 78/100 on livability (#28 in MO, #2,671 nationally) — a middle-class / working-renter tenant base. Strengths: amenities A+, commute A+, cost of living A+; Watch: crime F.
- Kansas City 33 (urban): math 12% / reading 24% proficiency, ranked #308 of 324 in MO (top 95%) — low school quality limits family demand, transient renter base, plan for 1-2y turnover; 75% free/reduced lunch — lower-income household profile, screen leases tightly.
- Zoned schools: M. L. King Elementary (math 2% / reading 8%, grade F, #1,072 of 1,115 statewide, top 98%, 665 students, 100% FRL); Central Middle School (math 0% / reading 9%, grade F, #388 of 391 statewide, top 99%, 428 students, 99% FRL); Central High School (math 2% / reading 17%, grade F, #507 of 521 statewide, top 98%, 535 students, 99% FRL) — zoned schools average 99% FRL vs 75% district-wide (24 pts higher); higher-poverty schools than district average — tighter screening recommended.
- Market conditions: Rents rising fast (+4.4%/yr); 185 active listings in the ZIP; 40 comparable units currently listed for rent nearby; rentals at typical pace (median 26d on market — plan ~3-4 weeks tenant-placement turnaround); lower-income renter base — watch delinquency; 4,002 units permitted in Jackson County in 2024 (2,271 in 5+ unit buildings).
- At $1,613/mo this rent would consume 46% of the median local household income ($42k/yr) (locally 1132% of renters already pay >50% of income on rent) — very limited rent-growth headroom before tenants either downsize or default.
Forward outlook
- Local home prices are declining (-3.0%/yr); year-one equity from $885 of loan paydown is wiped out by about $4k of value loss. Plan a longer hold.
- Jackson County population projected at +4% by 2050 — modest demand growth; plan on rents tracking national, not racing it.
- At projected returns (-3.0% appreciation + 4.4% rent growth), your $36k cash investment doubles in ~7 years — after that, you're playing with house money.
Negotiation context
- Only 1 days on market — expect competitive offers; lowballing is unlikely to land.
- 4 sale attempts since 2y ago with the ask held roughly flat each time — persistent listings suggest the price (not the market) is what's stuck; bring a comps-based counter.
Risks & watch-outs
- Watch-outs: built in 1913 — expect roof / HVAC / electrical / plumbing capex.
Questions for the listing agent
- Built in 1913 — when were the roof, HVAC, electrical panel, plumbing, and water heater last replaced?
- Is there a deadline driving the sale (1031 exchange, divorce, estate, relocation)? That informs how much negotiation room exists.
- Crime grade is F in this area — have there been break-ins, vandalism, or insurance claims at this property in the last 3 years? What carrier currently insures it and at what premium?
- What's the average days-on-market for RENTAL listings here right now (not sales)? A rising rental-DOM trend means longer vacancies and softer asking-rent achievability than the comps imply.
- What's the recent tenant-quality profile in this submarket — average credit score on applications, eviction rate, late-payment / NSF rate, and stable-employment percentage? A property-management company in the area should have these aggregated.
- How much new for-sale + rental construction is in the pipeline within 1–3 miles? Heavy new supply typically softens prices + rents 12–24 months out; constrained supply supports both.
Investment metrics
- 1% rule
- 1.26% ✓
- Cap rate
- 10.97%
- Cash-on-cash
- 16.69%
- DSCR
- 1.74
- GRM
- 6.6
CMA / ARV
- ARV (on-the-fly)
- $137,600
- Comps found
- 12
Show comp detail 12 sales within ~0.75 mi
| Address | Dist | Beds/Ba | Sqft | Sold | Price | $/sf | Match |
|---|---|---|---|---|---|---|---|
| 4321 Bellefontaine Ave | 0.36mi | 3/1.5 | 1,664 (+4%) | 1mo | $199,000 | $120 | 74 |
| 4617 S Benton St | 0.18mi | 3/1.0 | 1,430 (-11%) | 1mo | $90,000 | $63 | 73 |
| 4221 Chestnut Ave | 0.37mi | 4/1.5 (+1) | 1,694 (+6%) | 1mo | $110,000 | $65 | 65 |
| 4125 Chestnut Ave | 0.49mi | 3/1.0 | 1,711 (+7%) | 1mo | $60,000 | $35 | 65 |
| 4210 Montgall Ave | 0.38mi | 4/2.0 (+1) | 1,682 (+5%) | 1mo | $74,900 | $45 | 64 |
| 4235 Chestnut Ave | 0.33mi | 3/2.0 | 1,800 (+12%) | 5mo | $167,500 | $93 | 56 |
| 4200 Monroe Ave | 0.73mi | 3/2.0 | 1,623 (+1%) | 5mo | $100,000 | $62 | 55 |
| 4423 Flora Ave | 0.73mi | 4/2.0 (+1) | 1,636 (+2%) | 1mo | $140,000 | $86 | 53 |
| 4230 Benton Blvd | 0.44mi | 3/2.0 | 1,410 (-12%) | 6mo | $125,000 | $89 | 51 |
| 4142 Montgall Ave | 0.44mi | 3/1.5 | 1,822 (+14%) | 6mo | $140,000 | $77 | 49 |
| 4200 Agnes Ave | 0.45mi | 4/2.0 (+1) | 1,399 (-13%) | 6mo | $189,000 | $135 | 44 |
| 5038 S Benton Ave | 0.69mi | 4/3.0 (+1) | 1,460 (-9%) | 2mo | $147,000 | $101 | 39 |
Match score weights: distance 35% · size 25% · config 20% · recency 20%. Top-matched comps best support the ARV.
Projected returns pro-forma
-3.0% appreciation · 4.42% rent growth · sell at horizon
- IRR
- 9.3%
- Equity multiple
- 1.37×
- Total profit
- $13,305
- Equity at exit
- $19,085
- IRR
- 19.5%
- Equity multiple
- 2.73×
- Total profit
- $62,170
- Equity at exit
- $11,067
Cash invested: $35,840 (down + closing). Projections, not guarantees.
Landlord ↔ Tenant lean methodology
- Overall (STATE)
- 81 Strongly Landlord-Friendly
- State Missouri
- 81 Strongly Landlord-Friendly · R+10
- County
- — inherits STATE
- City
- — inherits STATE
ZIP-level market 64130
- Home prices YoY
- -21.5%
- Rents YoY
- 4.4%
- Active inventory
- 185
- Price-to-rent
- 6.6×
Monthly cashflow live
- Estimated rent
- $1,613 high interval (Pro) →
- Mortgage (P&I)
- −$671
- Tax from tax record
- −$51 /mo · $611/yr
- Insurance
- −$53
- HOA
- −$0
- Vacancy / Maint / Mgmt
- −$339
- Net cashflow
- $499
Break-even live
Sensitivity live
| Price | -10% $571 | -5% $535 | +0% $499 | +5% $462 | +10% $426 |
|---|---|---|---|---|---|
| Rent | -10% $371 | -5% $435 | +0% $499 | +5% $562 | +10% $626 |
| Rate | -1.0pp $563 | -0.5pp $531 | base $499 | +0.5pp $465 | +1.0pp $432 |
UW: 25.0% down · 7.5% · 30yr · 1.5% tax · 5.0% vac · 8.0% maint · 8.0% mgmt
Financing live
Cash to close
- Down payment
- $32,000
- Closing costs
- $3,840
- Reserves months
- —
- Total cash needed
- —
Loan-product check · same deal, 3 products live
Conventional
25% down · 7.5% · 30yr
- Down + closing
- —
- Monthly P&I
- —
- Monthly cashflow
- —
- DSCR
- —
- Eligible?
- —
Personal DTI + credit; lowest rate.
DSCR
20% down · 8.5% · 30yr
- Down + closing
- —
- Monthly P&I
- —
- Monthly cashflow
- —
- DSCR
- —
- Eligible?
- —
No personal income docs; deal must DSCR.
Hard money
10% down · 12.0% · 12mo
- Down + closing
- —
- Monthly P&I
- —
- Monthly cashflow
- —
- DSCR
- —
- Eligible?
- —
Short-term bridge; refi at stabilization.
Rent comps 40 comps
| Address | Beds | Baths | Sqft | Rent | $/sqft | DOM | Units | Dist |
|---|---|---|---|---|---|---|---|---|
| 4427 Agnes Ave Kansas City, MO | 3.0 | 1.0 | 1100 | $1,350 | $1.23 | 18d | 1 | 0.22mi |
| 4511 Park Ave Kansas City, MO | 4.0 | 2.5 | 1915 | $1,982 | $1.03 | 25d | 1 | 0.24mi |
| 4119 S Benton Ave Kansas City, MO | 4.0 | 2.0 | 1700 | $1,800 | $1.06 | 45d | 1 | 0.50mi |
| 4653 Benton Blvd Kansas City, MO | 3.0 | 2.0 | 1594 | $1,600 | $1.00 | 9d | 1 | 0.54mi |
| 4116 Bellefontaine Ave Kansas City, MO | 3.0 | 1.0 | 1234 | $1,000 | $0.81 | 25d | 1 | 0.54mi |
| 4107 Olive St Kansas City, MO | 3.0 | 1.5 | 1271 | $1,578 | $1.24 | 9d | 1 | 0.55mi |
| 4144 College Ave Kansas City, MO | 3.0 | 1.0 | 1108 | $1,095 | $0.99 | 25d | 1 | 0.56mi |
| 4112 Park Ave Kansas City, MO | 4.0 | 2.0 | 1700 | $1,800 | $1.06 | 16d | 1 | 0.57mi |
| 4018 Prospect Ave Kansas City, MO | 4.0 | 1.5 | 1900 | $1,695 | $0.89 | 45d | 1 | 0.62mi |
| 4219 Woodland Ave Kansas City, MO | 4.0 | 2.0 | 1566 | $1,900 | $1.21 | 3d | 1 | 0.64mi |
| 4211 Woodland Ave Kansas City, MO | 4.0 | 2.5 | 1926 | $2,010 | $1.04 | 18d | 1 | 0.66mi |
| 4935 College Ave Kansas City, MO | 3.0 | 1.0 | 1216 | $1,350 | $1.11 | 25d | 1 | 0.67mi |
| 4014 Park Ave Kansas City, MO | 3.0 | 2.0 | 1271 | $1,273 | $1.00 | 45d | 1 | 0.68mi |
| 5038 S Benton Ave Kansas City, MO | 4.0 | 3.0 | 1500 | $1,875 | $1.25 | 23d | 1 | 0.69mi |
| 2420 E 51st St Kansas City, MO | 3.0 | 2.0 | 1460 | $1,350 | $0.92 | 25d | 1 | 0.71mi |
| 4910 Michigan Ave Kansas City, MO | 3.0 | 1.5 | 1199 | $1,400 | $1.17 | 9d | 1 | 0.71mi |
| 3902 Wabash Ave Kansas City, MO | 4.0 | 2.0 | 1400 | $1,850 | $1.32 | 45d | 1 | 0.78mi |
| 5114 Brooklyn Ave Kansas City, MO | 3.0 | 1.5 | 1116 | $1,300 | $1.16 | 9d | 1 | 0.82mi |
| 3840 Bellefontaine Ave Kansas City, MO | 3.0 | 1.0 | 1500 | $1,500 | $1.00 | 18d | 1 | 0.83mi |
| 3817 S Benton Ave Kansas City, MO | 4.0 | 1.5 | 1380 | $1,650 | $1.20 | 25d | 1 | 0.88mi |
| 5115 Woodland Ave Kansas City, MO | 4.0 | 1.0 | 1136 | $1,700 | $1.50 | 45d | 1 | 0.93mi |
| 5215 Walrond Ave Kansas City, MO | 4.0 | 2.0 | 1198 | $1,710 | $1.43 | 25d | 1 | 0.93mi |
| 4232 Virginia Ave Unit 3 Kansas City, MO | 3.0 | 1.0 | 1296 | $1,100 | $0.85 | 14d | 1 | 0.95mi |
| 4228 Virginia Ave Kansas City, MO | 3.0 | 1.0 | 1200 | $1,250 | $1.04 | 12d | 1 | 0.95mi |
| 3818 Indiana Ave Kansas City, MO | 3.0 | 1.5 | 1223 | $1,147 | $0.94 | 45d | 1 | 0.96mi |
| 4028 Myrtle Ave Kansas City, MO | 3.0 | 1.0 | 1100 | $1,490 | $1.35 | 45d | 1 | 0.98mi |
| 4610 Forest Ave Kansas City, MO | 3.0 | 2.0 | 1365 | $2,450 | $1.79 | 45d | 1 | 1.02mi |
| 4614 Forest Ave Kansas City, MO | 2.0 | 2.0 | 1265 | $1,995 | $1.58 | 18d | 1 | 1.03mi |
| 5241 Brookwood Ave Kansas City, MO | 3.0 | 2.0 | 1431 | $1,550 | $1.08 | 45d | 1 | 1.05mi |
| 3739 Bales Ave Kansas City, MO | 3.0 | 2.0 | 1400 | $1,575 | $1.12 | 25d | 1 | 1.05mi |
| 5120 The Paseo Apt 1 Kansas City, MO | 2.0 | 1.0 | 1500 | $1,550 | $1.03 | 45d | 1 | 1.08mi |
| 3630 Agnes Ave Kansas City, MO | 3.0 | 2.0 | 1448 | $1,500 | $1.04 | 12d | 1 | 1.08mi |
| 5122 Paseo Blvd Kansas City, MO | 3.0 | 1.0 | 1573 | $1,595 | $1.01 | 12d | 1 | 1.09mi |
| 4117 Forest Ave Kansas City, MO | 2.0 | 2.0 | 1300 | $1,390 | $1.07 | 25d | 1 | 1.10mi |
| 5344 Brooklyn Ave Kansas City, MO | 3.0 | 1.0 | 2040 | $1,495 | $0.73 | 9d | 1 | 1.12mi |
| 5414 Brooklyn Ave Kansas City, MO | 3.0 | 1.5 | 1856 | $1,650 | $0.89 | 18d | 1 | 1.17mi |
| 1330 Rockhurst Rd Kansas City, MO | 4.0 | 2.0 | 1984 | $2,500 | $1.26 | 45d | 1 | 1.18mi |
| 4220 Harrison St Unit 1S Kansas City, MO | 3.0 | 2.0 | 1200 | $1,795 | $1.50 | 9d | 1 | 1.20mi |
| 5410 Euclid Ave Kansas City, MO | 3.0 | 2.0 | 1119 | $1,395 | $1.25 | 45d | 1 | 1.20mi |
| 3920 Spruce Ave Kansas City, MO | 2.0 | 1.0 | 1968 | $1,195 | $0.61 | 25d | 1 | 1.21mi |
Listing history 8 events
-
2026-04-21status Pending
-
2026-04-21$128,000 Active
-
2025-07-22historical $1,300
-
2025-05-21$1,300
-
2025-05-14historical $1,300
-
2025-04-12$1,300
-
2024-05-07historical $450
-
2024-04-24$450
ⓘ Source: listings_history table (triggers on properties + properties_extension) + one-shot
backfill from property_details.listing_events for pre-trigger history.
Tax reassessment forecast MO · Resets to sale price
- Current annual tax
- $611 · $51/mo
- Projected year-2 tax
- $1,242 · $103/mo
- Expected delta
- +$630/yr (+$53/mo · 103.2%)
ⓘ Screening estimate from a state-policy table — verify with the county assessor before closing.
Climate risk First Street
- Flood 1/10 Low FEMA zone X (unshaded) · 0% chance over 30 yrs
- Wildfire 1/10 Low
- Heat 4/10 Moderate 7 d/yr ≥107°F today · 17 d/yr by 30 yrs out
- Wind 2/10 Low
- Air quality 3/10 Moderate 2 unhealthy d/yr today · 4 by 30 yrs out
Nearby sold comps map
Loading sold comps map…
Walkable amenities ~0.75 mi
Loading nearby amenities…
Taxation est. · year 1
- Rental income
- $19,353
- − Mortgage interest
- −$7,170
- − Property taxes
- −$611
- − Insurance
- −$640
- − Repairs & maintenance
- −$1,548
- − Management
- −$1,548
- − Depreciation
- −$3,724
- Taxable income
- $4,112
- Est. tax owed @ 24.0%
- −$987
- After-tax cash flow
- $4,996/yr
For passive investors: Depreciation is non-cash, so a rental often shows a tax loss while cash-flowing — sheltering income. Rental losses are passive: they offset passive income freely, and up to $25,000/yr can offset ordinary (W-2) income if you actively participate and your MAGI is under $100k (phasing out to $0 by $150k); unused losses carry forward. On sale, claimed depreciation is recaptured at up to 25%, and gains may owe capital-gains tax (a 1031 exchange can defer both). Figures are a year-1 estimate at your 24.0% rate — not tax advice; consult a CPA.
Schools (NCES district)
- District
- Kansas City 33
- NCES district ID
- 2916400
- Math proficiency
- 12% ▼ -8.00%
- Reading proficiency
- 24% ▬ 0.00%
- Median HH income
- $35,227
- Composite
- 14.8/100
- National rank
- #9387
- State rank
- #308 of 324 in MO
Livability — Kansas City
- Score
- 78/100
- State rank
- #28
- US rank
- #2671
Category grades
Schools grade is shown separately in the Schools card above.
Census & demographics
- Census place
- Kansas City, MO
- County
- Jackson County · 687,798 people
- City population
- 439,467
- Metro
- Kansas City, MO-KS
- Population (ZIP)
- 19,644
- Household income
- $42,221
- Rent vs Own
- Severe rent burden
- 1132.0
Population outlook (Jackson County) Hauer SSP2
- Today (2025)
- 719,589 people
- By 2030
- 731,456 · +1.6%
- By 2040
- 746,689 · +3.8%
- By 2050
- 749,289 · +4.1%
- By 2075
- 736,227 · +2.3%
- By 2100
- 668,210 · -7.1%
Race, ethnicity, and origin ACS 2023
- Neighborhood character
- Predominantly Black (80%)
- Race & ethnicity
- Black 80% White 9% Hispanic / Latino 8% Two or more races 6%
- Hispanic origin (detail)
- Mexican 5%
- Common ancestry
- Lithuanian 1% Swedish 0%
- Foreign-born
- 6% · Canada
- Languages at home
- 92% English-only · Spanish 7%
Political lean MEDSL · Jackson
- 2024 margin
- D (+19.3) · D 58.9% · R 39.5% · Other 1.6%
- 2008→2024 swing
- -6.1pp toward R · 2008: 25.4pp · 2024: 19.3pp
- All cycles
- 2024: D+19.3 2020: D+22.0 2016: D+16.6 2012: D+19.0 2008: D+25.4
Not yet ingested
- Civics
- —
Market trends
- HPI YoY
- ▼ -73.32%
- Current HPI
- 267.491
- Rent YoY
- ▲ 4.42%
- Metro
- Kansas City, MO-KS
- State GDP YoY
- ▲ 1.84%
- F500 in state
- 20
Industry mix (Fortune 500 HQ in MO)
| Industry | F500 HQs | Revenue |
|---|---|---|
| Healthcare | 1 | $163B |
|
||
| Insurance | 1 | $21B |
|
||
| Industrial Technology | 1 | $17B |
|
||
| Retail | 1 | $16B |
|
||
| Industrial Distribution | 1 | $10B |
|
||
| Utilities | 1 | $9B |
|
||
Price history
+9746.2% since first listed8 events — show timeline
- 2026-04-21 Pending — Heartland MLS as Distributed by MLS Grid
- 2026-04-21 Listed $128,000 Heartland MLS as Distributed by MLS Grid
- 2025-07-22 Rental Removed $1,300 TURBOTENANT
- 2025-05-21 Listed for Rent $1,300 TURBOTENANT
- 2025-05-14 Rental Removed $1,300 TURBOTENANT
- 2025-04-12 Listed for Rent $1,300 TURBOTENANT
- 2024-05-07 Rental Removed $450 TURBOTENANT
- 2024-04-24 Listed for Rent $450 TURBOTENANT
Property tax history
+2.9%/yrLatest (2025): $611 · -9.7% YoY. Source: county tax records.
Cash-flow waterfall
monthlySold comps — $/sqft
last 12 mo · ≤1 miLoading sold comps…