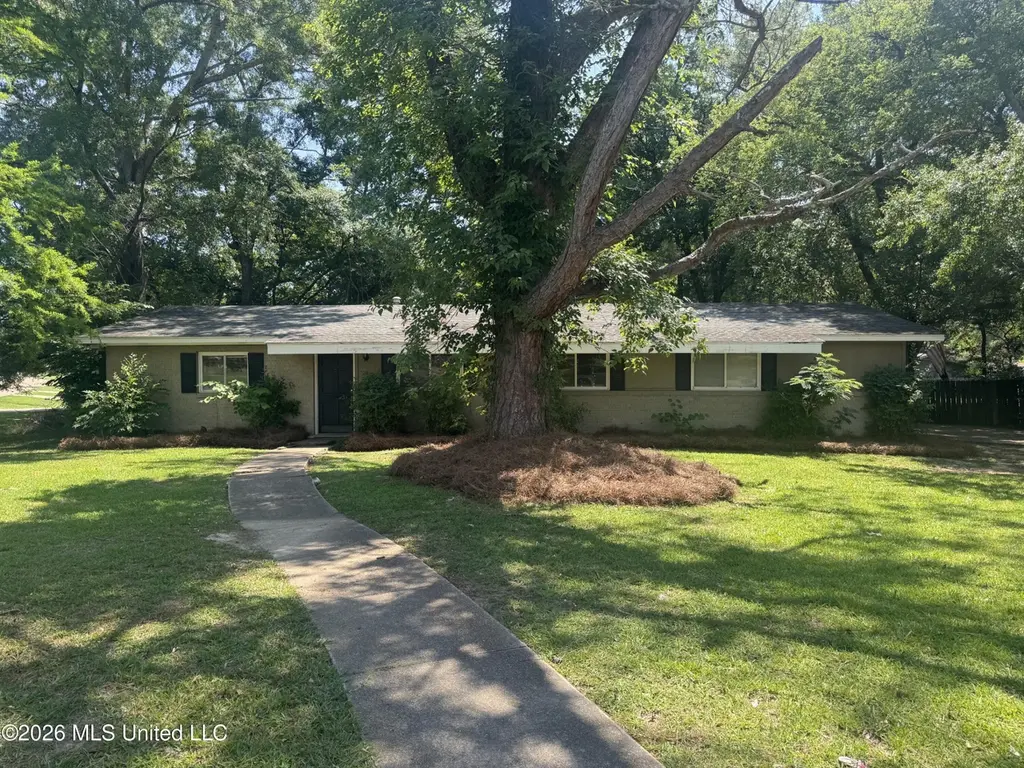
106 Melrose Dr · Jackson, MS
Flood risk 1/10 · Minimal
- FEMA flood zone
- X (shaded)
- Chance of flooding over 30 yrs
- 0.0%
- Est. flood insurance / yr
- $507 – $1,088
Fire risk 1/10 · Minimal
- Est. fire insurance / yr
- $1,241 – $2,305
Heat risk 7/10 · Major
- Hot days now (above 108°F)
- 7 days/yr
- Hot days in 30 yrs
- 20 days/yr
Wind risk 8/10 · Major
- Chance of severe wind over 30 yrs
- 80.0%
Air-quality risk 2/10 · Minimal
- Unhealthy air days now
- 0 days/yr
- Unhealthy air days in 30 yrs
- 1 days/yr
Risk factors via First Street. Map © Google.
Why this score? — see what drove the B+ grade
The composite is a weighted blend of 9 inputs, each scored 0–100. Each bar is that input's sub-score; the figure is the points it added to the 100-point composite (weight × sub-score).
- Cash flow +30.0/30.0
- ARV discount +15.0/15.0
- 1% rule +10.0/10.0
- DSCR +10.0/10.0
- Rent growth +4.5/5.0
- Livability +3.4/5.0
- Condition / age +2.5/5.0
- Schools +1.1/10.0
- Appreciation +0.0/10.0
$110,000
🖨 Deal sheet 📄 Offer letter ✓ Due diligence
Listing remarks
Don't miss this opportunity in a prime NE Jackson location! 3 bedroom and 2 bath. No Flood insurance required. Situated on a big corner lot. Come check it out and call your agent today! Seller will not accept any offer contingent on inspections. Please pre-inspect prior to making an offer.
Key facts
- Big corner lot
- 0.32 acre lot
- Garage
Tags
Property features AI
Exterior
- Parking: Attached garage; 2-space carport
- Utilities: Public water; Public sewer
- Home design: Single-family house, one level; Living area reported from public records
- Construction: Siding exterior; Slab foundation; Built year reported from public records
- Exterior features: Architectural shingle roof; Cable available
Interior
- Bathrooms: 2 full bathrooms
- Interior features: Central heating; Central air
Neighborhood map
What this means for you Summary
Snapshot
- This is a 3-bed/2.0-bath single-family listed at $110k.
Deal economics
- At list price, monthly cash flow is $582 ($7k/yr) — positive.
- The deal already cash-flows at list — no discount required.
- Meets the 1% rule at list price ($2k rent vs $110k).
- Recommended offer: $108k (1.5% below list) — sets the bar for market timing.
- Cap rate 12.6% vs local median 9.9% in Jackson — meaningfully above typical; check what's discounted (condition, days-on-market, listing class) to confirm the premium yield is real.
Location & tenants
- Location reads 68/100 on livability (#66 in MS) — a middle-class / working-renter tenant base. Strengths: commute A+, cost of living A+, housing A+; Watch: amenities F, employment F, health & safety F.
- Jackson Public School District (urban): math 9% / reading 18% proficiency, ranked #112 of 130 in MS (top 86%) — low school quality limits family demand, transient renter base, plan for 1-2y turnover; 88% free/reduced lunch — lower-income household profile, screen leases tightly.
- Zoned schools: Kirksey Middle School (math 7% / reading 13%, grade F, #152 of 179 statewide, top 88%, 247 students, 100% FRL); Murrah High School (math 12% / reading 27%, grade F, #130 of 197 statewide, top 68%, 1,326 students, 100% FRL).
- Market conditions: Rents rising fast (+7.9%/yr); 221 active listings in the ZIP; 30 comparable units currently listed for rent nearby; rentals at typical pace (median 23d on market — plan ~3-4 weeks tenant-placement turnaround); 167 units permitted in Hinds County in 2024 (0 in 5+ unit buildings).
Forward outlook
- Local home prices are declining (-3.0%/yr); year-one equity from $761 of loan paydown is wiped out by about $3k of value loss. Plan a longer hold.
- Hinds County population projected to shrink 6% by 2050 — rents likely to lag national; underwrite the cash flow, not the appreciation.
- At projected returns (-3.0% appreciation + 7.9% rent growth), your $31k cash investment doubles in ~5 years — after that, you're playing with house money.
Negotiation context
- It's been on market 18 days — a 2% lower offer ($108k) is reasonable based on typical stale-listing flexibility.
Risks & watch-outs
- Watch-outs: built in 1958 — expect roof / HVAC / electrical / plumbing capex.
- Climate carrying-cost: severe wind risk, 80% chance of damaging wind over 30y; extreme-heat days projected 7→20/yr by 2055 (HVAC capex compounding) — expect insurance premiums to compound above CPI over the hold.
Questions for the listing agent
- Built in 1958 — when were the roof, HVAC, electrical panel, plumbing, and water heater last replaced?
- Is there a deadline driving the sale (1031 exchange, divorce, estate, relocation)? That informs how much negotiation room exists.
- Schools are F-rated, which usually means shorter tenancies and higher turnover. Who's the typical renter profile here, and what's been the actual vacancy rate?
- What's the average days-on-market for RENTAL listings here right now (not sales)? A rising rental-DOM trend means longer vacancies and softer asking-rent achievability than the comps imply.
- What's the recent tenant-quality profile in this submarket — average credit score on applications, eviction rate, late-payment / NSF rate, and stable-employment percentage? A property-management company in the area should have these aggregated.
- How much new for-sale + rental construction is in the pipeline within 1–3 miles? Heavy new supply typically softens prices + rents 12–24 months out; constrained supply supports both.
Investment metrics
- 1% rule
- 1.51% ✓
- Cap rate
- 12.64%
- Cash-on-cash
- 22.68%
- DSCR
- 2.01
- GRM
- 5.5
CMA / ARV
- ARV (on-the-fly)
- $134,392
- Comps found
- 12
Show comp detail 12 sales within ~0.75 mi
| Address | Dist | Beds/Ba | Sqft | Sold | Price | $/sf | Match |
|---|---|---|---|---|---|---|---|
| 203 Southbrook Dr | 0.16mi | 3/2.0 | 1,368 (+9%) | 15mo | $92,900 | $68 | 65 |
| 5821 Old Canton Rd | 0.19mi | 3/2.0 | 1,334 (+6%) | 22mo | $90,000 | $67 | 63 |
| 132 Glenside Dr | 0.38mi | 3/1.0 | 1,235 (-2%) | 16mo | $154,500 | $125 | 62 |
| 258 Sun Dr | 0.35mi | 3/1.5 | 1,180 (-6%) | 19mo | $139,900 | $119 | 56 |
| 5885 E Sedgwick Ct | 0.48mi | 3/2.0 | 1,323 (+5%) | 17mo | $149,800 | $113 | 54 |
| 1510 Springridge Dr | 0.64mi | 3/2.0 | 1,347 (+7%) | 5mo | $106,000 | $79 | 54 |
| 5157 Parkway Dr | 0.30mi | 3/2.0 | 1,387 (+10%) | 18mo | $149,900 | $108 | 53 |
| 5838 Canton Park Dr | 0.24mi | 3/2.0 | 1,395 (+11%) | 22mo | $149,500 | $107 | 52 |
| 214 Colonial Cir | 0.43mi | 3/2.0 | 1,375 (+10%) | 22mo | $120,000 | $87 | 46 |
| 316 Colonial Cir | 0.66mi | 3/1.0 | 1,407 (+12%) | 4mo | $165,000 | $117 | 41 |
| 5808 Deer Trl | 0.69mi | 3/2.0 | 1,373 (+9%) | 19mo | $122,900 | $90 | 36 |
| 323 Foxboro Dr | 0.68mi | 3/2.0 | 1,361 (+8%) | 22mo | $140,000 | $103 | 36 |
Match score weights: distance 35% · size 25% · config 20% · recency 20%. Top-matched comps best support the ARV.
Projected returns pro-forma
-3.0% appreciation · 7.9% rent growth · sell at horizon
- IRR
- 20.9%
- Equity multiple
- 1.90×
- Total profit
- $27,868
- Equity at exit
- $16,401
- IRR
- 32.1%
- Equity multiple
- 4.61×
- Total profit
- $111,146
- Equity at exit
- $9,511
Cash invested: $30,800 (down + closing). Projections, not guarantees.
Landlord ↔ Tenant lean methodology
- Overall (STATE)
- 90 Strongly Landlord-Friendly
- State Mississippi
- 90 Strongly Landlord-Friendly · R+11
- County
- — inherits STATE
- City
- — inherits STATE
ZIP-level market 39211
- Rents YoY
- 7.9%
- Active inventory
- 221
- Price-to-rent
- 5.5×
Monthly cashflow live
- Estimated rent
- $1,664 high interval (Pro) →
- Mortgage (P&I)
- −$577
- Tax from tax record
- −$110 /mo · $1,319/yr
- Insurance
- −$46
- HOA
- −$0
- Vacancy / Maint / Mgmt
- −$349
- Net cashflow
- $582
Break-even live
UW: 25.0% down · 7.5% · 30yr · 1.5% tax · 5.0% vac · 8.0% maint · 8.0% mgmt
Financing live
Cash to close
- Down payment
- $27,500
- Closing costs
- $3,300
- Reserves months
- —
- Total cash needed
- —
Loan-product check · same deal, 3 products live
Conventional
25% down · 7.5% · 30yr
- Down + closing
- —
- Monthly P&I
- —
- Monthly cashflow
- —
- DSCR
- —
- Eligible?
- —
Personal DTI + credit; lowest rate.
DSCR
20% down · 8.5% · 30yr
- Down + closing
- —
- Monthly P&I
- —
- Monthly cashflow
- —
- DSCR
- —
- Eligible?
- —
No personal income docs; deal must DSCR.
Hard money
10% down · 12.0% · 12mo
- Down + closing
- —
- Monthly P&I
- —
- Monthly cashflow
- —
- DSCR
- —
- Eligible?
- —
Short-term bridge; refi at stabilization.
Rent comps 30 comps
| Address | Beds | Baths | Sqft | Rent | $/sqft | DOM | Units | Dist |
|---|---|---|---|---|---|---|---|---|
| 119 S Canton Club Cir Jackson, MS | 3.0 | 2.0 | 1444 | $1,595 | $1.10 | 23d | 1 | 0.12mi |
| 120 Parkway Dr Jackson, MS | 1.0–3.0 | 1.0–2.0 | 1076 | $2,255 | $2.10 | 13d | 15 | 0.21mi |
| 214 Foxboro Dr Jackson, MS | 3.0 | 2.0 | 1224 | $1,395 | $1.14 | 13d | 1 | 0.83mi |
| 51 Northtown Dr Unit 003D Jackson, MS | 2.0 | 2.0 | 1025 | $1,199 | $1.17 | 43d | 1 | 0.97mi |
| 51 Northtown Dr Unit 001G Jackson, MS | 3.0 | 2.0 | 1260 | $1,449 | $1.15 | 13d | 1 | 0.97mi |
| 50 Northtown Dr Jackson, MS | 1.0–2.0 | 1.0–2.0 | 871 | $1,200 | $1.38 | 13d | 15 | 0.98mi |
| 51 Northtown Dr Unit 009F Jackson, MS | 2.0 | 2.0 | 1025 | $1,319 | $1.29 | 43d | 1 | 1.12mi |
| 51 Northtown Dr Unit 027B Jackson, MS | 2.0 | 2.0 | 1096 | $1,439 | $1.31 | 13d | 1 | 1.12mi |
| 51 Northtown Dr Unit 021A Jackson, MS | 3.0 | 2.0 | 1500 | $1,694 | $1.13 | 21d | 1 | 1.12mi |
| 51 Northtown Dr Unit 002G Jackson, MS | 3.0 | 2.0 | 1260 | $1,644 | $1.30 | 43d | 1 | 1.12mi |
| 51 Northtown Dr Apt 13L Jackson, MS | 2.0 | 2.0 | 1096 | $1,364 | $1.24 | 43d | 1 | 1.12mi |
| 51 Northtown Dr Unit 008E Jackson, MS | 2.0 | 2.0 | 1025 | $1,354 | $1.32 | 43d | 1 | 1.12mi |
| 51 Northtown Dr Unit 001F Jackson, MS | 3.0 | 2.0 | 1260 | $1,644 | $1.30 | 13d | 1 | 1.12mi |
| 51 Northtown Dr Unit 006H Jackson, MS | 2.0 | 2.0 | 1025 | $1,289 | $1.26 | 23d | 1 | 1.12mi |
| 51 Northtown Dr Apt 10E Jackson, MS | 2.0 | 2.0 | 1096 | $1,199 | $1.09 | 13d | 1 | 1.12mi |
| 51 Northtown Dr Unit 009H Jackson, MS | 2.0 | 2.0 | 1025 | $1,179 | $1.15 | 13d | 1 | 1.12mi |
| 51 Northtown Dr Unit 014G Jackson, MS | 2.0 | 2.0 | 1096 | $1,249 | $1.14 | 13d | 1 | 1.12mi |
| 51 Northtown Dr Unit 027G Jackson, MS | 2.0 | 2.0 | 1096 | $1,279 | $1.17 | 13d | 1 | 1.12mi |
| 51 Northtown Dr Unit 009D Jackson, MS | 2.0 | 2.0 | 1025 | $1,179 | $1.15 | 23d | 1 | 1.12mi |
| 51 Northtown Dr Unit 001B Jackson, MS | 3.0 | 2.0 | 1260 | $1,499 | $1.19 | 13d | 1 | 1.12mi |
| 9B River Oaks Pl Jackson, MS | 2.0 | 2.0 | 1012 | $1,395 | $1.38 | 23d | 1 | 1.20mi |
| 5000 Ridgewood Rd Jackson, MS | 2.0 | 2.0 | 1093 | $1,279 | $1.17 | 44d | 1 | 1.27mi |
| 5301 Ridgewood Rd Jackson, MS | 3.0 | 2.0 | 1482 | $1,850 | $1.25 | 43d | 1 | 1.28mi |
| 35 Meadowoods Ter Jackson, MS | 3.0 | 2.0 | 1269 | $1,450 | $1.14 | 23d | 1 | 1.31mi |
| 5538 Pine Lane Dr Jackson, MS | 3.0 | 2.0 | 1627 | $1,465 | $0.90 | 43d | 1 | 1.33mi |
| 2501 River Oaks Blvd Jackson, MS | 1.0–2.0 | 1.0–2.0 | 980 | $1,600 | $1.63 | 13d | 6 | 1.39mi |
| 212 Pimlico Pl Jackson, MS | 3.0 | 2.0 | 1600 | $900 | $0.56 | 13d | 1 | 1.39mi |
| 5544 Wayneland Dr Jackson, MS | 3.0 | 2.0 | 1800 | $1,831 | $1.02 | 43d | 1 | 1.39mi |
| 601 Northpointe Pkwy Jackson, MS | 1.0–2.0 | 1.0–2.0 | 910 | $1,054 | $1.16 | 13d | 2 | 1.40mi |
| 1523 E County Line Rd Jackson, MS | 2.0 | 2.0 | 989 | $1,235 | $1.25 | 43d | 1 | 1.44mi |
Listing history 10 events
-
2026-06-07statusdays on market $110,000 Pending 18 DOM
-
2026-06-05days on market $110,000 Active 17 DOM
-
2026-06-03days on market $110,000 Active 16 DOM
-
2026-06-02days on market $110,000 Active 15 DOM
-
2026-06-01days on market $110,000 Active 14 DOM
-
2026-05-31days on market $110,000 Active 13 DOM
-
2026-05-30days on market $110,000 Active 12 DOM
-
2026-05-18$110,000 Active
-
1998-03-31soldstatus
-
1988-07-15soldstatus
ⓘ Source: listings_history table (triggers on properties + properties_extension) + one-shot
backfill from property_details.listing_events for pre-trigger history.
Tax reassessment forecast MS · Resets to sale price
- Current annual tax
- $1,319 · $110/mo
- Projected year-2 tax
- $1,319 · $110/mo
- Expected delta
- $0/yr ($0/mo · 0.0%)
ⓘ Screening estimate from a state-policy table — verify with the county assessor before closing.
Climate risk First Street
- Flood 1/10 Low FEMA zone X (shaded) · 0% chance over 30 yrs
- Wildfire 1/10 Low
- Heat 7/10 Severe 7 d/yr ≥108°F today · 20 d/yr by 30 yrs out
- Wind 8/10 Severe 80% chance of damaging wind over 30 yrs
- Air quality 2/10 Low 0 unhealthy d/yr today · 1 by 30 yrs out
Nearby sold comps map
Loading sold comps map…
Walkable amenities ~0.75 mi
Loading nearby amenities…
Taxation est. · year 1
- Rental income
- $19,970
- − Mortgage interest
- −$6,162
- − Property taxes
- −$1,319
- − Insurance
- −$550
- − Repairs & maintenance
- −$1,598
- − Management
- −$1,598
- − Depreciation
- −$3,200
- Taxable income
- $5,544
- Est. tax owed @ 24.0%
- −$1,331
- After-tax cash flow
- $5,655/yr
For passive investors: Depreciation is non-cash, so a rental often shows a tax loss while cash-flowing — sheltering income. Rental losses are passive: they offset passive income freely, and up to $25,000/yr can offset ordinary (W-2) income if you actively participate and your MAGI is under $100k (phasing out to $0 by $150k); unused losses carry forward. On sale, claimed depreciation is recaptured at up to 25%, and gains may owe capital-gains tax (a 1031 exchange can defer both). Figures are a year-1 estimate at your 24.0% rate — not tax advice; consult a CPA.
Schools (NCES district)
- District
- Jackson Public School District
- NCES district ID
- 2802190
- Math proficiency
- 9% ▼ -14.00%
- Reading proficiency
- 18% ▼ -7.00%
- Median HH income
- $33,234
- Composite
- 10.89/100
- National rank
- #9755
- State rank
- #112 of 130 in MS
Livability — Jackson
- Score
- 68/100
- State rank
- #66
- US rank
- #9695
Category grades
Schools grade is shown separately in the Schools card above.
Census & demographics
- Census place
- Jackson, MS
- County
- Hinds County · 167,040 people
- City population
- 140,204
- Metro
- Jackson, MS
- Population (ZIP)
- 23,838
- Household income
- $69,426
- Rent vs Own
- Severe rent burden
- 736.0
Population outlook (Hinds County) Hauer SSP2
- Today (2025)
- 242,528 people
- By 2030
- 241,113 · -0.6%
- By 2040
- 235,557 · -2.9%
- By 2050
- 226,946 · -6.4%
- By 2075
- 199,995 · -17.5%
- By 2100
- 164,165 · -32.3%
Race, ethnicity, and origin ACS 2023
- Neighborhood character
- Majority Black (59%)
- Race & ethnicity
- Black 59% White 36% Hispanic / Latino 3% Two or more races 2%
- Common ancestry
- Serbian 2% Italian 2% Slovak 1%
- Foreign-born
- 2% · Canada, China
- Languages at home
- 96% English-only · Spanish 3% Chinese 1%
Political lean MEDSL · Hinds
- 2024 margin
- Solid D (+46.1) · D 72.4% · R 26.3% · Other 1.4%
- 2008→2024 swing
- +7.1pp toward D · 2008: 39.0pp · 2024: 46.1pp
- All cycles
- 2024: D+46.1 2020: D+48.3 2016: D+43.7 2012: D+45.1 2008: D+39.0
Not yet ingested
- Civics
- —
Market trends
- HPI YoY
- ▼ -135.99%
- Current HPI
- 145.5192
- Rent YoY
- ▲ 7.90%
- Metro
- Jackson, MS
- State GDP YoY
- —
- F500 in state
- 0
Price history
3 events — show timeline
- 2026-05-18 Listed $110,000 MLSU
- 1998-03-31 Sold (Public Records) — Public Records
- 1988-07-15 Sold (Public Records) — Public Records
Property tax history
-1.5%/yrLatest (2025): $1,319 · +2.1% YoY. Source: county tax records.
Cash-flow waterfall
monthlySold comps — $/sqft
last 12 mo · ≤1 miLoading sold comps…