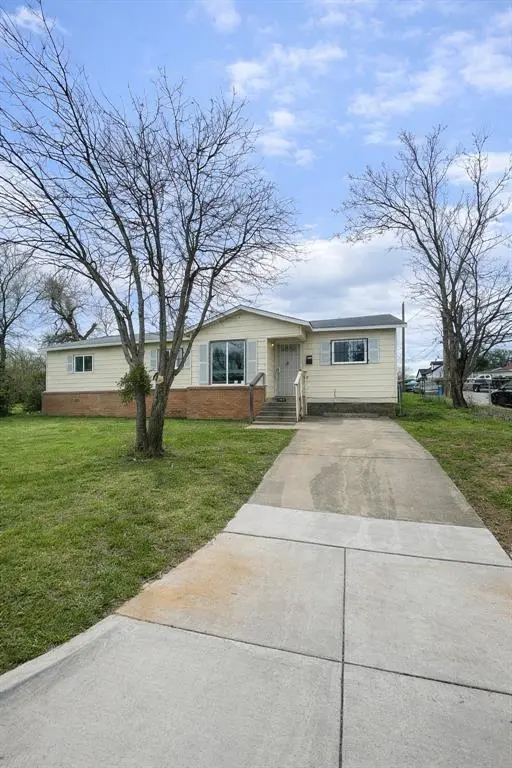
1413 Lindsey St · Fort Worth, TX
Flood risk 1/10 · Minimal
- FEMA flood zone
- X (unshaded)
- Chance of flooding over 30 yrs
- 0.0%
- Est. flood insurance / yr
- $507 – $1,088
Fire risk 1/10 · Minimal
- Est. fire insurance / yr
- $1,222 – $2,270
Heat risk 7/10 · Major
- Hot days now (above 110°F)
- 7 days/yr
- Hot days in 30 yrs
- 22 days/yr
Wind risk 5/10 · Moderate
- Chance of severe wind over 30 yrs
- 26.0%
Air-quality risk 3/10 · Minor
- Unhealthy air days now
- 3 days/yr
- Unhealthy air days in 30 yrs
- 4 days/yr
Risk factors via First Street. Map © Google.
Why this score? — see what drove the A- grade
The composite is a weighted blend of 9 inputs, each scored 0–100. Each bar is that input's sub-score; the figure is the points it added to the 100-point composite (weight × sub-score).
- Cash flow +30.0/30.0
- ARV discount +15.0/15.0
- DSCR +10.0/10.0
- Appreciation +10.0/10.0
- 1% rule +8.6/10.0
- Livability +4.0/5.0
- Rent growth +2.5/5.0
- Condition / age +2.5/5.0
- Schools +2.0/10.0
$175,000
🖨 Deal sheet (PDF) 📄 Offer letter ✓ Due diligence
Listing remarks MLS
This property presents an exceptional opportunity for families or investors alike. Located within the Fort Worth Independent School District, nearby schools include Maude I. Logan Elementary School, Phalen Leadership Academy at James Martin Jacquet (Middle School), and Dunbar High School — offering convenient access to education for children of all ages. The home is also well-positioned near Fort Worth’s network of parks and recreational spaces managed by the City’s Park & Recreation Department, local library branches such as the East Berry Library, and community facilities like nearby community centers that support resident activities and events. This property offers strong investment potential thanks to its sizable footprint, proximity to key local amenities, and the rental demand in the central Fort Worth area. Whether you’re seeking a long-term family residence or a high-yield rental asset, 1413 Lindsay Street stands out as a smart buy in a neighborhood with growth prospects.
Key facts
- Dunbar high school
- Community centers
- Network of parks
Tags
Neighborhood map
What this means for you Summary
Snapshot
- This is a 5-bed/2.0-bath single-family listed at $175k.
Deal economics
- At list price, monthly cash flow is $693 ($8k/yr) — positive.
- The deal already cash-flows at list — no discount required.
- Meets the 1% rule at list price ($2k rent vs $175k).
- Recommended offer: $159k (9.0% below list) — sets the bar for market timing.
- Cap rate 11.0% vs local median 3.9% in Fort Worth — top-decile yield for the area; either an underpriced asset or a hidden risk that comps aren't pricing in. Stress-test before assuming the spread holds.
Location & tenants
- Location reads 80/100 on livability (#49 in TX, #1,954 nationally) — a professional / high-income tenant draw. Strengths: amenities A+, cost of living A+, housing A+; Watch: schools D+, crime F.
- Fort Worth ISD (urban): math 18% / reading 28% proficiency, ranked #742 of 826 in TX (top 90%) — low school quality limits family demand, transient renter base, plan for 1-2y turnover; 73% free/reduced lunch — lower-income household profile, screen leases tightly.
- Market conditions: 101 active listings in the ZIP; 3 comparable units currently listed for rent nearby; rentals at typical pace (median 24d on market — plan ~3-4 weeks tenant-placement turnaround); 18,938 units permitted in Tarrant County in 2024 (8,336 in 5+ unit buildings).
- At $2,382/mo this rent would consume 62% of the median local household income ($46k/yr) (locally 884% of renters already pay >50% of income on rent) — very limited rent-growth headroom before tenants either downsize or default.
Forward outlook
- In year one you build about $19k of equity ($1k loan paydown + $18k appreciation (10.0% local appreciation)).
- Tarrant County population projected at +41% by 2050 — long-run rental-demand tailwind backs the buy-and-hold thesis.
- At projected returns (10.0% appreciation + 3.0% rent growth), your $49k cash investment doubles in ~2 years — after that, you're playing with house money.
- By year 2, paydown + projected appreciation supports a ~$30k cash-out refi (75% LTV) — recoverable capital for the next deal without selling this one.
Negotiation context
- It's been on market 101 days — a 9% lower offer ($159k) is reasonable based on typical stale-listing flexibility.
- 4 sale attempts since 20y ago; this cycle's ask has dropped $35k (17%) from the opening price — seller is motivated, your offer sets the floor, not the list.
Risks & watch-outs
- Watch-outs: built in 1958 — expect roof / HVAC / electrical / plumbing capex.
- Climate carrying-cost: moderate wind risk, 26% chance of damaging wind over 30y; extreme-heat days projected 7→22/yr by 2055 (HVAC capex compounding) — expect insurance premiums to compound above CPI over the hold.
Questions for the listing agent
- It's been on market 101 days. Have you received any prior offers? Is the seller open to a 9% concession, seller financing, or rate buy-down credit?
- Built in 1958 — when were the roof, HVAC, electrical panel, plumbing, and water heater last replaced?
- Why hasn't it sold? Are there any deal-killer items the seller is aware of (foundation, flood, title, zoning, code violations)?
- Is there a deadline driving the sale (1031 exchange, divorce, estate, relocation)? That informs how much negotiation room exists.
- Schools are D-rated, which usually means shorter tenancies and higher turnover. Who's the typical renter profile here, and what's been the actual vacancy rate?
- Crime grade is F in this area — have there been break-ins, vandalism, or insurance claims at this property in the last 3 years? What carrier currently insures it and at what premium?
- What's the average days-on-market for RENTAL listings here right now (not sales)? A rising rental-DOM trend means longer vacancies and softer asking-rent achievability than the comps imply.
- What's the recent tenant-quality profile in this submarket — average credit score on applications, eviction rate, late-payment / NSF rate, and stable-employment percentage? A property-management company in the area should have these aggregated.
- How much new for-sale + rental construction is in the pipeline within 1–3 miles? Heavy new supply typically softens prices + rents 12–24 months out; constrained supply supports both.
Investment metrics
- 1% rule
- 1.36% ✓
- Cap rate
- 11.04%
- Cash-on-cash
- 16.96%
- DSCR
- 1.75
- GRM
- 6.1
CMA / ARV
- ARV (median comp)
- $305,130
- List price
- $175,000
- Delta
- -42.65%
- Verdict
- UNDERPRICED
- Comps
- 20 within 1.0 mi
Show comp detail 9 sales within ~0.75 mi
| Address | Dist | Beds/Ba | Sqft | Sold | Price | $/sf | Match |
|---|---|---|---|---|---|---|---|
| 1724 S Hughes Ave | 0.36mi | 4/3.5 (-1) | 2,243 (-1%) | 11mo | $375,000 | $167 | 60 |
| 2005 Edmonia Ct | 0.41mi | 4/2.0 (-1) | 2,108 (-7%) | 16mo | $335,000 | $159 | 50 |
| 4308 Avenue J | 0.44mi | 4/3.5 (-1) | 2,186 (-4%) | 18mo | $359,990 | $165 | 47 |
| 1822 Langston St | 0.33mi | 4/2.5 (-1) | 1,984 (-13%) | 18mo | $345,000 | $174 | 41 |
| 1909 Dillard St | 0.67mi | 4/2.5 (-1) | 2,036 (-10%) | 8mo | $352,900 | $173 | 38 |
| 4604 Avenue M | 0.42mi | 4/2.5 (-1) | 1,976 (-13%) | 17mo | $326,500 | $165 | 37 |
| 5300 S Hampshire Blvd | 0.72mi | 4/3.0 (-1) | 2,100 (-8%) | 12mo | $330,000 | $157 | 35 |
| 4755 Ramey Ave | 0.60mi | 4/2.0 (-1) | 1,935 (-15%) | 10mo | $339,455 | $175 | 34 |
| 5223 Willie St | 0.70mi | 4/3.5 (-1) | 2,050 (-10%) | 10mo | $389,000 | $190 | 31 |
Match score weights: distance 35% · size 25% · config 20% · recency 20%. Top-matched comps best support the ARV.
Projected returns pro-forma
10.0% appreciation · 3.0% rent growth · sell at horizon
- IRR
- 36.9%
- Equity multiple
- 3.85×
- Total profit
- $139,442
- Equity at exit
- $157,654
- IRR
- 31.7%
- Equity multiple
- 8.67×
- Total profit
- $375,994
- Equity at exit
- $339,987
Cash invested: $49,000 (down + closing). Projections, not guarantees.
Landlord ↔ Tenant lean methodology
- Overall (STATE)
- 87 Strongly Landlord-Friendly
- State Texas
- 87 Strongly Landlord-Friendly · R+5
- County
- — inherits STATE
- City
- — inherits STATE
ZIP-level market 76105
- Home prices YoY
- 14.2%
- Active inventory
- 101
- Price-to-rent
- 6.1×
Monthly cashflow live
- Estimated rent
- $2,382 medium interval (Pro) →
- Mortgage (P&I)
- −$918
- Tax from tax record
- −$199 /mo · $2,384/yr
- Insurance
- −$73
- HOA
- −$0
- Vacancy / Maint / Mgmt
- −$500
- Net cashflow
- $693
Break-even live
Sensitivity live
| Price | -10% $792 | -5% $742 | +0% $693 | +5% $643 | +10% $593 |
|---|---|---|---|---|---|
| Rent | -10% $504 | -5% $598 | +0% $693 | +5% $787 | +10% $881 |
| Rate | -1.0pp $781 | -0.5pp $737 | base $693 | +0.5pp $647 | +1.0pp $601 |
UW: 25.0% down · 7.5% · 30yr · 1.5% tax · 5.0% vac · 8.0% maint · 8.0% mgmt
Financing live
Cash to close
- Down payment
- $43,750
- Closing costs
- $5,250
- Reserves months
- —
- Total cash needed
- —
Loan-product check · same deal, 3 products live
Conventional
25% down · 7.5% · 30yr
- Down + closing
- —
- Monthly P&I
- —
- Monthly cashflow
- —
- DSCR
- —
- Eligible?
- —
Personal DTI + credit; lowest rate.
DSCR
20% down · 8.5% · 30yr
- Down + closing
- —
- Monthly P&I
- —
- Monthly cashflow
- —
- DSCR
- —
- Eligible?
- —
No personal income docs; deal must DSCR.
Hard money
10% down · 12.0% · 12mo
- Down + closing
- —
- Monthly P&I
- —
- Monthly cashflow
- —
- DSCR
- —
- Eligible?
- —
Short-term bridge; refi at stabilization.
Rent comps 3 comps
| Address | Beds | Baths | Sqft | Rent | $/sqft | DOM | Units | Dist |
|---|---|---|---|---|---|---|---|---|
| 4761 Meadowbrook Dr Fort Worth, TX | 5.0 | 3.5 | 2373 | $2,650 | $1.12 | 25d | 1 | 1.11mi |
| 2332 Grandview Dr Fort Worth, TX | 4.0 | 2.0 | 1994 | $2,000 | $1.00 | 23d | 1 | 1.35mi |
| 2312 Cass St Fort Worth, TX | 4.0 | 2.5 | 1600 | $1,850 | $1.16 | 15d | 1 | 1.36mi |
Listing history 28 events
-
2026-06-21days on market $175,000 Active 101 DOM
-
2026-06-18days on market $175,000 Active 98 DOM
-
2026-06-17days on market $175,000 Active 97 DOM
-
2026-06-16days on market $175,000 Active 96 DOM
-
2026-06-15days on market $175,000 Active 95 DOM
-
2026-06-13days on market $175,000 Active 93 DOM
-
2026-06-09days on market $175,000 Active 89 DOM
-
2026-06-08days on market $175,000 Active 88 DOM
-
2026-06-07days on market $175,000 Active 87 DOM
-
2026-06-04days on market $175,000 Active 84 DOM
-
2026-06-03days on market $175,000 Active 83 DOM
-
2026-06-02days on market $175,000 Active 82 DOM
-
2026-06-02days on market $175,000 Active 81 DOM
-
2026-05-31days on market $175,000 Active 80 DOM
-
2026-05-13price $175,000 1024-char remark
Show marketing remark (1024 chars)
This property presents an exceptional opportunity for families or investors alike. Located within the Fort Worth Independent School District, nearby schools include Maude I. Logan Elementary School, Phalen Leadership Academy at James Martin Jacquet (Middle School), and Dunbar High School — offering convenient access to education for children of all ages. The home is also well-positioned near Fort Worth’s network of parks and recreational spaces managed by the City’s Park & Recreation Department, local library branches such as the East Berry Library, and community facilities like nearby community centers that support resident activities and events. This property offers strong investment potential thanks to its sizable footprint, proximity to key local amenities, and the rental demand in the central Fort Worth area. Whether you’re seeking a long-term family residence or a high-yield rental asset, 1413 Lindsay Street stands out as a smart buy in a neighborhood with growth prospects.
-
2026-04-02price $199,000 1024-char remark
Show marketing remark (1024 chars)
This property presents an exceptional opportunity for families or investors alike. Located within the Fort Worth Independent School District, nearby schools include Maude I. Logan Elementary School, Phalen Leadership Academy at James Martin Jacquet (Middle School), and Dunbar High School — offering convenient access to education for children of all ages. The home is also well-positioned near Fort Worth’s network of parks and recreational spaces managed by the City’s Park & Recreation Department, local library branches such as the East Berry Library, and community facilities like nearby community centers that support resident activities and events. This property offers strong investment potential thanks to its sizable footprint, proximity to key local amenities, and the rental demand in the central Fort Worth area. Whether you’re seeking a long-term family residence or a high-yield rental asset, 1413 Lindsay Street stands out as a smart buy in a neighborhood with growth prospects.
-
2026-03-12$210,000 Active 1024-char remark
Show marketing remark (1024 chars)
This property presents an exceptional opportunity for families or investors alike. Located within the Fort Worth Independent School District, nearby schools include Maude I. Logan Elementary School, Phalen Leadership Academy at James Martin Jacquet (Middle School), and Dunbar High School — offering convenient access to education for children of all ages. The home is also well-positioned near Fort Worth’s network of parks and recreational spaces managed by the City’s Park & Recreation Department, local library branches such as the East Berry Library, and community facilities like nearby community centers that support resident activities and events. This property offers strong investment potential thanks to its sizable footprint, proximity to key local amenities, and the rental demand in the central Fort Worth area. Whether you’re seeking a long-term family residence or a high-yield rental asset, 1413 Lindsay Street stands out as a smart buy in a neighborhood with growth prospects.
-
2014-02-28soldstatus Closed 253-char remark
Show marketing remark (253 chars)
FORECLOSURE--- CHECK THIS PRICE!!!! 5 BEDROOM 2 AND 1 HALF BATH AND HOME BUILT IN 1958!!! THIS COULD BE THE FORECLOSURE YOU ARE LOOKING FOR!!! BUYER OR BUYER S AGENT TO VERIFY ALL INFORMATION: SCHOOLS, TAXES, RESTRICTIONS AND ROOM SIZES, ETC. SOLD AS IS
-
2014-01-31status Pending 253-char remark
Show marketing remark (253 chars)
FORECLOSURE--- CHECK THIS PRICE!!!! 5 BEDROOM 2 AND 1 HALF BATH AND HOME BUILT IN 1958!!! THIS COULD BE THE FORECLOSURE YOU ARE LOOKING FOR!!! BUYER OR BUYER S AGENT TO VERIFY ALL INFORMATION: SCHOOLS, TAXES, RESTRICTIONS AND ROOM SIZES, ETC. SOLD AS IS
-
2014-01-28price $27,900 253-char remark
Show marketing remark (253 chars)
FORECLOSURE--- CHECK THIS PRICE!!!! 5 BEDROOM 2 AND 1 HALF BATH AND HOME BUILT IN 1958!!! THIS COULD BE THE FORECLOSURE YOU ARE LOOKING FOR!!! BUYER OR BUYER S AGENT TO VERIFY ALL INFORMATION: SCHOOLS, TAXES, RESTRICTIONS AND ROOM SIZES, ETC. SOLD AS IS
-
2013-12-20$30,000 Active 253-char remark
Show marketing remark (253 chars)
FORECLOSURE--- CHECK THIS PRICE!!!! 5 BEDROOM 2 AND 1 HALF BATH AND HOME BUILT IN 1958!!! THIS COULD BE THE FORECLOSURE YOU ARE LOOKING FOR!!! BUYER OR BUYER S AGENT TO VERIFY ALL INFORMATION: SCHOOLS, TAXES, RESTRICTIONS AND ROOM SIZES, ETC. SOLD AS IS
-
2013-12-03historical
-
2013-10-29price $27,500
-
2013-09-28$30,300 Active
-
2006-09-21soldstatus
-
2006-09-18soldstatus
-
2006-09-07historical
-
2006-08-24$24,900
ⓘ Source: listings_history table (triggers on properties + properties_extension) + one-shot
backfill from property_details.listing_events for pre-trigger history.
Tax reassessment forecast TX · Resets to sale price
- Current annual tax
- $2,384 · $199/mo
- Projected year-2 tax
- $3,202 · $267/mo
- Expected delta
- +$819/yr (+$68/mo · 34.3%)
ⓘ Screening estimate from a state-policy table — verify with the county assessor before closing.
Climate risk First Street
- Flood 1/10 Low FEMA zone X (unshaded) · 0% chance over 30 yrs
- Wildfire 1/10 Low
- Heat 7/10 Severe 7 d/yr ≥110°F today · 22 d/yr by 30 yrs out
- Wind 5/10 Major 26% chance of damaging wind over 30 yrs
- Air quality 3/10 Moderate 3 unhealthy d/yr today · 4 by 30 yrs out
Nearby sold comps map
Loading sold comps map…
Walkable amenities ~0.75 mi
Loading nearby amenities…
Taxation est. · year 1
- Rental income
- $28,585
- − Mortgage interest
- −$9,803
- − Property taxes
- −$2,384
- − Insurance
- −$875
- − Repairs & maintenance
- −$2,287
- − Management
- −$2,287
- − Depreciation
- −$5,091
- Taxable income
- $5,859
- Est. tax owed @ 24.0%
- −$1,406
- After-tax cash flow
- $6,905/yr
For passive investors: Depreciation is non-cash, so a rental often shows a tax loss while cash-flowing — sheltering income. Rental losses are passive: they offset passive income freely, and up to $25,000/yr can offset ordinary (W-2) income if you actively participate and your MAGI is under $100k (phasing out to $0 by $150k); unused losses carry forward. On sale, claimed depreciation is recaptured at up to 25%, and gains may owe capital-gains tax (a 1031 exchange can defer both). Figures are a year-1 estimate at your 24.0% rate — not tax advice; consult a CPA.
Schools (NCES district)
- District
- Fort Worth ISD
- NCES district ID
- 4819700
- Math proficiency
- 18% ▼ -16.00%
- Reading proficiency
- 28% ▼ -6.00%
- Median HH income
- $42,109
- Composite
- 19.61/100
- National rank
- #8753
- State rank
- #742 of 826 in TX
Livability — Fort Worth
- Score
- 80/100
- State rank
- #49
- US rank
- #1954
Category grades
Schools grade is shown separately in the Schools card above.
Census & demographics
- Census place
- Fort Worth, TX
- County
- Tarrant County · 2,033,669 people
- City population
- 911,619
- Metro
- Dallas-Fort Worth-Arlington, TX
- Population (ZIP)
- 22,228
- Household income
- $45,770
- Rent vs Own
- Severe rent burden
- 884.0
Population outlook (Tarrant County) Hauer SSP2
- Today (2025)
- 2,380,417 people
- By 2030
- 2,578,900 · +8.3%
- By 2040
- 2,974,995 · +25.0%
- By 2050
- 3,350,489 · +40.8%
- By 2075
- 4,216,909 · +77.2%
- By 2100
- 4,741,527 · +99.2%
Race, ethnicity, and origin ACS 2023
- Neighborhood character
- Majority Hispanic (63%)
- Race & ethnicity
- Hispanic / Latino 63% Black 29% Two or more races 24% White 6%
- Hispanic origin (detail)
- Mexican 57%
- Foreign-born
- 28% · Canada
- Languages at home
- 44% English-only · Spanish 55% Other Indo-European 1%
Political lean MEDSL · Tarrant
- 2024 margin
- Lean R (+5.1) · D 46.7% · R 51.9% · Other 1.4%
- 2008→2024 swing
- +6.6pp toward D · 2008: -11.7pp · 2024: -5.1pp
- All cycles
- 2024: R+5.1 2020: D+0.2 2016: R+8.7 2012: R+15.7 2008: R+11.7
Not yet ingested
- Civics
- —
Market trends
- HPI YoY
- ▲ 27.33%
- Current HPI
- 219.2657
- Rent YoY
- —
- Metro
- Dallas-Fort Worth-Arlington, TX
- State GDP YoY
- ▲ 3.95%
- F500 in state
- 110
Industry mix (Fortune 500 HQ in TX)
| Industry | F500 HQs | Revenue |
|---|---|---|
| Energy | 16 | $1,198B |
|
||
| Technology | 5 | $198B |
|
||
| Engineering / Construction | 4 | $72B |
|
||
| Energy Services | 3 | $60B |
|
||
| Utilities | 3 | $41B |
|
||
| Healthcare | 2 | $330B |
|
||
Price history
+602.8% since first listed14 events — show timeline
- 2026-05-13 Price Changed $175,000 NTREIS
- 2026-04-02 Price Changed $199,000 NTREIS
- 2026-03-12 Listed $210,000 NTREIS
- 2014-02-28 Sold (MLS) — NTREIS
- 2014-01-31 Pending — NTREIS
- 2014-01-28 Price Changed $27,900 NTREIS
- 2013-12-20 Listed $30,000 NTREIS
- 2013-12-03 Listing Removed — NTREIS
- 2013-10-29 Price Changed $27,500 NTREIS
- 2013-09-28 Listed $30,300 NTREIS
- 2006-09-21 Sold (Public Records) — Public Records
- 2006-09-18 Sold (MLS) — NTREIS
- 2006-09-07 Listing Removed — NTREIS
- 2006-08-24 Listed $24,900 NTREIS
Property tax history
+2.3%/yrLatest (2025): $2,384 · -20.4% YoY. Source: county tax records.
Cash-flow waterfall
monthlySold comps — $/sqft
last 12 mo · ≤1 miLoading sold comps…