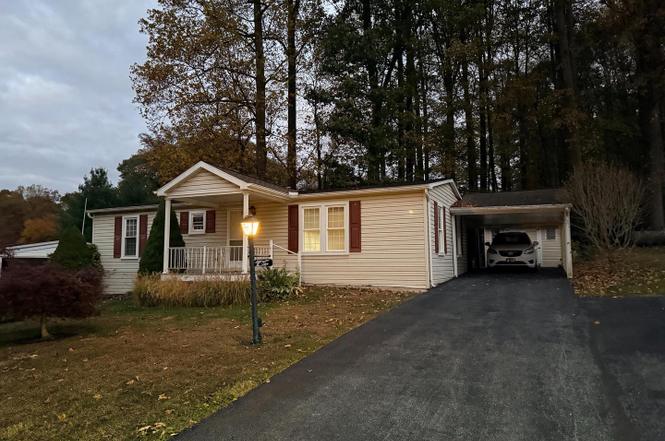
303 Maple Ave Tp-0211 · Cornwall, PA
Flood risk No data
- FEMA flood zone
- —
- Chance of flooding over 30 yrs
- —
- Est. flood insurance / yr
- —
Fire risk No data
- Est. fire insurance / yr
- —
Heat risk No data
- Hot days now (above threshold)
- —
- Hot days in 30 yrs
- —
Wind risk No data
- Chance of severe wind over 30 yrs
- —
Air-quality risk No data
- Unhealthy air days now
- —
- Unhealthy air days in 30 yrs
- —
Risk factors via First Street. Map © Google.
Why this score? — see what drove the D grade
The composite is a weighted blend of 9 inputs, each scored 0–100. Each bar is that input's sub-score; the figure is the points it added to the 100-point composite (weight × sub-score).
- Cash flow +15.3/30.0
- ARV discount +7.5/15.0
- DSCR +4.7/10.0
- Schools +4.1/10.0
- 1% rule +3.7/10.0
- Livability +3.5/5.0
- Rent growth +2.5/5.0
- Condition / age +2.5/5.0
- Appreciation +0.0/10.0
$185,500
🖨 Deal sheet 📄 Offer letter ✓ Due diligence
Listing remarks
Welcome to 303 Maple Avenue. You will enjoy this well maintained 2 Bedroom and Den (or 3 bedrooms depending on your needs) 2 Bath home offering thoughtfully designed living space in the highly sought after community of Gretna Springs! This beautiful 55+ community offers a stunning location, tucked away in the woods, but convenient to everything you need. The well thought out floorplan links the kitchen, dining area and the large living room creating the perfect setting for both daily living and entertaining family and friends. Watch your neighbors pass and wave from their golf carts or while walking on the private roads from your gorgeous front porch which has composite flooring, and a p
Key facts
- 4 parking spots
- Built 1990
- Listed 154 days
Neighborhood map
What this means for you Summary
Snapshot
- This is a 2-bed/1.5-bath manufactured listed at $186k.
Deal economics
- At list price, monthly cash flow is $68 ($817/yr) — positive.
- The deal already cash-flows at list — no discount required.
- To meet the 1% rule (rent ≥ 1% of price), the offer needs to be $162k (12.9% below list).
- Recommended offer: $162k (12.9% below list) — sets the bar for 1% rule.
- Cap rate 6.7% vs local median 0.9% in Cornwall — top-decile yield for the area; either an underpriced asset or a hidden risk that comps aren't pricing in. Stress-test before assuming the spread holds.
Location & tenants
- Location reads 70/100 on livability (#740 in PA) — a middle-class / working-renter tenant base. Strengths: crime A+, employment A+, housing A+; Watch: amenities F, commute F, health & safety F.
- Cornwall-Lebanon SD (suburban): math 37% / reading 56% proficiency, ranked #219 of 539 in PA (top 41%) — families likely to look elsewhere, expect single-tenant / working-renter base with shorter leases.
- Zoned schools: Cornwall El Sch (math 46% / reading 70%, grade C+, #430 of 1,518 statewide, top 29%, 534 students, 33% FRL); Cedar Crest Ms (math 24% / reading 59%, grade F, #234 of 512 statewide, top 47%, 1,302 students, 44% FRL); Cedar Crest Hs (math 77% / reading 34%, grade C, #93 of 437 statewide, top 22%, 1,633 students, 34% FRL).
- Market conditions: 79 active listings in the ZIP; solid renter incomes; 315 units permitted in Lebanon County in 2024 (36 in 5+ unit buildings).
Forward outlook
- Local home prices are declining (-3.0%/yr); year-one equity from $1k of loan paydown is wiped out by about $6k of value loss. Plan a longer hold.
- Lebanon County population projected at +10% by 2050 — modest demand growth; plan on rents tracking national, not racing it.
Negotiation context
- It's been on market 154 days — a 12% lower offer ($163k) is reasonable based on typical stale-listing flexibility.
Questions for the listing agent
- It's been on market 154 days. Have you received any prior offers? Is the seller open to a 13% concession, seller financing, or rate buy-down credit?
- Why hasn't it sold? Are there any deal-killer items the seller is aware of (foundation, flood, title, zoning, code violations)?
- Is there a deadline driving the sale (1031 exchange, divorce, estate, relocation)? That informs how much negotiation room exists.
- Schools are A-rated — typically a magnet for longer-tenancy family renters. What's the average tenant stay here, and is there a school-zone premium baked into asking?
- The area grade is low — what's the realistic commute time and amenity access for the typical tenant pool here? Any planned neighborhood developments (good or bad) we should know about?
- What's the average days-on-market for RENTAL listings here right now (not sales)? A rising rental-DOM trend means longer vacancies and softer asking-rent achievability than the comps imply.
- What's the recent tenant-quality profile in this submarket — average credit score on applications, eviction rate, late-payment / NSF rate, and stable-employment percentage? A property-management company in the area should have these aggregated.
- How much new for-sale + rental construction is in the pipeline within 1–3 miles? Heavy new supply typically softens prices + rents 12–24 months out; constrained supply supports both.
Investment metrics
- 1% rule
- 0.87% ✗
- Cap rate
- 6.73%
- Cash-on-cash
- 1.57%
- DSCR
- 1.07
- GRM
- 9.6
CMA / ARV
No comps found within radius.
Projected returns pro-forma
-3.0% appreciation · 3.0% rent growth · sell at horizon
- IRR
- -13.8%
- Equity multiple
- 0.50×
- Total profit
- $-25,746
- Equity at exit
- $27,659
- IRR
- -5.0%
- Equity multiple
- 0.67×
- Total profit
- $-16,923
- Equity at exit
- $16,039
Cash invested: $51,940 (down + closing). Projections, not guarantees.
Landlord ↔ Tenant lean methodology
- Overall (STATE)
- 62 Landlord-Friendly
- State Pennsylvania
- 62 Landlord-Friendly · EVEN
- County
- — inherits STATE
- City
- — inherits STATE
ZIP-level market 17545
- Home prices YoY
- -30.5%
- Active inventory
- 79
- Price-to-rent
- 9.6×
Monthly cashflow live
- Estimated rent
- $1,615 medium interval (Pro) →
- Mortgage (P&I)
- −$973
- Tax from tax record
- −$158 /mo · $1,897/yr
- Insurance
- −$77
- HOA
- −$0
- Vacancy / Maint / Mgmt
- −$339
- Net cashflow
- $68
Break-even live
UW: 25.0% down · 7.5% · 30yr · 1.5% tax · 5.0% vac · 8.0% maint · 8.0% mgmt
Financing live
Cash to close
- Down payment
- $46,375
- Closing costs
- $5,565
- Reserves months
- —
- Total cash needed
- —
Loan-product check · same deal, 3 products live
Conventional
25% down · 7.5% · 30yr
- Down + closing
- —
- Monthly P&I
- —
- Monthly cashflow
- —
- DSCR
- —
- Eligible?
- —
Personal DTI + credit; lowest rate.
DSCR
20% down · 8.5% · 30yr
- Down + closing
- —
- Monthly P&I
- —
- Monthly cashflow
- —
- DSCR
- —
- Eligible?
- —
No personal income docs; deal must DSCR.
Hard money
10% down · 12.0% · 12mo
- Down + closing
- —
- Monthly P&I
- —
- Monthly cashflow
- —
- DSCR
- —
- Eligible?
- —
Short-term bridge; refi at stabilization.
Listing history 4 events
-
2026-04-10status Pending
-
2026-03-25price $185,500
-
2025-11-08$187,500 Active
-
2025-10-30historical $187,500
ⓘ Source: listings_history table (triggers on properties + properties_extension) + one-shot
backfill from property_details.listing_events for pre-trigger history.
Tax reassessment forecast PA · Partial reset (capped growth)
- Current annual tax
- $1,897 · $158/mo
- Projected year-2 tax
- $2,414 · $201/mo
- Expected delta
- +$517/yr (+$43/mo · 27.3%)
ⓘ Screening estimate from a state-policy table — verify with the county assessor before closing.
Nearby sold comps map
Loading sold comps map…
Walkable amenities ~0.75 mi
Loading nearby amenities…
Taxation est. · year 1
- Rental income
- $19,385
- − Mortgage interest
- −$10,391
- − Property taxes
- −$1,897
- − Insurance
- −$928
- − Repairs & maintenance
- −$1,551
- − Management
- −$1,551
- − Depreciation
- −$5,396
- Taxable loss
- −$2,328
- Est. tax savings @ 24.0%
- +$559
- After-tax cash flow
- $1,375/yr
For passive investors: Depreciation is non-cash, so a rental often shows a tax loss while cash-flowing — sheltering income. Rental losses are passive: they offset passive income freely, and up to $25,000/yr can offset ordinary (W-2) income if you actively participate and your MAGI is under $100k (phasing out to $0 by $150k); unused losses carry forward. On sale, claimed depreciation is recaptured at up to 25%, and gains may owe capital-gains tax (a 1031 exchange can defer both). Figures are a year-1 estimate at your 24.0% rate — not tax advice; consult a CPA.
Schools (NCES district)
- District
- Cornwall-Lebanon SD
- NCES district ID
- 4206840
- Math proficiency
- 37% ▼ -15.00%
- Reading proficiency
- 56% ▼ -15.00%
- Median HH income
- $62,483
- Composite
- 41.0/100
- National rank
- #3589
- State rank
- #219 of 539 in PA
Livability — Cornwall
- Score
- 70/100
- State rank
- #740
- US rank
- #7415
Category grades
Schools grade is shown separately in the Schools card above.
Census & demographics
- County
- Lancaster County · 390,309 people
- City population
- 40,670
- Metro
- Lancaster, PA
- Population (ZIP)
- 23,556
- Household income
- $84,704
- Rent vs Own
- Severe rent burden
- 342.0
Population outlook (Lebanon County) Hauer SSP2
- Today (2025)
- 144,806 people
- By 2030
- 147,534 · +1.9%
- By 2040
- 152,952 · +5.6%
- By 2050
- 159,406 · +10.1%
- By 2075
- 181,736 · +25.5%
- By 2100
- 198,402 · +37.0%
Race, ethnicity, and origin ACS 2023
- Neighborhood character
- Predominantly White (93%)
- Race & ethnicity
- White 93% Two or more races 5% Hispanic / Latino 3%
- Common ancestry
- Romanian 4% Lithuanian 1% Slovak 1%
- Foreign-born
- 1% · Canada
- Languages at home
- 96% English-only · German/W. Germanic 3% Spanish 1%
Political lean MEDSL · Lebanon
- 2024 margin
- Solid R (+32.0) · D 33.6% · R 65.5%
- 2008→2024 swing
- -13.1pp toward R · 2008: -18.9pp · 2024: -32.0pp
- All cycles
- 2024: R+32.0 2020: R+31.7 2016: R+35.5 2012: R+28.0 2008: R+18.9
Not yet ingested
- Civics
- —
Market trends
- HPI YoY
- ▼ -115.46%
- Current HPI
- 263.1172
- Rent YoY
- —
- Metro
- Lancaster, PA
- State GDP YoY
- ▲ 1.68%
- F500 in state
- 34
Industry mix (Fortune 500 HQ in PA)
| Industry | F500 HQs | Revenue |
|---|---|---|
| Healthcare | 2 | $309B |
|
||
| Insurance | 2 | $27B |
|
||
| Telecommunications / Media | 1 | $124B |
|
||
| Industrial Distribution | 1 | $22B |
|
||
| Financial Services | 1 | $20B |
|
||
| Chemicals / Materials | 1 | $18B |
|
||
Price history
-1.1% since first listed4 events — show timeline
- 2026-04-10 Pending — BRIGHT MLS
- 2026-03-25 Price Changed $185,500 BRIGHT MLS
- 2025-11-08 Listed $187,500 BRIGHT MLS
- 2025-10-30 Coming Soon $187,500 BRIGHT MLS
Property tax history
+3.5%/yrLatest (2026): $1,897 · +4.3% YoY. Source: county tax records.
Cash-flow waterfall
monthlySold comps — $/sqft
last 12 mo · ≤1 miLoading sold comps…