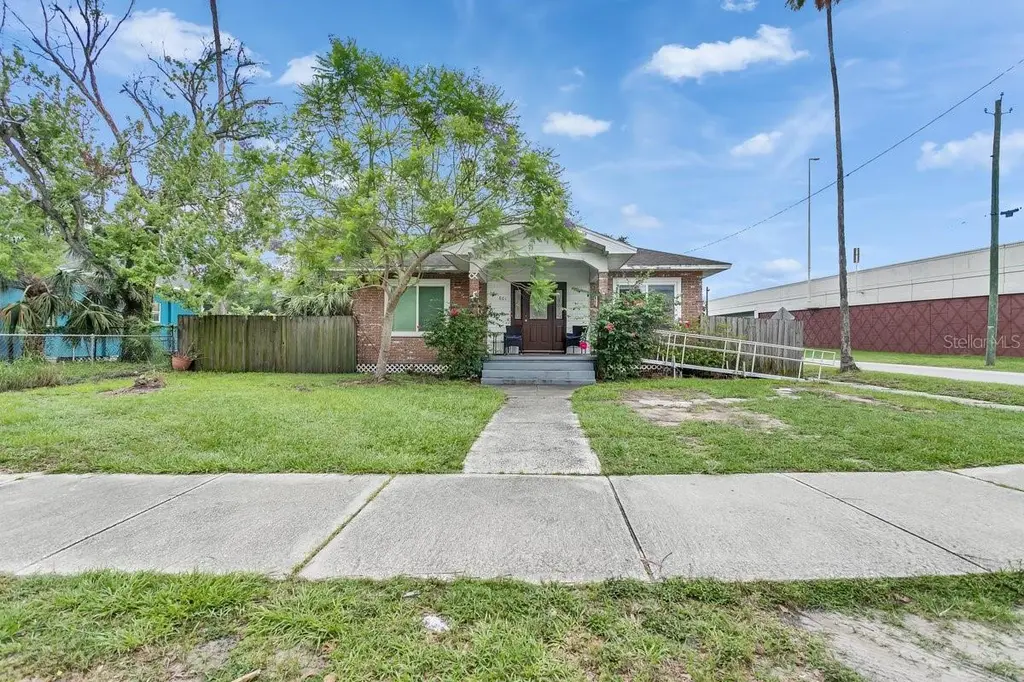
801 E Louisiana Ave · Tampa, FL
Flood risk 6/10 · Moderate
- FEMA flood zone
- X (unshaded)
- Chance of flooding over 30 yrs
- 0.75%
- Est. flood insurance / yr
- $507 – $1,088
Fire risk 1/10 · Minimal
- Est. fire insurance / yr
- $947 – $1,759
Heat risk 10/10 · Severe
- Hot days now (above 108°F)
- 7 days/yr
- Hot days in 30 yrs
- 26 days/yr
Wind risk 9/10 · Severe
- Chance of severe wind over 30 yrs
- 99.0%
Air-quality risk 3/10 · Minor
- Unhealthy air days now
- 3 days/yr
- Unhealthy air days in 30 yrs
- 3 days/yr
Risk factors via First Street. Map © Google.
Why this score? — see what drove the D grade
The composite is a weighted blend of 9 inputs, each scored 0–100. Each bar is that input's sub-score; the figure is the points it added to the 100-point composite (weight × sub-score).
- Cash flow +15.2/30.0
- ARV discount +7.5/15.0
- DSCR +4.7/10.0
- Schools +4.2/10.0
- Livability +4.0/5.0
- 1% rule +3.4/10.0
- Condition / age +2.5/5.0
- Rent growth +2.2/5.0
- Appreciation +0.0/10.0
$299,999
🖨 Deal sheet (PDF) 📄 Offer letter ✓ Due diligence
Listing remarks MLS
Charming bungalow home is located in historic Seminole Heights. This 3 bedrooms, 1 1/2 bathroom home has been completely renovated, but stays true to its bungalow charm with beautiful molding throughout. The kitchen has been updated with shaker cabinets, granite countertops and stainless steel appliances. The large bedroom can be used as a spacious master, bonus room, office or playroom. There is an inside laundry room, beautiful wide plank laminate flooring, and brand new fence with drive through to a covered carport. New roof, window screens, paint, updated plumbing & electrical and new HVAC. Great location to enjoy all Seminole Heights has to offer. Walk to shops, restaurants and library. Quick jump on to I-275 and less than 10 minuets into the City of Tampa.
Key facts
- New piping
- Sturdy shed
- Handicap ramp
Tags
Property features AI
Finance
- Other: Property type: Residential (Single Family Residence); Zoning: SH-RM
- Financial info: Homestead exempt; No lease restrictions indicated
- HOA & community: No association indicated; Association approval not required
Exterior
- Utilities: Public water; Public sewer; Public utilities
- Home design: Single Family Residence; One story; Faces east
- Construction: Block, brick, and frame construction; Shingle roof; Crawlspace and slab foundation; Building area reported around 1,891 sq ft
- Exterior features: Other exterior features; Lot dimensions approximately 62 x 124; Lot under 1/4 acre (about 0.18 acre)
Interior
- Kitchen: Dishwasher; Range; Refrigerator; Electric water heater
- Bedrooms: 3 bedrooms
- Flooring: Laminate flooring
- Bathrooms: 1 full bathroom; 1 half bathroom
- Heating & cooling: Central heating; Central air conditioning
- Interior features: Other interior features
- Laundry & utility: Washer; Dryer; Laundry features: Other
Neighborhood map
What this means for you Summary
Snapshot
- This is a 3-bed/2.0-bath single-family listed at $300k.
Deal economics
- At list price, monthly cash flow is $105 ($1k/yr) — positive.
- The deal already cash-flows at list — no discount required.
- To meet the 1% rule (rent ≥ 1% of price), the offer needs to be $251k (16.2% below list).
- Recommended offer: $251k (16.2% below list) — sets the bar for 1% rule.
Location & tenants
- Location reads 79/100 on livability (#142 in FL, #2,135 nationally) — a middle-class / working-renter tenant base. Strengths: commute A+, housing A+, health & safety A+; Watch: crime D+.
- Hillsborough (suburban): math 47% / reading 50% proficiency, ranked #41 of 73 in FL (top 56%) — families likely to look elsewhere, expect single-tenant / working-renter base with shorter leases.
- Zoned schools: Broward Elementary School (math 27% / reading 22%, grade F, #2,037 of 2,144 statewide, top 96%, 227 students, 89% FRL); Memorial Middle School (math 30% / reading 29%, grade F, #469 of 571 statewide, top 84%, 600 students, 72% FRL); Hillsborough High School (math 30% / reading 48%, grade F, #312 of 667 statewide, top 48%, 1,891 students, 56% FRL) — zoned schools average 72% FRL vs 52% district-wide (20 pts higher); higher-poverty schools than district average — tighter screening recommended.
- Zoned-school proficiency averages 31% at this address vs 48% district-wide (-18 pts) — the specific schools serving this property underperform the Hillsborough average; the district grade overstates school quality for this exact location.
- Market conditions: Rents soft (-1.3%/yr); 212 active listings in the ZIP; 40 comparable units currently listed for rent nearby; rentals at typical pace (median 22d on market — plan ~3-4 weeks tenant-placement turnaround); 9,053 units permitted in Hillsborough County in 2024 (4,555 in 5+ unit buildings).
- This rent runs 41% of the median local income ($74k/yr) — at the standard rent-burdened threshold; future hikes will face affordability resistance.
Forward outlook
- Local home prices are declining (-3.0%/yr); year-one equity from $2k of loan paydown is wiped out by about $9k of value loss. Plan a longer hold.
- Hillsborough County population projected at +37% by 2050 — long-run rental-demand tailwind backs the buy-and-hold thesis.
Negotiation context
- Only 1 days on market — expect competitive offers; lowballing is unlikely to land.
- 6 sale attempts since 9y ago with the ask held roughly flat each time — persistent listings suggest the price (not the market) is what's stuck; bring a comps-based counter.
- Current owner paid $175k; list at $300k implies a 71% gain — meaningful room to come down on a strong offer.
Risks & watch-outs
- Watch-outs: built in 1910 — expect roof / HVAC / electrical / plumbing capex.
- Climate carrying-cost: major flood risk; severe wind risk, 99% chance of damaging wind over 30y; extreme-heat days projected 7→26/yr by 2055 (HVAC capex compounding) — expect insurance premiums to compound above CPI over the hold.
Questions for the listing agent
- Built in 1910 — when were the roof, HVAC, electrical panel, plumbing, and water heater last replaced?
- Is there a deadline driving the sale (1031 exchange, divorce, estate, relocation)? That informs how much negotiation room exists.
- Crime grade is D in this area — have there been break-ins, vandalism, or insurance claims at this property in the last 3 years? What carrier currently insures it and at what premium?
- The area grade is low — what's the realistic commute time and amenity access for the typical tenant pool here? Any planned neighborhood developments (good or bad) we should know about?
- What's the average days-on-market for RENTAL listings here right now (not sales)? A rising rental-DOM trend means longer vacancies and softer asking-rent achievability than the comps imply.
- What's the recent tenant-quality profile in this submarket — average credit score on applications, eviction rate, late-payment / NSF rate, and stable-employment percentage? A property-management company in the area should have these aggregated.
- How much new for-sale + rental construction is in the pipeline within 1–3 miles? Heavy new supply typically softens prices + rents 12–24 months out; constrained supply supports both.
Investment metrics
- 1% rule
- 0.84% ✗
- Cap rate
- 6.71%
- Cash-on-cash
- 1.50%
- DSCR
- 1.07
- GRM
- 9.9
CMA / ARV
No comps found within radius.
Projected returns pro-forma
-3.0% appreciation · 0.0% rent growth · sell at horizon
- IRR
- -17.1%
- Equity multiple
- 0.41×
- Total profit
- $-49,359
- Equity at exit
- $44,731
- IRR
- -15.1%
- Equity multiple
- 0.25×
- Total profit
- $-63,155
- Equity at exit
- $25,938
Cash invested: $84,000 (down + closing). Projections, not guarantees.
Landlord ↔ Tenant lean methodology
- Overall (STATE)
- 87 Strongly Landlord-Friendly
- State Florida
- 87 Strongly Landlord-Friendly · R+3
- County
- — inherits STATE
- City
- — inherits STATE
ZIP-level market 33603
- Rents YoY
- -1.3%
- Active inventory
- 212
- Price-to-rent
- 9.9×
Monthly cashflow live
- Estimated rent
- $2,515 high interval (Pro) →
- Mortgage (P&I)
- −$1,573
- Tax from tax record
- −$183 /mo · $2,199/yr
- Insurance
- −$125
- HOA
- −$0
- Vacancy / Maint / Mgmt
- −$528
- Net cashflow
- $105
Break-even live
Sensitivity live
| Price | -10% $275 | -5% $190 | +0% $105 | +5% $20 | +10% $-65 |
|---|---|---|---|---|---|
| Rent | -10% $-93 | -5% $6 | +0% $105 | +5% $205 | +10% $304 |
| Rate | -1.0pp $256 | -0.5pp $182 | base $105 | +0.5pp $28 | +1.0pp $-52 |
UW: 25.0% down · 7.5% · 30yr · 1.5% tax · 5.0% vac · 8.0% maint · 8.0% mgmt
Financing live
Cash to close
- Down payment
- $75,000
- Closing costs
- $9,000
- Reserves months
- —
- Total cash needed
- —
Loan-product check · same deal, 3 products live
Conventional
25% down · 7.5% · 30yr
- Down + closing
- —
- Monthly P&I
- —
- Monthly cashflow
- —
- DSCR
- —
- Eligible?
- —
Personal DTI + credit; lowest rate.
DSCR
20% down · 8.5% · 30yr
- Down + closing
- —
- Monthly P&I
- —
- Monthly cashflow
- —
- DSCR
- —
- Eligible?
- —
No personal income docs; deal must DSCR.
Hard money
10% down · 12.0% · 12mo
- Down + closing
- —
- Monthly P&I
- —
- Monthly cashflow
- —
- DSCR
- —
- Eligible?
- —
Short-term bridge; refi at stabilization.
Rent comps 40 comps
| Address | Beds | Baths | Sqft | Rent | $/sqft | DOM | Units | Dist |
|---|---|---|---|---|---|---|---|---|
| 902 E Curtis St Unit 1 Tampa, FL | 2.0 | 2.0 | 1325 | $3,200 | $2.42 | 19d | 1 | 0.15mi |
| 807 E Genesee St Tampa, FL | 3.0 | 2.0 | 1414 | $2,400 | $1.70 | 22d | 1 | 0.34mi |
| 807 E Genesee St Unit 1/2 Tampa, FL | 3.0 | 2.0 | 1414 | $2,400 | $1.70 | 24d | 1 | 0.34mi |
| 4513 N Florida Ave Tampa, FL | 2.0 | 1.0 | 887 | $2,299 | $2.59 | 3d | 6 | 0.41mi |
| 1108 E Chelsea St Tampa, FL | 3.0 | 2.0 | 1637 | $3,250 | $1.99 | 26d | 1 | 0.43mi |
| 1202 E Caracas St Tampa, FL | 3.0 | 3.0 | 1224 | $2,595 | $2.12 | 26d | 1 | 0.44mi |
| 4017 N Seminole Ave Tampa, FL | 4.0 | 1.0 | 1104 | $1,950 | $1.77 | 26d | 1 | 0.47mi |
| 1301 E Cayuga St Tampa, FL | 3.0 | 1.5 | 1216 | $2,200 | $1.81 | 26d | 1 | 0.53mi |
| 203 W Emma St Tampa, FL | 3.0 | 2.0 | 1279 | $2,700 | $2.11 | 26d | 1 | 0.55mi |
| 203 W Emma St Tampa, FL | 3.0 | 2.0 | 1279 | $2,500 | $1.95 | 13d | 1 | 0.55mi |
| 203 W Haya St Tampa, FL | 2.0 | 1.0 | 990 | $1,950 | $1.97 | 7d | 1 | 0.57mi |
| 4501 N Highland Ave Unit Main House Tampa, FL | 4.0 | 2.0 | 1500 | $3,300 | $2.20 | 18d | 1 | 0.58mi |
| 309 W Osborne Ave Tampa, FL | 3.0 | 1.5 | 1462 | $3,300 | $2.26 | 26d | 1 | 0.60mi |
| 203 W Crest Ave Tampa, FL | 2.0 | 1.0 | 900 | $2,100 | $2.33 | 26d | 1 | 0.61mi |
| 302 E Selma Ave Tampa, FL | 3.0 | 1.0 | 989 | $2,200 | $2.22 | 26d | 1 | 0.62mi |
| 309 E Selma Ave Tampa, FL | 3.0 | 2.0 | 1170 | $3,095 | $2.65 | 7d | 1 | 0.63mi |
| 1501 E Palifox St Tampa, FL | 3.0 | 2.0 | 1248 | $1,750 | $1.40 | 16d | 1 | 0.65mi |
| 1212 E Mohawk Ave Tampa, FL | 3.0 | 1.0 | 1266 | $1,995 | $1.58 | 22d | 1 | 0.68mi |
| 212 W North Bay St Tampa, FL | 3.0 | 1.0 | 1065 | $2,600 | $2.44 | 5d | 1 | 0.69mi |
| 309 W Alva St Tampa, FL | 3.0 | 2.0 | 1152 | $2,650 | $2.30 | 0d | 1 | 0.69mi |
| 1209 E Comanche Ave Tampa, FL | 2.0 | 2.0 | 1659 | $2,500 | $1.51 | 7d | 1 | 0.70mi |
| 314 W Alva St Tampa, FL | 3.0 | 2.0 | 1170 | $3,000 | $2.56 | 26d | 1 | 0.72mi |
| 1517 E Ellicott St Tampa, FL | 3.0 | 2.0 | 1292 | $2,225 | $1.72 | 18d | 1 | 0.72mi |
| 1608 E New Orleans Ave Tampa, FL | 4.0 | 2.0 | 1254 | $1,895 | $1.51 | 16d | 1 | 0.73mi |
| 406 W Alva St Tampa, FL | 2.0 | 1.0 | 936 | $2,500 | $2.67 | 26d | 1 | 0.78mi |
| 5706 N Suwanee Ave Unit 1271940P Tampa, FL | 2.0 | 1.0 | 914 | $2,739 | $3.00 | 1d | 1 | 0.79mi |
| 1711 E New Orleans Ave Tampa, FL | 3.0 | 2.0 | 1136 | $2,250 | $1.98 | 22d | 1 | 0.80mi |
| 1602 E North Bay St Tampa, FL | 3.0 | 2.0 | 1200 | $2,100 | $1.75 | 26d | 1 | 0.80mi |
| 809 E Baker St Unit A Tampa, FL | 3.0 | 1.0 | 1083 | $2,100 | $1.94 | 0d | 1 | 0.82mi |
| 3519 N 10th St Tampa, FL | 3.0 | 2.0 | 1200 | $1,850 | $1.54 | 19d | 1 | 0.83mi |
| 1305 E Louise Ave Tampa, FL | 3.0 | 2.0 | 1384 | $2,700 | $1.95 | 26d | 1 | 0.83mi |
| 1504 E 33rd Ave Tampa, FL | 3.0 | 2.0 | 1108 | $2,900 | $2.62 | 26d | 1 | 0.86mi |
| 3916 N Ola Ave Tampa, FL | 3.0 | 2.0 | 1673 | $3,200 | $1.91 | 19d | 1 | 0.87mi |
| 4412 N Clearfield Ave Tampa, FL | 3.0 | 2.0 | 1336 | $2,250 | $1.68 | 26d | 1 | 0.87mi |
| 3511 Cone Ct Tampa, FL | 3.0 | 2.0 | 1256 | $2,200 | $1.75 | 7d | 1 | 0.88mi |
| 1505 E Comanche Ave Tampa, FL | 3.0 | 2.5 | 1750 | $2,849 | $1.63 | 0d | 2 | 0.88mi |
| 1709 E Chelsea St Unit F Tampa, FL | 2.0 | 1.0 | 1041 | $1,625 | $1.56 | 26d | 1 | 0.89mi |
| 3906 N Ola Ave Tampa, FL | 3.0 | 2.0 | 1225 | $2,575 | $2.10 | 26d | 1 | 0.89mi |
| 5205 N Boulevard Tampa, FL | 1.0–3.0 | 1.0–2.0 | 1175 | $2,241 | $1.91 | 5d | 17 | 0.93mi |
| 303 E Paris St Tampa, FL | 2.0 | 2.0 | 1442 | $2,200 | $1.53 | 26d | 1 | 0.95mi |
Listing history 3 events
-
2026-06-02status $299,999 Pending 1 DOM
-
2026-06-01remarks 699-char remark
-
2026-06-01$299,999 Active 1 DOM
ⓘ Source: listings_history table (triggers on properties + properties_extension) + one-shot
backfill from property_details.listing_events for pre-trigger history.
Tax reassessment forecast FL · Resets to sale price
- Current annual tax
- $2,199 · $183/mo
- Projected year-2 tax
- $2,490 · $207/mo
- Expected delta
- +$291/yr (+$24/mo · 13.2%)
ⓘ Screening estimate from a state-policy table — verify with the county assessor before closing.
Climate risk First Street
- Flood 6/10 Major FEMA zone X (unshaded) · 75% chance over 30 yrs
- Wildfire 1/10 Low
- Heat 10/10 Extreme 7 d/yr ≥108°F today · 26 d/yr by 30 yrs out
- Wind 9/10 Extreme 99% chance of damaging wind over 30 yrs
- Air quality 3/10 Moderate 3 unhealthy d/yr today · 3 by 30 yrs out
Nearby sold comps map
Loading sold comps map…
Walkable amenities ~0.75 mi
Loading nearby amenities…
Taxation est. · year 1
- Rental income
- $30,178
- − Mortgage interest
- −$16,805
- − Property taxes
- −$2,199
- − Insurance
- −$1,500
- − Repairs & maintenance
- −$2,414
- − Management
- −$2,414
- − Depreciation
- −$8,727
- Taxable loss
- −$3,881
- Est. tax savings @ 24.0%
- +$931
- After-tax cash flow
- $2,195/yr
For passive investors: Depreciation is non-cash, so a rental often shows a tax loss while cash-flowing — sheltering income. Rental losses are passive: they offset passive income freely, and up to $25,000/yr can offset ordinary (W-2) income if you actively participate and your MAGI is under $100k (phasing out to $0 by $150k); unused losses carry forward. On sale, claimed depreciation is recaptured at up to 25%, and gains may owe capital-gains tax (a 1031 exchange can defer both). Figures are a year-1 estimate at your 24.0% rate — not tax advice; consult a CPA.
Schools (NCES district)
- District
- Hillsborough
- NCES district ID
- 1200870
- Math proficiency
- 47% ▼ -8.00%
- Reading proficiency
- 50% ▼ -4.00%
- Median HH income
- $50,622
- Composite
- 41.6/100
- National rank
- #3435
- State rank
- #41 of 73 in FL
Livability — Tampa
- Score
- 79/100
- State rank
- #142
- US rank
- #2135
Category grades
Schools grade is shown separately in the Schools card above.
Census & demographics
- Census place
- Tampa, FL
- County
- Hillsborough County · 1,540,968 people
- City population
- 523,346
- Metro
- Tampa-St. Petersburg-Clearwater, FL
- Population (ZIP)
- 19,869
- Household income
- $74,081
- Rent vs Own
- Severe rent burden
- 800.0
Population outlook (Hillsborough County) Hauer SSP2
- Today (2025)
- 1,607,022 people
- By 2030
- 1,733,968 · +7.9%
- By 2040
- 1,979,565 · +23.2%
- By 2050
- 2,203,427 · +37.1%
- By 2075
- 2,667,893 · +66.0%
- By 2100
- 2,891,558 · +79.9%
Race, ethnicity, and origin ACS 2023
- Neighborhood character
- Diverse neighborhood (Simpson 0.67)
- Race & ethnicity
- White 44% Hispanic / Latino 33% Two or more races 22% Black 17%
- Hispanic origin (detail)
- Mexican 1% Puerto Rican 7% Cuban 15% Dominican 1%
- Common ancestry
- Italian 3% Romanian 2% Slovak 2%
- Foreign-born
- 18% · Canada, Jamaica
- Languages at home
- 74% English-only · Spanish 25%
Political lean MEDSL · Hillsborough
- 2024 margin
- Toss-up / Even · D 47.8% · R 50.9% · Other 1.3%
- 2008→2024 swing
- -10.2pp toward R · 2008: 7.1pp · 2024: -3.1pp
- All cycles
- 2024: R+3.1 2020: D+6.9 2016: D+6.8 2012: D+6.7 2008: D+7.1
Not yet ingested
- Civics
- —
Market trends
- HPI YoY
- ▼ -256.57%
- Current HPI
- 467.4179
- Rent YoY
- ▼ -1.33%
- Metro
- Tampa-St. Petersburg-Clearwater, FL
- State GDP YoY
- ▲ 3.28%
- F500 in state
- 36
Industry mix (Fortune 500 HQ in FL)
| Industry | F500 HQs | Revenue |
|---|---|---|
| Industrial Technology | 2 | $29B |
|
||
| Insurance | 2 | $17B |
|
||
| Retail | 1 | $60B |
|
||
| Technology Distribution | 1 | $58B |
|
||
| Homebuilding | 1 | $35B |
|
||
| Technology Manufacturing | 1 | $35B |
|
||
Price history
+2172.7% since first listed19 events — show timeline
- 2026-06-01 Listed $299,999 Stellar MLS as Distributed by MLS Grid
- 2022-10-26 Listing Removed — Stellar MLS as Distributed by MLS Grid
- 2022-10-23 Relisted — Stellar MLS as Distributed by MLS Grid
- 2022-10-10 Pending — Stellar MLS as Distributed by MLS Grid
- 2022-09-25 Listed $335,000 Stellar MLS as Distributed by MLS Grid
- 2018-04-23 Sold (Public Records) $175,000 Public Records
- 2018-04-19 Sold (MLS) $175,000 Stellar MLS as Distributed by MLS Grid
- 2018-04-11 Pending — Stellar MLS as Distributed by MLS Grid
- 2018-03-24 Pending — Stellar MLS as Distributed by MLS Grid
- 2018-03-22 Pending — Stellar MLS as Distributed by MLS Grid
- 2018-03-03 Pending — Stellar MLS as Distributed by MLS Grid
- 2018-02-08 Relisted — Stellar MLS as Distributed by MLS Grid
- 2017-12-20 Pending — Stellar MLS as Distributed by MLS Grid
- 2017-12-19 Listing Removed — Stellar MLS as Distributed by MLS Grid
- 2017-12-15 Listed $179,000 Stellar MLS as Distributed by MLS Grid
- 2017-04-20 Pending — Stellar MLS as Distributed by MLS Grid
- 2017-04-19 Listing Removed — Stellar MLS as Distributed by MLS Grid
- 2017-03-27 Listed $189,900 Stellar MLS as Distributed by MLS Grid
- 1973-01-01 Sold (Public Records) $13,200 Public Records
Property tax history
+12.7%/yrLatest (2025): $2,199 · +8.2% YoY. Source: county tax records.
Cash-flow waterfall
monthlySold comps — $/sqft
last 12 mo · ≤1 miLoading sold comps…