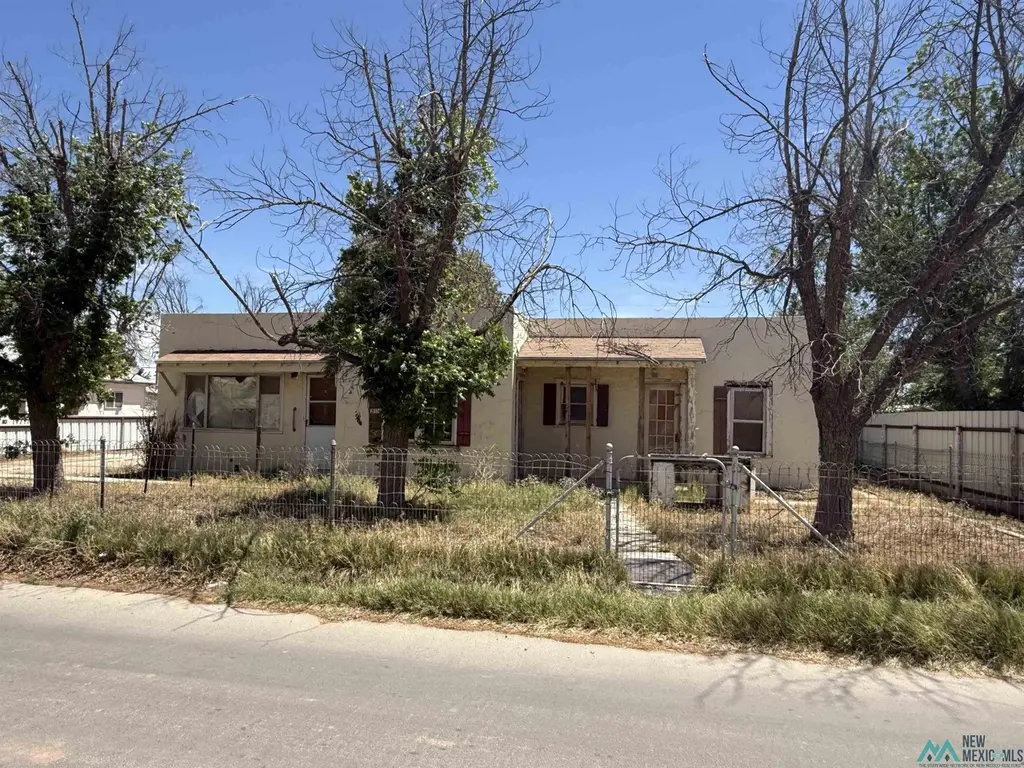
314 N Second St · Carlsbad, NM
Flood risk 1/10 · Minimal
- FEMA flood zone
- X (unshaded)
- Chance of flooding over 30 yrs
- 0.0%
- Est. flood insurance / yr
- $507 – $1,088
Fire risk 8/10 · Major
- Est. fire insurance / yr
- $706 – $1,312
Heat risk 6/10 · Moderate
- Hot days now (above 102°F)
- 7 days/yr
- Hot days in 30 yrs
- 20 days/yr
Wind risk 2/10 · Minimal
- Chance of severe wind over 30 yrs
- —
Air-quality risk 1/10 · Minimal
- Unhealthy air days now
- 0 days/yr
- Unhealthy air days in 30 yrs
- 0 days/yr
Risk factors via First Street. Map © Google.
Why this score? — see what drove the B grade
The composite is a weighted blend of 9 inputs, each scored 0–100. Each bar is that input's sub-score; the figure is the points it added to the 100-point composite (weight × sub-score).
- Cash flow +30.0/30.0
- ARV discount +10.9/15.0
- 1% rule +10.0/10.0
- DSCR +10.0/10.0
- Schools +5.0/10.0
- Livability +3.5/5.0
- Rent growth +2.5/5.0
- Condition / age +2.5/5.0
- Appreciation +0.0/10.0
$89,000
🖨 Deal sheet 📄 Offer letter ✓ Due diligence
Key facts
- 0.25 acre lot
- 2 garage spots
- Built 1970
Property features AI
Exterior
- Parking: Detached garage; Two covered parking spaces (two total parking spaces)
- Utilities: Electricity connected; Sewer connected
- Home design: Single-family residence; One-story home; One level
- Construction: Adobe and stucco construction
- Exterior features: Lot roughly 0.25 acre (about 10,920 sq ft); Lot dimensions approximately 78 x 140
Interior
- Bathrooms: Two full bathrooms
- Heating & cooling: No heating system listed
- Interior features: Crawl space basement
Neighborhood map
What this means for you Summary
Snapshot
- This is a 2-bed/2.0-bath single-family listed at $89k.
Deal economics
- At list price, monthly cash flow is $567 ($7k/yr) — positive.
- The deal already cash-flows at list — no discount required.
- Meets the 1% rule at list price ($1k rent vs $89k).
- Recommended offer: $86k (3.0% below list) — sets the bar for market timing.
Location & tenants
- Location reads 70/100 on livability (#20 in NM) — a middle-class / working-renter tenant base. Strengths: cost of living A+, housing A+, employment A; Watch: commute C-, health & safety C-, schools D.
- Market conditions: 363 active listings in the ZIP; 2 comparable units currently listed for rent nearby; solid renter incomes; 156 units permitted in Eddy County in 2024 (0 in 5+ unit buildings).
Forward outlook
- Local home prices are declining (-3.0%/yr); year-one equity from $615 of loan paydown is wiped out by about $3k of value loss. Plan a longer hold.
- Eddy County population projected at +36% by 2050 — long-run rental-demand tailwind backs the buy-and-hold thesis.
- At projected returns (-3.0% appreciation + 3.0% rent growth), your $25k cash investment doubles in ~5 years — after that, you're playing with house money.
Negotiation context
- It's been on market 33 days — a 3% lower offer ($86k) is reasonable based on typical stale-listing flexibility.
Risks & watch-outs
- Climate carrying-cost: severe wildfire risk; extreme-heat days projected 7→20/yr by 2055 (HVAC capex compounding) — expect insurance premiums to compound above CPI over the hold.
Questions for the listing agent
- It's been on market 33 days. Have you received any prior offers? Is the seller open to a 3% concession, seller financing, or rate buy-down credit?
- Built in 1970 — when were the roof, HVAC, electrical panel, plumbing, and water heater last replaced?
- Is there a deadline driving the sale (1031 exchange, divorce, estate, relocation)? That informs how much negotiation room exists.
- Schools are D-rated, which usually means shorter tenancies and higher turnover. Who's the typical renter profile here, and what's been the actual vacancy rate?
- Crime grade is F in this area — have there been break-ins, vandalism, or insurance claims at this property in the last 3 years? What carrier currently insures it and at what premium?
- What's the average days-on-market for RENTAL listings here right now (not sales)? A rising rental-DOM trend means longer vacancies and softer asking-rent achievability than the comps imply.
- What's the recent tenant-quality profile in this submarket — average credit score on applications, eviction rate, late-payment / NSF rate, and stable-employment percentage? A property-management company in the area should have these aggregated.
- How much new for-sale + rental construction is in the pipeline within 1–3 miles? Heavy new supply typically softens prices + rents 12–24 months out; constrained supply supports both.
Investment metrics
- 1% rule
- 1.56% ✓
- Cap rate
- 13.94%
- Cash-on-cash
- 27.29%
- DSCR
- 2.21
- GRM
- 5.3
CMA / ARV
- ARV (median comp)
- $96,252
- List price
- $89,000
- Delta
- -7.53%
- Verdict
- FAIR
- Comps
- 2 within 2.0 mi
Projected returns pro-forma
-3.0% appreciation · 3.0% rent growth · sell at horizon
- IRR
- 21.3%
- Equity multiple
- 1.87×
- Total profit
- $21,646
- Equity at exit
- $13,270
- IRR
- 29.4%
- Equity multiple
- 3.62×
- Total profit
- $65,203
- Equity at exit
- $7,695
Cash invested: $24,920 (down + closing). Projections, not guarantees.
Landlord ↔ Tenant lean methodology
- Overall (STATE)
- 55 Moderately Landlord-Leaning
- State New Mexico
- 55 Moderately Landlord-Leaning · D+3
- County
- — inherits STATE
- City
- — inherits STATE
ZIP-level market 88220
- Active inventory
- 363
- Price-to-rent
- 5.3×
Monthly cashflow live
- Estimated rent
- $1,388 medium interval (Pro) →
- Mortgage (P&I)
- −$467
- Tax from tax record
- −$26 /mo · $307/yr
- Insurance
- −$37
- HOA
- −$0
- Vacancy / Maint / Mgmt
- −$291
- Net cashflow
- $567
Break-even live
UW: 25.0% down · 7.5% · 30yr · 1.5% tax · 5.0% vac · 8.0% maint · 8.0% mgmt
Financing live
Cash to close
- Down payment
- $22,250
- Closing costs
- $2,670
- Reserves months
- —
- Total cash needed
- —
Loan-product check · same deal, 3 products live
Conventional
25% down · 7.5% · 30yr
- Down + closing
- —
- Monthly P&I
- —
- Monthly cashflow
- —
- DSCR
- —
- Eligible?
- —
Personal DTI + credit; lowest rate.
DSCR
20% down · 8.5% · 30yr
- Down + closing
- —
- Monthly P&I
- —
- Monthly cashflow
- —
- DSCR
- —
- Eligible?
- —
No personal income docs; deal must DSCR.
Hard money
10% down · 12.0% · 12mo
- Down + closing
- —
- Monthly P&I
- —
- Monthly cashflow
- —
- DSCR
- —
- Eligible?
- —
Short-term bridge; refi at stabilization.
Rent comps 2 comps
| Address | Beds | Baths | Sqft | Rent | $/sqft | DOM | Units | Dist |
|---|---|---|---|---|---|---|---|---|
| 1308 W Church St Unit A Carlsbad, NM | 1.0 | 1.0 | 750 | $975 | $1.30 | 44d | 1 | 0.45mi |
| 302 N Lake St Carlsbad, NM | 2.0 | 1.0 | 932 | $1,500 | $1.61 | 44d | 1 | 0.76mi |
Listing history 1 events
-
2026-04-26$99,000 Active 185-char remark
ⓘ Source: listings_history table (triggers on properties + properties_extension) + one-shot
backfill from property_details.listing_events for pre-trigger history.
Tax reassessment forecast NM · Resets to sale price
- Current annual tax
- $307 · $26/mo
- Projected year-2 tax
- $712 · $59/mo
- Expected delta
- +$405/yr (+$34/mo · 131.8%)
ⓘ Screening estimate from a state-policy table — verify with the county assessor before closing.
Climate risk First Street
- Flood 1/10 Low FEMA zone X (unshaded) · 0% chance over 30 yrs
- Wildfire 8/10 Severe
- Heat 6/10 Major 7 d/yr ≥102°F today · 20 d/yr by 30 yrs out
- Wind 2/10 Low
- Air quality 1/10 Low 0 unhealthy d/yr today · 0 by 30 yrs out
Nearby sold comps map
Loading sold comps map…
Walkable amenities ~0.75 mi
Loading nearby amenities…
Taxation est. · year 1
- Rental income
- $16,651
- − Mortgage interest
- −$4,985
- − Property taxes
- −$307
- − Insurance
- −$445
- − Repairs & maintenance
- −$1,332
- − Management
- −$1,332
- − Depreciation
- −$2,589
- Taxable income
- $5,660
- Est. tax owed @ 24.0%
- −$1,358
- After-tax cash flow
- $5,443/yr
For passive investors: Depreciation is non-cash, so a rental often shows a tax loss while cash-flowing — sheltering income. Rental losses are passive: they offset passive income freely, and up to $25,000/yr can offset ordinary (W-2) income if you actively participate and your MAGI is under $100k (phasing out to $0 by $150k); unused losses carry forward. On sale, claimed depreciation is recaptured at up to 25%, and gains may owe capital-gains tax (a 1031 exchange can defer both). Figures are a year-1 estimate at your 24.0% rate — not tax advice; consult a CPA.
Schools (NCES district)
No district data.
Livability — Carlsbad
- Score
- 70/100
- State rank
- #20
- US rank
- #7925
Category grades
Schools grade is shown separately in the Schools card above.
Census & demographics
- Census place
- Carlsbad, NM
- County
- Eddy County · 58,370 people
- City population
- 39,828
- Metro
- Carlsbad-Artesia, NM
- Population (ZIP)
- 39,828
- Household income
- $78,162
- Rent vs Own
- Severe rent burden
- 661.0
Population outlook (Eddy County) Hauer SSP2
- Today (2025)
- 65,505 people
- By 2030
- 69,797 · +6.6%
- By 2040
- 79,191 · +20.9%
- By 2050
- 89,199 · +36.2%
- By 2075
- 115,829 · +76.8%
- By 2100
- 129,336 · +97.4%
Race, ethnicity, and origin ACS 2023
- Neighborhood character
- Diverse neighborhood (Simpson 0.56)
- Race & ethnicity
- Hispanic / Latino 48% White 46% Two or more races 22% Black 2% Native American 1%
- Hispanic origin (detail)
- Mexican 41%
- Common ancestry
- Lithuanian 1% Slovak 1% Serbian 1%
- Foreign-born
- 6% · Canada
- Languages at home
- 76% English-only · Spanish 24%
Political lean MEDSL · Eddy
- 2024 margin
- Solid R (+55.9) · D 21.4% · R 77.3% · Other 1.3%
- 2008→2024 swing
- -30.2pp toward R · 2008: -25.6pp · 2024: -55.9pp
- All cycles
- 2024: R+55.9 2020: R+51.8 2016: R+41.6 2012: R+33.5 2008: R+25.6
Not yet ingested
- Civics
- —
Market trends
- HPI YoY
- ▼ -283.72%
- Current HPI
- 114.115
- Rent YoY
- —
- Metro
- Carlsbad-Artesia, NM
- State GDP YoY
- —
- F500 in state
- 0
Price history
-10.1% since first listed4 events — show timeline
- 2026-06-16 Sold (MLS) — NMMLS
- 2026-05-29 Pending — NMMLS
- 2026-05-22 Price Changed $89,000 NMMLS
- 2026-04-26 Listed $99,000 NMMLS
Property tax history
+3.1%/yrLatest (2025): $307 · +1.8% YoY. Source: county tax records.
Cash-flow waterfall
monthlySold comps — $/sqft
last 12 mo · ≤1 miLoading sold comps…