 🏷️ Likely Rental
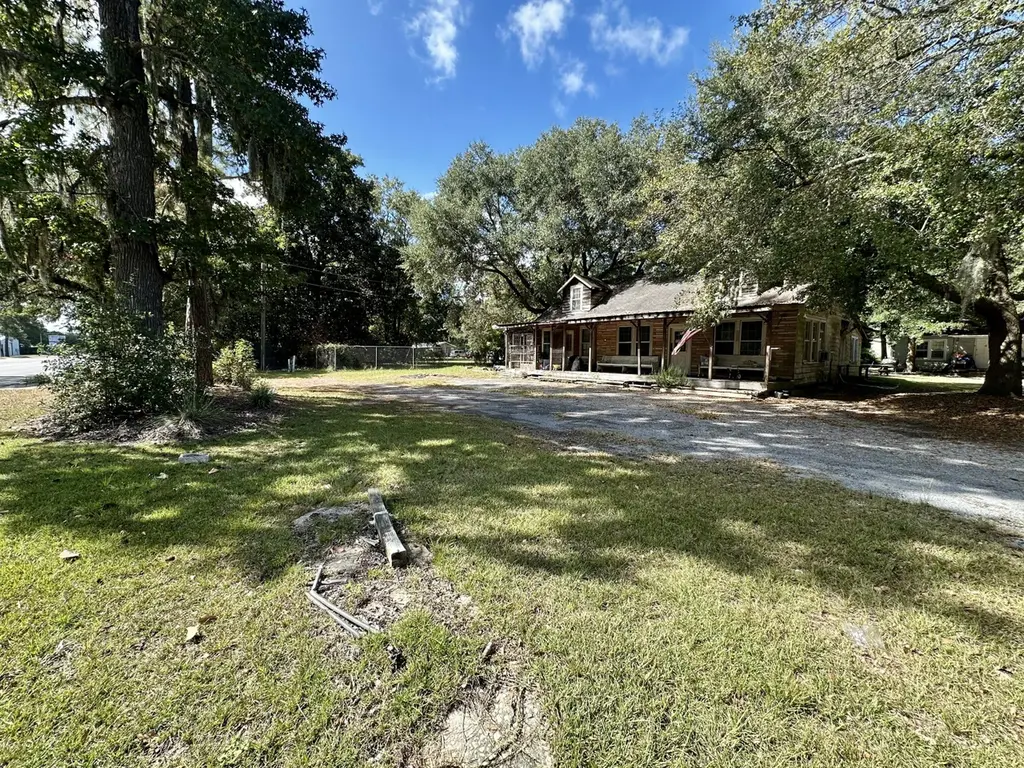
1420 N Highway 52 Dr · Moncks Corner, SC
Flood risk No data
- FEMA flood zone
- —
- Chance of flooding over 30 yrs
- —
- Est. flood insurance / yr
- —
Fire risk No data
- Est. fire insurance / yr
- —
Heat risk No data
- Hot days now (above threshold)
- —
- Hot days in 30 yrs
- —
Wind risk No data
- Chance of severe wind over 30 yrs
- —
Air-quality risk No data
- Unhealthy air days now
- —
- Unhealthy air days in 30 yrs
- —
Risk factors via First Street. Map © Google.
Why this score? — see what drove the B- grade
The composite is a weighted blend of 9 inputs, each scored 0–100. Each bar is that input's sub-score; the figure is the points it added to the 100-point composite (weight × sub-score).
- Cash flow +30.0/30.0
- DSCR +10.0/10.0
- 1% rule +9.7/10.0
- ARV discount +7.5/15.0
- Schools +3.6/10.0
- Livability +3.4/5.0
- Rent growth +3.2/5.0
- Condition / age +1.0/5.0
- Appreciation +0.0/10.0
$190,000
🖨 Deal sheet 📄 Offer letter ✓ Due diligence
Listing remarks
Remarkable opportunity to own one of the most visible locations between Moncks Corner and Bonneau. This old country store ran for years and just needs the right person to bring it back to where people shop in the store and hang out on the full front porch. The store has a residential dwelling attached to it that has a kitchen and living room plus 3 bedrooms. Also on the property is a 2 bedroom, 2 bath single-family detached home with a carport, wood floors, kitchen and a living room. With county approval, this could make a great small office or keep it as a rental. Current rental on back house is month-to-month lease. Potential for some much more rental income between these properties. Come
Key facts
- Close to river
- Full front porch
- Close to the lake
Tags
Property features AI
Finance
- HOA & community: Community features include boat ramp, marina, central TV antenna, RV/boat storage and parking, and walk/jog trails
Exterior
- Parking: 1-car carport; Off-street parking; Other parking
- Utilities: Septic tank; BCW & SA water available; Berkeley Electric Co-Op power
- Home design: Single family detached residential property; One to two levels; Ground level entry
- Construction: Asphalt roof; Fee simple ownership
- Exterior features: Additional structures including shed(s), storage, workshop, and guest house; Other exterior features
Interior
- Kitchen: Eat-in kitchen
- Bedrooms: 5 bedrooms; Primary bedroom on lower level with ceiling fan(s) and split plan
- Flooring: Laminate; Wood
- Bathrooms: 2 bathrooms
- Interior features: High ceilings; Bonus room; Eat-in kitchen; Family room; Game room; Great room; Living/dining combo; Media room; Office; Separate dining room; Study; Utility room; See remarks/other
- Laundry & utility: Laundry room
Neighborhood map
What this means for you Summary
Snapshot
- This is a 5-bed/2.0-bath single-family listed at $190k. Condition is rated poor.
Deal economics
- At list price, monthly cash flow is $887 ($11k/yr) — positive.
- The deal already cash-flows at list — no discount required.
- Meets the 1% rule at list price ($3k rent vs $190k).
- Recommended offer: $184k (3.0% below list) — sets the bar for market timing.
- Cap rate 11.9% vs local median 4.3% in Moncks Corner — top-decile yield for the area; either an underpriced asset or a hidden risk that comps aren't pricing in. Stress-test before assuming the spread holds.
Location & tenants
- Location reads 67/100 on livability (#99 in SC) — a middle-class / working-renter tenant base. Strengths: housing A+, health & safety A+, cost of living A; Watch: crime C-, amenities F, commute F.
- Berkeley 01 (suburban): math 35% / reading 48% proficiency, ranked #30 of 80 in SC (top 38%) — families likely to look elsewhere, expect single-tenant / working-renter base with shorter leases.
- Zoned schools: Henry E. Bonner Elementary (math 38% / reading 40%, grade F, #301 of 597 statewide, top 51%, 828 students, 100% FRL); Macedonia Middle (math 23% / reading 43%, grade F, #116 of 229 statewide, top 51%, 383 students, 100% FRL); Timberland High (math 17% / reading 72%, grade F, #166 of 196 statewide, top 87%, 704 students, 100% FRL) — zoned schools average 100% FRL vs 48% district-wide (52 pts higher); higher-poverty schools than district average — tighter screening recommended.
- Market conditions: Rents rising (+2.8%/yr); 642 active listings in the ZIP; 4 comparable units currently listed for rent nearby; rentals at typical pace (median 21d on market — plan ~3-4 weeks tenant-placement turnaround); solid renter incomes; 3,183 units permitted in Berkeley County in 2024 (580 in 5+ unit buildings).
- This rent runs 40% of the median local income ($83k/yr) — at the standard rent-burdened threshold; future hikes will face affordability resistance.
Forward outlook
- Local home prices are declining (-3.0%/yr); year-one equity from $1k of loan paydown is wiped out by about $6k of value loss. Plan a longer hold.
- Berkeley County population projected at +48% by 2050 — long-run rental-demand tailwind backs the buy-and-hold thesis.
- At projected returns (-3.0% appreciation + 2.8% rent growth), your $53k cash investment doubles in ~7 years — after that, you're playing with house money.
Negotiation context
- It's been on market 51 days — a 3% lower offer ($184k) is reasonable based on typical stale-listing flexibility.
- 3 sale attempts with the ask held roughly flat each time — persistent listings suggest the price (not the market) is what's stuck; bring a comps-based counter.
Questions for the listing agent
- It's been on market 51 days. Have you received any prior offers? Is the seller open to a 3% concession, seller financing, or rate buy-down credit?
- Have any recent inspections been done? Can we get a copy of the seller's disclosures and any deferred-maintenance estimates?
- Built in 1960 — when were the roof, HVAC, electrical panel, plumbing, and water heater last replaced?
- Is there a deadline driving the sale (1031 exchange, divorce, estate, relocation)? That informs how much negotiation room exists.
- Schools are D-rated, which usually means shorter tenancies and higher turnover. Who's the typical renter profile here, and what's been the actual vacancy rate?
- What's the average days-on-market for RENTAL listings here right now (not sales)? A rising rental-DOM trend means longer vacancies and softer asking-rent achievability than the comps imply.
- What's the recent tenant-quality profile in this submarket — average credit score on applications, eviction rate, late-payment / NSF rate, and stable-employment percentage? A property-management company in the area should have these aggregated.
- How much new for-sale + rental construction is in the pipeline within 1–3 miles? Heavy new supply typically softens prices + rents 12–24 months out; constrained supply supports both.
Investment metrics
- 1% rule
- 1.47% ✓
- Cap rate
- 11.90%
- Cash-on-cash
- 20.01%
- DSCR
- 1.89
- GRM
- 5.7
CMA / ARV
- ARV (on-the-fly)
- $482,400
- Comps found
- 8
Show comp detail 8 sales within ~0.75 mi
| Address | Dist | Beds/Ba | Sqft | Sold | Price | $/sf | Match |
|---|---|---|---|---|---|---|---|
| 281 Blue Haw Dr | 0.24mi | 6/3.0 (+1) | 3,209 (-0%) | 11mo | $497,200 | $155 | 71 |
| 420 Tulip Poplar Dr | 0.39mi | 6/3.0 (+1) | 3,209 (-0%) | 4mo | $480,225 | $150 | 70 |
| 315 Blue Haw Dr | 0.39mi | 6/3.0 (+1) | 3,209 (-0%) | 12mo | $470,900 | $147 | 62 |
| 234 Yarrow Way | 0.39mi | 5/4.5 | 3,389 (+5%) | 2mo | $507,285 | $150 | 61 |
| 225 Wild Strawberry Ln | 0.25mi | 5/4.5 | 3,415 (+6%) | 10mo | $499,900 | $146 | 60 |
| 321 Blue Haw Dr | 0.74mi | 6/3.0 (+1) | 3,209 (-0%) | 12mo | $469,850 | $146 | 46 |
| 301 Blue Haw Dr | 0.74mi | 6/3.0 (+1) | 3,209 (-0%) | 14mo | $472,540 | $147 | 44 |
| 325 Lakewind Dr | 0.69mi | 4/2.5 (-1) | 2,857 (-11%) | 16mo | $480,000 | $168 | 29 |
Match score weights: distance 35% · size 25% · config 20% · recency 20%. Top-matched comps best support the ARV.
Projected returns pro-forma
-3.0% appreciation · 2.77% rent growth · sell at horizon
- IRR
- 11.9%
- Equity multiple
- 1.47×
- Total profit
- $25,119
- Equity at exit
- $28,330
- IRR
- 20.7%
- Equity multiple
- 2.73×
- Total profit
- $92,181
- Equity at exit
- $16,428
Cash invested: $53,200 (down + closing). Projections, not guarantees.
Landlord ↔ Tenant lean methodology
- Overall (STATE)
- 90 Strongly Landlord-Friendly
- State South Carolina
- 90 Strongly Landlord-Friendly · R+6
- County
- — inherits STATE
- City
- — inherits STATE
ZIP-level market 29461
- Home prices YoY
- -13.9%
- Rents YoY
- 2.8%
- Active inventory
- 642
- Price-to-rent
- 5.7×
Monthly cashflow live
- Estimated rent
- $2,785 medium interval (Pro) →
- Mortgage (P&I)
- −$996
- Tax est. 1.5%
- −$238 /mo · $2,850/yr
- Insurance
- −$79
- HOA
- −$0
- Vacancy / Maint / Mgmt
- −$585
- Net cashflow
- $887
Break-even live
UW: 25.0% down · 7.5% · 30yr · 1.5% tax · 5.0% vac · 8.0% maint · 8.0% mgmt
Financing live
Cash to close
- Down payment
- $47,500
- Closing costs
- $5,700
- Reserves months
- —
- Total cash needed
- —
Loan-product check · same deal, 3 products live
Conventional
25% down · 7.5% · 30yr
- Down + closing
- —
- Monthly P&I
- —
- Monthly cashflow
- —
- DSCR
- —
- Eligible?
- —
Personal DTI + credit; lowest rate.
DSCR
20% down · 8.5% · 30yr
- Down + closing
- —
- Monthly P&I
- —
- Monthly cashflow
- —
- DSCR
- —
- Eligible?
- —
No personal income docs; deal must DSCR.
Hard money
10% down · 12.0% · 12mo
- Down + closing
- —
- Monthly P&I
- —
- Monthly cashflow
- —
- DSCR
- —
- Eligible?
- —
Short-term bridge; refi at stabilization.
Rent comps 4 comps
| Address | Beds | Baths | Sqft | Rent | $/sqft | DOM | Units | Dist |
|---|---|---|---|---|---|---|---|---|
| 204 Wild Strawberry Ln Moncks Corner, SC | 4.0 | 2.5 | 2164 | $2,400 | $1.11 | 23d | 1 | 0.23mi |
| 214 Wild Strawberry Ln Moncks Corner, SC | 4.0 | 2.5 | 2164 | $2,495 | $1.15 | 10d | 1 | 0.25mi |
| 214 Wild Strawberry Ln Moncks Corner, SC | 4.0 | 2.5 | 2164 | $2,495 | $1.15 | 14d | 1 | 0.25mi |
| 1081 Moss Grove Dr Moncks Corner, SC | 4.0 | 2.5 | 2556 | $2,356 | $0.92 | 21d | 1 | 0.62mi |
Listing history 20 events
-
2026-06-18days on market $190,000 Active 51 DOM
-
2026-06-17days on market $190,000 Active 50 DOM
-
2026-06-16days on market $190,000 Active 49 DOM
-
2026-06-15days on market $190,000 Active 48 DOM
-
2026-06-13days on market $190,000 Active 46 DOM
-
2026-06-13days on market $190,000 Active 45 DOM
-
2026-06-10days on market $190,000 Active 43 DOM
-
2026-06-09days on market $190,000 Active 42 DOM
-
2026-06-08days on market $190,000 Active 41 DOM
-
2026-06-07days on market $190,000 Active 40 DOM
-
2026-06-05days on market $190,000 Active 37 DOM
-
2026-06-03days on market $190,000 Active 36 DOM
-
2026-06-03days on market $190,000 Active 35 DOM
-
2026-06-01days on market $190,000 Active 34 DOM
-
2026-05-31days on market $190,000 Active 33 DOM
-
2026-04-29status Active
-
2026-04-24historical
-
2026-04-23$190,000 Active
-
2026-04-23historical
-
2026-02-23$225,000 Active
ⓘ Source: listings_history table (triggers on properties + properties_extension) + one-shot
backfill from property_details.listing_events for pre-trigger history.
Nearby sold comps map
Loading sold comps map…
Walkable amenities ~0.75 mi
Loading nearby amenities…
Taxation est. · year 1
- Rental income
- $33,422
- − Mortgage interest
- −$10,643
- − Property taxes
- −$2,850
- − Insurance
- −$950
- − Repairs & maintenance
- −$2,674
- − Management
- −$2,674
- − Depreciation
- −$5,527
- Taxable income
- $8,104
- Est. tax owed @ 24.0%
- −$1,945
- After-tax cash flow
- $8,702/yr
For passive investors: Depreciation is non-cash, so a rental often shows a tax loss while cash-flowing — sheltering income. Rental losses are passive: they offset passive income freely, and up to $25,000/yr can offset ordinary (W-2) income if you actively participate and your MAGI is under $100k (phasing out to $0 by $150k); unused losses carry forward. On sale, claimed depreciation is recaptured at up to 25%, and gains may owe capital-gains tax (a 1031 exchange can defer both). Figures are a year-1 estimate at your 24.0% rate — not tax advice; consult a CPA.
Condition & rehab AI · 12 photos
This property requires extensive repairs and maintenance to bring it up to a livable condition. Immediate attention is needed to address safety and functionality issues.
Repairs flagged
- Major Exposed wiring in kitchen — Safety hazard
- Major Missing cabinets in kitchen — Aesthetic and functionality
- Major Worn fixtures in bathroom — Aesthetic and functionality
- Major Missing cabinet doors in bathroom — Aesthetic and functionality
- Major Overgrown vegetation around property — Safety and aesthetics
- Major Debris in kitchen and bathroom — Safety and aesthetics
Value-add opportunities
- Both Paint interior walls — Enhances aesthetics and value
- Both Replace flooring — Improves functionality and aesthetics
- Both Replace cabinets — Enhances functionality and aesthetics
- Both Fix exposed wiring — Ensures safety and functionality
- Both Replace fixtures — Enhances functionality and aesthetics
- Both Trim vegetation — Enhances aesthetics and safety
Renovation cost estimate screening
| Repair item | Severity | Est. cost |
|---|---|---|
| Exposed wiring in kitchen · Safety hazard | Major | $15,000–50,000 |
| Missing cabinets in kitchen · Aesthetic and functionality | Major | $15,000–50,000 |
| Worn fixtures in bathroom · Aesthetic and functionality | Major | $15,000–50,000 |
| Missing cabinet doors in bathroom · Aesthetic and functionality | Major | $15,000–50,000 |
| Overgrown vegetation around property · Safety and aesthetics | Major | $15,000–50,000 |
| Debris in kitchen and bathroom · Safety and aesthetics | Major | $15,000–50,000 |
| Total estimated repair cost · 6 items | $90,000–300,000 |
Value-add ROI direction
- Both Paint interior walls — Enhances aesthetics and value ↑
- Both Replace flooring — Improves functionality and aesthetics ↑
- Both Replace cabinets — Enhances functionality and aesthetics ↑
- Both Fix exposed wiring — Ensures safety and functionality ↑
- Both Replace fixtures — Enhances functionality and aesthetics ↑
- Both Trim vegetation — Enhances aesthetics and safety ↑
ⓘ Cost ranges are severity-bucket heuristics (US national rule-of-thumb). Get contractor quotes + a written scope before underwriting a rehab budget.
Schools (NCES district)
- District
- Berkeley 01
- NCES district ID
- 4501170
- Math proficiency
- 35% ▼ -8.00%
- Reading proficiency
- 48% ▼ -2.00%
- Median HH income
- $52,724
- Composite
- 35.95/100
- National rank
- #4799
- State rank
- #30 of 80 in SC
Livability — Moncks Corner
- Score
- 67/100
- State rank
- #99
- US rank
- #10812
Category grades
Schools grade is shown separately in the Schools card above.
Census & demographics
- Census place
- Moncks Corner, SC
- County
- Berkeley County · 198,768 people
- City population
- 43,816
- Metro
- Charleston-North Charleston, SC
- Population (ZIP)
- 43,816
- Household income
- $82,666
- Rent vs Own
- Severe rent burden
- 815.0
Population outlook (Berkeley County) Hauer SSP2
- Today (2025)
- 254,184 people
- By 2030
- 279,677 · +10.0%
- By 2040
- 329,379 · +29.6%
- By 2050
- 375,557 · +47.8%
- By 2075
- 476,740 · +87.6%
- By 2100
- 535,945 · +110.8%
Race, ethnicity, and origin ACS 2023
- Neighborhood character
- Majority White (61%)
- Race & ethnicity
- White 61% Black 29% Hispanic / Latino 6% Two or more races 5%
- Hispanic origin (detail)
- Mexican 2% Puerto Rican 2%
- Common ancestry
- Lithuanian 1% Slovak 1% Romanian 1%
- Foreign-born
- 3% · Canada
- Languages at home
- 96% English-only · Spanish 3%
Political lean MEDSL · Berkeley
- 2024 margin
- R (+16.3) · D 41.1% · R 57.4% · Other 1.4%
- 2008→2024 swing
- -3.2pp toward R · 2008: -13.1pp · 2024: -16.3pp
- All cycles
- 2024: R+16.3 2020: R+11.7 2016: R+17.4 2012: R+18.9 2008: R+13.1
Not yet ingested
- Civics
- —
Market trends
- HPI YoY
- ▼ -52.95%
- Current HPI
- 328.7212
- Rent YoY
- ▲ 2.77%
- Metro
- Charleston-North Charleston, SC
- State GDP YoY
- ▲ 4.51%
- F500 in state
- 2
Industry mix (Fortune 500 HQ in SC)
| Industry | F500 HQs | Revenue |
|---|---|---|
| Packaging | 1 | $7B |
|
||
Price history
-15.6% since first listed5 events — show timeline
- 2026-04-29 Relisted — Charleston Trident MLS
- 2026-04-24 Listing Removed — Charleston Trident MLS
- 2026-04-23 Listing Removed — Charleston Trident MLS
- 2026-04-23 Listed $190,000 Charleston Trident MLS
- 2026-02-23 Listed $225,000 Charleston Trident MLS
Cash-flow waterfall
monthlySold comps — $/sqft
last 12 mo · ≤1 miLoading sold comps…