 🏷️ Likely Rental
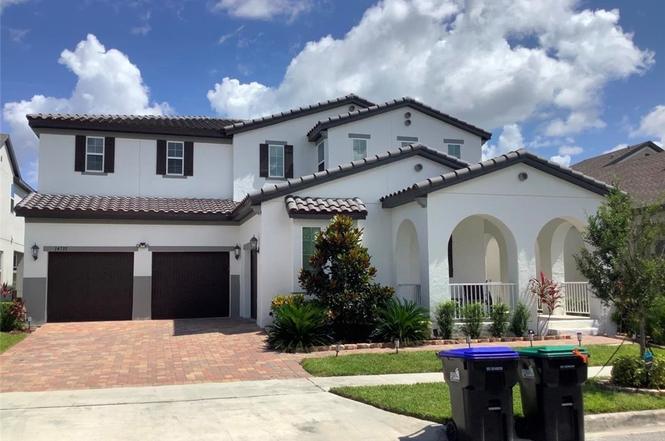
14733 Glade Hill Park Way · Horizon West, FL
Flood risk 1/10 · Minimal
- FEMA flood zone
- X (unshaded)
- Chance of flooding over 30 yrs
- 0.0%
- Est. flood insurance / yr
- $507 – $1,088
Fire risk 5/10 · Moderate
- Est. fire insurance / yr
- $947 – $1,759
Heat risk 9/10 · Severe
- Hot days now (above 108°F)
- 7 days/yr
- Hot days in 30 yrs
- 24 days/yr
Wind risk 9/10 · Severe
- Chance of severe wind over 30 yrs
- 99.0%
Air-quality risk 1/10 · Minimal
- Unhealthy air days now
- 0 days/yr
- Unhealthy air days in 30 yrs
- 0 days/yr
Risk factors via First Street. Map © Google.
Why this score? — see what drove the D+ grade
The composite is a weighted blend of 9 inputs, each scored 0–100. Each bar is that input's sub-score; the figure is the points it added to the 100-point composite (weight × sub-score).
- Cash flow +15.0/30.0
- ARV discount +7.5/15.0
- 1% rule +5.0/10.0
- DSCR +5.0/10.0
- Schools +4.1/10.0
- Livability +3.6/5.0
- Rent growth +2.8/5.0
- Condition / age +2.5/5.0
- Appreciation +0.0/10.0
$5,000
🖨 Deal sheet 📄 Offer letter ✓ Due diligence
Listing remarks MLS
Brand NEW energy-efficient home ready NOW! The Canne's gourmet kitchen boasts stainless steel appliances with built-in double ovens, walk-in pantry and a large eat-in island. The flex space can be converted into a hobby room or home office. The covered lanai offers a pool bath. Make every day feel like a vacation day in this incredible Watermark community. Enjoy fireworks from the clubhouse viewing deck, a few sets of tennis or a summer afternoon at the community's resort-style swimming pool. Known for their energy-efficient features, our homes help you live a healthier and quieter lifestyle while saving you thousands of dollars on utility bills.
Key facts
- 7,405 sq ft lot
- 3 garage spots
- Built 2019
Property features AI
Exterior
- Parking: Three parking spaces total; Three-car garage
- Utilities: Other water source; Other sewer
- Home design: Residential single-family home; Two levels; Planned Development (P-D) zoning
- Construction: Construction details: see remarks
- Exterior features: Front porch; Other roof
Interior
- Flooring: Other
- Bathrooms: Four full bathrooms
- Heating & cooling: No heating; No cooling
- Interior features: Front porch; Other flooring
Neighborhood map
What this means for you Summary
Snapshot
- This is a 4-bed/4.0-bath single-family listed at $5k.
Deal economics
- At list price, monthly cash flow is $4k ($46k/yr) — positive.
- The deal already cash-flows at list — no discount required.
- Meets the 1% rule at list price ($5k rent vs $5k).
- Cap rate 920.3% vs local median 2.8% in Horizon West — top-decile yield for the area; either an underpriced asset or a hidden risk that comps aren't pricing in. Stress-test before assuming the spread holds.
Location & tenants
- Location reads 72/100 on livability (#362 in FL) — a middle-class / working-renter tenant base. Strengths: crime A+, employment A+, housing A+; Watch: schools C-, amenities F, commute F.
- Orange (suburban): math 46% / reading 51% proficiency, ranked #43 of 73 in FL (top 59%) — families likely to look elsewhere, expect single-tenant / working-renter base with shorter leases.
- Market conditions: Rents rising (+1.1%/yr); 1581 active listings in the ZIP; 7 comparable units currently listed for rent nearby; rentals leasing fast (median 8d on market — plan ~1-2 weeks tenant-placement turnaround); high-income renter base; 8,053 units permitted in Orange County in 2024 (3,133 in 5+ unit buildings).
- At $4,864/mo this rent would consume 48% of the median local household income ($120k/yr) (locally 2682% of renters already pay >50% of income on rent) — very limited rent-growth headroom before tenants either downsize or default.
Forward outlook
- Local home prices are declining (-3.0%/yr); year-one equity from $35 of loan paydown is wiped out by about $150 of value loss. Plan a longer hold.
- Orange County population projected at +52% by 2050 — long-run rental-demand tailwind backs the buy-and-hold thesis.
- At projected returns (-3.0% appreciation + 1.1% rent growth), your $1k cash investment doubles in ~1 year — after that, you're playing with house money.
Negotiation context
- Only 2 days on market — expect competitive offers; lowballing is unlikely to land.
- 4 sale attempts since 7y ago with the ask held roughly flat each time — persistent listings suggest the price (not the market) is what's stuck; bring a comps-based counter.
Risks & watch-outs
- Climate carrying-cost: severe wind risk, 99% chance of damaging wind over 30y; moderate wildfire risk; extreme-heat days projected 7→24/yr by 2055 (HVAC capex compounding) — expect insurance premiums to compound above CPI over the hold.
Questions for the listing agent
- Is there a deadline driving the sale (1031 exchange, divorce, estate, relocation)? That informs how much negotiation room exists.
- The area grade is low — what's the realistic commute time and amenity access for the typical tenant pool here? Any planned neighborhood developments (good or bad) we should know about?
- What's the average days-on-market for RENTAL listings here right now (not sales)? A rising rental-DOM trend means longer vacancies and softer asking-rent achievability than the comps imply.
- What's the recent tenant-quality profile in this submarket — average credit score on applications, eviction rate, late-payment / NSF rate, and stable-employment percentage? A property-management company in the area should have these aggregated.
- How much new for-sale + rental construction is in the pipeline within 1–3 miles? Heavy new supply typically softens prices + rents 12–24 months out; constrained supply supports both.
Investment metrics
- 1% rule
- 97.29% ✓
- Cap rate
- 920.27%
- Cash-on-cash
- 3264.19%
- DSCR
- 146.24
- GRM
- 0.1
CMA / ARV
- ARV (on-the-fly)
- $1,181,643
- Comps found
- 2
Show comp detail 2 sales within ~0.75 mi
| Address | Dist | Beds/Ba | Sqft | Sold | Price | $/sf | Match |
|---|---|---|---|---|---|---|---|
| 14758 Seton Creek Blvd | 0.14mi | 5/4.0 (+1) | 3,408 (-12%) | 3mo | $840,000 | $246 | 67 |
| 15576 Shorebird Ln | 0.65mi | 5/4.5 (+1) | 3,892 (+1%) | 9mo | $1,195,000 | $307 | 53 |
Match score weights: distance 35% · size 25% · config 20% · recency 20%. Top-matched comps best support the ARV.
Projected returns pro-forma
-3.0% appreciation · 1.13% rent growth · sell at horizon
- IRR
- —
- Equity multiple
- 167.30×
- Total profit
- $232,826
- Equity at exit
- $746
- IRR
- —
- Equity multiple
- 343.75×
- Total profit
- $479,847
- Equity at exit
- $432
Cash invested: $1,400 (down + closing). Projections, not guarantees.
Landlord ↔ Tenant lean methodology
- Overall (STATE)
- 87 Strongly Landlord-Friendly
- State Florida
- 87 Strongly Landlord-Friendly · R+3
- County
- — inherits STATE
- City
- — inherits STATE
ZIP-level market 34787
- Rents YoY
- 1.1%
- Active inventory
- 1581
- Price-to-rent
- 0.1×
Monthly cashflow live
- Estimated rent
- $4,864 high interval (Pro) →
- Mortgage (P&I)
- −$26
- Tax est. 1.5%
- −$6 /mo · $75/yr
- Insurance
- −$2
- HOA
- −$0
- Vacancy / Maint / Mgmt
- −$1,021
- Net cashflow
- $3,808
Break-even live
UW: 25.0% down · 7.5% · 30yr · 1.5% tax · 5.0% vac · 8.0% maint · 8.0% mgmt
Financing live
Cash to close
- Down payment
- $1,250
- Closing costs
- $150
- Reserves months
- —
- Total cash needed
- —
Loan-product check · same deal, 3 products live
Conventional
25% down · 7.5% · 30yr
- Down + closing
- —
- Monthly P&I
- —
- Monthly cashflow
- —
- DSCR
- —
- Eligible?
- —
Personal DTI + credit; lowest rate.
DSCR
20% down · 8.5% · 30yr
- Down + closing
- —
- Monthly P&I
- —
- Monthly cashflow
- —
- DSCR
- —
- Eligible?
- —
No personal income docs; deal must DSCR.
Hard money
10% down · 12.0% · 12mo
- Down + closing
- —
- Monthly P&I
- —
- Monthly cashflow
- —
- DSCR
- —
- Eligible?
- —
Short-term bridge; refi at stabilization.
Rent comps 7 comps
| Address | Beds | Baths | Sqft | Rent | $/sqft | DOM | Units | Dist |
|---|---|---|---|---|---|---|---|---|
| 14612 Glade Hill Park Way Winter Garden, FL | 5.0 | 4.5 | 3892 | $5,900 | $1.52 | 14d | 1 | 0.23mi |
| 9240 Woodcrane Dr Winter Garden, FL | 5.0 | 4.0 | 3760 | $4,799 | $1.28 | 7d | 1 | 0.25mi |
| 15060 Marbled Godwit Dr Winter Garden, FL | 4.0 | 3.0 | 2700 | $3,200 | $1.19 | 4d | 1 | 0.91mi |
| 15060 Marbled Godwit Dr Winter Garden, FL | 4.0 | 3.0 | 2706 | $3,200 | $1.18 | 17d | 1 | 0.91mi |
| 8222 Topsail Pl Winter Garden, FL | 5.0 | 4.5 | 4199 | $6,250 | $1.49 | 4d | 1 | 1.00mi |
| 15617 Marina Bay Dr Winter Garden, FL | 4.0 | 4.5 | 3127 | $4,300 | $1.38 | 4d | 1 | 1.08mi |
| 15704 Marina Bay Dr Winter Garden, FL | 5.0 | 5.5 | 5005 | $11,500 | $2.30 | 23d | 1 | 1.25mi |
Listing history 3 events
-
2026-06-18days on market $5,000 Active 2 DOM
-
2026-06-17remarks 301-char remark
-
2026-06-17$5,000 Active 1 DOM
ⓘ Source: listings_history table (triggers on properties + properties_extension) + one-shot
backfill from property_details.listing_events for pre-trigger history.
Climate risk First Street
- Flood 1/10 Low FEMA zone X (unshaded) · 0% chance over 30 yrs
- Wildfire 5/10 Major
- Heat 9/10 Extreme 7 d/yr ≥108°F today · 24 d/yr by 30 yrs out
- Wind 9/10 Extreme 99% chance of damaging wind over 30 yrs
- Air quality 1/10 Low 0 unhealthy d/yr today · 0 by 30 yrs out
Nearby sold comps map
Loading sold comps map…
Walkable amenities ~0.75 mi
Loading nearby amenities…
Taxation est. · year 1
- Rental income
- $58,371
- − Mortgage interest
- −$280
- − Property taxes
- −$75
- − Insurance
- −$25
- − Repairs & maintenance
- −$4,670
- − Management
- −$4,670
- − Depreciation
- −$145
- Taxable income
- $48,506
- Est. tax owed @ 24.0%
- −$11,642
- After-tax cash flow
- $34,057/yr
For passive investors: Depreciation is non-cash, so a rental often shows a tax loss while cash-flowing — sheltering income. Rental losses are passive: they offset passive income freely, and up to $25,000/yr can offset ordinary (W-2) income if you actively participate and your MAGI is under $100k (phasing out to $0 by $150k); unused losses carry forward. On sale, claimed depreciation is recaptured at up to 25%, and gains may owe capital-gains tax (a 1031 exchange can defer both). Figures are a year-1 estimate at your 24.0% rate — not tax advice; consult a CPA.
Schools (NCES district)
- District
- Orange
- NCES district ID
- 1201440
- Math proficiency
- 46% ▼ -9.00%
- Reading proficiency
- 51% ▼ -2.00%
- Median HH income
- $49,350
- Composite
- 41.47/100
- National rank
- #3461
- State rank
- #43 of 73 in FL
Livability — Horizon West
- Score
- 72/100
- State rank
- #362
- US rank
- #6364
Category grades
Schools grade is shown separately in the Schools card above.
Census & demographics
- Census place
- Horizon West, FL
- County
- Orange County · 1,471,359 people
- City population
- 93,064
- Metro
- Orlando-Kissimmee-Sanford, FL
- Population (ZIP)
- 101,441
- Household income
- $120,365
- Rent vs Own
- Severe rent burden
- 2682.0
Population outlook (Orange County) Hauer SSP2
- Today (2025)
- 1,618,226 people
- By 2030
- 1,787,404 · +10.5%
- By 2040
- 2,125,621 · +31.4%
- By 2050
- 2,454,016 · +51.6%
- By 2075
- 3,173,711 · +96.1%
- By 2100
- 3,607,781 · +122.9%
Race, ethnicity, and origin ACS 2023
- Neighborhood character
- Diverse neighborhood (Simpson 0.65)
- Race & ethnicity
- White 53% Hispanic / Latino 23% Two or more races 21% Black 9% Asian 6%
- Hispanic origin (detail)
- Mexican 4% Puerto Rican 7% Cuban 1%
- Common ancestry
- Estonian 4% Romanian 2% Lithuanian 2%
- Foreign-born
- 20% · Canada, Jamaica, China
- Languages at home
- 74% English-only · Spanish 13% Other Indo-European 8% Vietnamese 1%
Political lean MEDSL · Orange
- 2024 margin
- D (+13.6) · D 56.1% · R 42.5% · Other 1.3%
- 2008→2024 swing
- -5.0pp toward R · 2008: 18.6pp · 2024: 13.6pp
- All cycles
- 2024: D+13.6 2020: D+23.1 2016: D+24.6 2012: D+18.2 2008: D+18.6
Not yet ingested
- Civics
- —
Market trends
- HPI YoY
- ▼ -189.49%
- Current HPI
- 296.8866
- Rent YoY
- ▲ 1.13%
- Metro
- Orlando-Kissimmee-Sanford, FL
- State GDP YoY
- ▲ 3.28%
- F500 in state
- 36
Industry mix (Fortune 500 HQ in FL)
| Industry | F500 HQs | Revenue |
|---|---|---|
| Industrial Technology | 2 | $29B |
|
||
| Insurance | 2 | $17B |
|
||
| Retail | 1 | $60B |
|
||
| Technology Distribution | 1 | $58B |
|
||
| Homebuilding | 1 | $35B |
|
||
| Technology Manufacturing | 1 | $35B |
|
||
Price history
-99.2% since first listed7 events — show timeline
- 2026-06-16 Listed $5,000 HAOR as distributed by MLS GRID
- 2021-10-04 Relisted — Stellar MLS as Distributed by MLS Grid
- 2021-08-13 Listed $998,000 Stellar MLS as Distributed by MLS Grid
- 2020-01-06 Sold (MLS) $570,000 Stellar MLS as Distributed by MLS Grid
- 2019-11-18 Pending — Stellar MLS as Distributed by MLS Grid
- 2019-05-21 Price Changed $598,734 Stellar MLS as Distributed by MLS Grid
- 2019-04-09 Listed $596,734 Stellar MLS as Distributed by MLS Grid
Property tax history
+34.4%/yrLatest (2025): $12,932 · +7.9% YoY. Source: county tax records.
Cash-flow waterfall
monthlySold comps — $/sqft
last 12 mo · ≤1 miLoading sold comps…