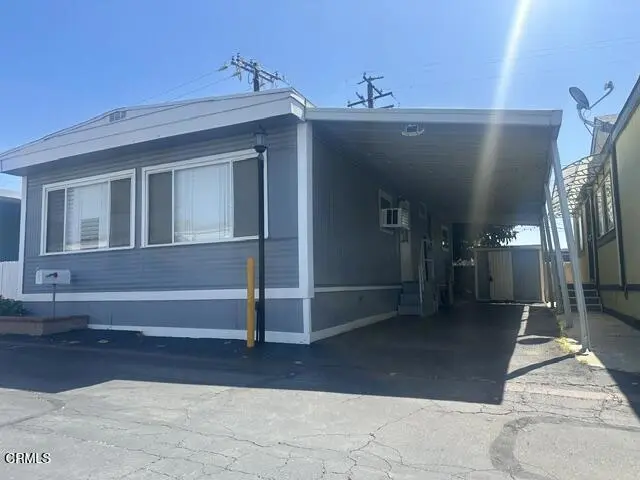
716 N Grand Ave Unit J4 · Covina, CA
Flood risk 1/10 · Minimal
- FEMA flood zone
- X (unshaded)
- Chance of flooding over 30 yrs
- 0.0%
- Est. flood insurance / yr
- $507 – $1,088
Fire risk 5/10 · Moderate
- Est. fire insurance / yr
- $659 – $1,223
Heat risk 7/10 · Major
- Hot days now (above 98°F)
- 7 days/yr
- Hot days in 30 yrs
- 20 days/yr
Wind risk 1/10 · Minimal
- Chance of severe wind over 30 yrs
- —
Air-quality risk 7/10 · Major
- Unhealthy air days now
- 15 days/yr
- Unhealthy air days in 30 yrs
- 17 days/yr
Risk factors via First Street. Map © Google.
Why this score? — see what drove the B+ grade
The composite is a weighted blend of 9 inputs, each scored 0–100. Each bar is that input's sub-score; the figure is the points it added to the 100-point composite (weight × sub-score).
- Cash flow +30.0/30.0
- ARV discount +15.0/15.0
- 1% rule +10.0/10.0
- DSCR +10.0/10.0
- Schools +4.7/10.0
- Condition / age +4.0/5.0
- Livability +3.6/5.0
- Rent growth +2.5/5.0
- Appreciation +0.0/10.0
$65,000
🖨 Deal sheet 📄 Offer letter ✓ Due diligence
Listing remarks
Cozy mobile home, ready move-in condition near all shopping areas, freeways, schools and parks. Club house and pool for hot summer days.
Key facts
- Freeways
- Club house
- Pool
Tags
Property features AI
Finance
- Other: Pets allowed: contact for details
- Financial info: Land lease: $1,650 per month (current); Rent includes gas, electric, water, sewer, trash — all utilities included
- HOA & community: Land lease in park; Park name: Mobile Aire Estates; Community features include storm drains
Exterior
- Parking: Carport with 2 parking spaces; Located in Mobile Aire Estates park
- Utilities: 220V electric throughout; Public/district water; Public sewer; Sewer connected; electricity available
- Home design: Manufactured/mobile home (20' x 40'); Mobile home remains
- Construction: Metal construction
- Exterior features: Patio; Vinyl fencing; No pool; Siding skirting
Interior
- Kitchen: No appliances included
- Bathrooms: One full bathroom with exhaust fan
- Heating & cooling: Heating available; Cooling available
- Interior features: One-level home; Enter off Edna Place past the car wash
- Laundry & utility: Inside laundry; All utilities included with rent (gas, electric, water, sewer, trash)
Neighborhood map
What this means for you Summary
Snapshot
- This is a 2-bed/1.0-bath manufactured listed at $65k. Condition is rated good.
Deal economics
- At list price, monthly cash flow is $1k ($17k/yr) — positive.
- The deal already cash-flows at list — no discount required.
- Meets the 1% rule at list price ($2k rent vs $65k).
- Recommended offer: $63k (3.0% below list) — sets the bar for market timing.
- Cap rate 32.3% vs local median 2.4% in Covina — top-decile yield for the area; either an underpriced asset or a hidden risk that comps aren't pricing in. Stress-test before assuming the spread holds.
Location & tenants
- Location reads 72/100 on livability (#181 in CA) — a middle-class / working-renter tenant base. Strengths: amenities A+, commute A+, employment A+; Watch: schools C-, crime C-, health & safety C-.
- Charter Oak Unified (suburban): math 45% / reading 55% proficiency, ranked #387 of 1,400 in CA (top 28%) — acceptable for families but not a draw, mixed tenant base, ~2y average lease.
- Market conditions: 66 active listings in the ZIP; 36 comparable units currently listed for rent nearby; rentals leasing fast (median 13d on market — plan ~1-2 weeks tenant-placement turnaround); solid renter incomes; 19,697 units permitted in Los Angeles County in 2024 (9,426 in 5+ unit buildings).
Forward outlook
- Local home prices are declining (-3.0%/yr); year-one equity from $449 of loan paydown is wiped out by about $2k of value loss. Plan a longer hold.
- Los Angeles County population projected at +9% by 2050 — modest demand growth; plan on rents tracking national, not racing it.
- At projected returns (-3.0% appreciation + 3.0% rent growth), your $18k cash investment doubles in ~2 years — after that, you're playing with house money.
Negotiation context
- It's been on market 36 days — a 3% lower offer ($63k) is reasonable based on typical stale-listing flexibility.
- 4 sale attempts with the ask held roughly flat each time — persistent listings suggest the price (not the market) is what's stuck; bring a comps-based counter.
Risks & watch-outs
- Watch-outs: built in 1957 — expect roof / HVAC / electrical / plumbing capex.
- Climate carrying-cost: moderate wildfire risk; extreme-heat days projected 7→20/yr by 2055 (HVAC capex compounding) — expect insurance premiums to compound above CPI over the hold.
Questions for the listing agent
- It's been on market 36 days. Have you received any prior offers? Is the seller open to a 3% concession, seller financing, or rate buy-down credit?
- Built in 1957 — when were the roof, HVAC, electrical panel, plumbing, and water heater last replaced?
- Is there a deadline driving the sale (1031 exchange, divorce, estate, relocation)? That informs how much negotiation room exists.
- What's the average days-on-market for RENTAL listings here right now (not sales)? A rising rental-DOM trend means longer vacancies and softer asking-rent achievability than the comps imply.
- What's the recent tenant-quality profile in this submarket — average credit score on applications, eviction rate, late-payment / NSF rate, and stable-employment percentage? A property-management company in the area should have these aggregated.
- How much new for-sale + rental construction is in the pipeline within 1–3 miles? Heavy new supply typically softens prices + rents 12–24 months out; constrained supply supports both.
Investment metrics
- 1% rule
- 3.62% ✓
- Cap rate
- 32.33%
- Cash-on-cash
- 92.98%
- DSCR
- 5.14
- GRM
- 2.3
CMA / ARV
- ARV (median comp)
- $127,364
- List price
- $65,000
- Delta
- -48.97%
- Verdict
- UNDERPRICED
- Comps
- 8 within 1.0 mi
Show comp detail 2 sales within ~0.75 mi
| Address | Dist | Beds/Ba | Sqft | Sold | Price | $/sf | Match |
|---|---|---|---|---|---|---|---|
| 716 N Grand Ave | 0.03mi | 2/1.0 | 725 (-9%) | 20mo | $127,000 | $175 | 67 |
| 716 North Grand Ave Unit J13 | 0.03mi | 3/2.0 (+1) | 880 (+10%) | 16mo | $150,000 | $170 | 59 |
Match score weights: distance 35% · size 25% · config 20% · recency 20%. Top-matched comps best support the ARV.
Projected returns pro-forma
-3.0% appreciation · 3.0% rent growth · sell at horizon
- IRR
- 93.8%
- Equity multiple
- 5.36×
- Total profit
- $79,316
- Equity at exit
- $9,692
- IRR
- 96.6%
- Equity multiple
- 11.16×
- Total profit
- $184,859
- Equity at exit
- $5,620
Cash invested: $18,200 (down + closing). Projections, not guarantees.
Landlord ↔ Tenant lean methodology
- Overall (STATE)
- 18 Strongly Tenant-Friendly
- State California
- 18 Strongly Tenant-Friendly · D+13
- County
- — inherits STATE
- City
- — inherits STATE
ZIP-level market 91724
- Active inventory
- 66
- Price-to-rent
- 2.3×
Monthly cashflow live
- Estimated rent
- $2,354 high interval (Pro) →
- Mortgage (P&I)
- −$341
- Tax est. 1.5%
- −$81 /mo · $975/yr
- Insurance
- −$27
- HOA
- −$0
- Vacancy / Maint / Mgmt
- −$494
- Net cashflow
- $1,410
Break-even live
UW: 25.0% down · 7.5% · 30yr · 1.5% tax · 5.0% vac · 8.0% maint · 8.0% mgmt
Financing live
Cash to close
- Down payment
- $16,250
- Closing costs
- $1,950
- Reserves months
- —
- Total cash needed
- —
Loan-product check · same deal, 3 products live
Conventional
25% down · 7.5% · 30yr
- Down + closing
- —
- Monthly P&I
- —
- Monthly cashflow
- —
- DSCR
- —
- Eligible?
- —
Personal DTI + credit; lowest rate.
DSCR
20% down · 8.5% · 30yr
- Down + closing
- —
- Monthly P&I
- —
- Monthly cashflow
- —
- DSCR
- —
- Eligible?
- —
No personal income docs; deal must DSCR.
Hard money
10% down · 12.0% · 12mo
- Down + closing
- —
- Monthly P&I
- —
- Monthly cashflow
- —
- DSCR
- —
- Eligible?
- —
Short-term bridge; refi at stabilization.
Rent comps 36 comps
| Address | Beds | Baths | Sqft | Rent | $/sqft | DOM | Units | Dist |
|---|---|---|---|---|---|---|---|---|
| 367 N Prospero Dr Covina, CA | 2.0 | 2.0 | 1000 | $1,950 | $1.95 | 7d | 1 | 0.51mi |
| 554 E Hurst St Unit 2 Covina, CA | 2.0 | 1.0 | 866 | $2,650 | $3.06 | 5d | 1 | 0.52mi |
| 628 E Italia St Unit 3 Covina, CA | 2.0 | 1.5 | 900 | $1,850 | $2.06 | 7d | 1 | 0.54mi |
| 826 N Barranca Ave Covina, CA | 1.0–2.0 | 1.0–2.0 | 762 | $2,295 | $3.01 | 43d | 2 | 0.57mi |
| 501 E Hurst St Unit 2 Covina, CA | 2.0 | 1.0 | 866 | $1,900 | $2.19 | 2d | 1 | 0.59mi |
| 19531 E Cienega Ave Unit 208 Covina, CA | 2.0 | 2.0 | 850 | $2,195 | $2.58 | 18d | 1 | 0.72mi |
| 111 S Barranca Ave Covina, CA | 1.0 | 1.0 | 687 | $2,035 | $2.96 | 43d | 1 | 0.78mi |
| 111 S Barranca Ave Covina, CA | 2.0 | 1.0 | 957 | $2,445 | $2.55 | 13d | 1 | 0.78mi |
| 111 S Barranca Ave Covina, CA | 1.0 | 1.0 | 687 | $2,035 | $2.96 | 15d | 1 | 0.78mi |
| 111 S Barranca Ave Covina, CA | 1.0 | 1.0 | 687 | $2,195 | $3.20 | 3d | 1 | 0.78mi |
| 1400 N Grand Ave Covina, CA | 1.0–2.0 | 1.0–2.0 | 846 | $2,720 | $3.22 | 1d | 5 | 0.83mi |
| 364 E Badillo St Unit 368 1/2 Covina, CA | 1.0 | 1.0 | 592 | $1,725 | $2.91 | 1d | 1 | 0.90mi |
| 364 E Badillo St Unit 372 Covina, CA | 1.0 | 1.0 | 592 | $1,750 | $2.96 | 12d | 1 | 0.90mi |
| 445 E Puente St Covina, CA | 2.0 | 1.0 | 992 | $2,900 | $2.92 | 20d | 1 | 0.96mi |
| 321 S San Jose Ave Covina, CA | 2.0 | 2.0 | 1090 | $2,595 | $2.38 | 16d | 2 | 0.99mi |
| 255 E Center St Covina, CA | 1.0 | 1.0 | 625 | $2,195 | $3.51 | 7d | 1 | 1.03mi |
| 253 E Center St Covina, CA | 1.0 | 1.0 | 625 | $2,295 | $3.67 | 7d | 1 | 1.05mi |
| 707 N Park Ave Covina, CA | 2.0 | 2.0 | 900 | $2,900 | $3.22 | 43d | 1 | 1.06mi |
| 320 S 1st Ave Covina, CA | 2.0 | 2.0 | 1090 | $2,595 | $2.38 | 17d | 1 | 1.07mi |
| 18421 E Cypress St Covina, CA | 1.0 | 1.0 | 800 | $2,500 | $3.12 | 43d | 1 | 1.17mi |
| 532 Stewart Dr Covina, CA | 2.0 | 1.0 | 800 | $2,600 | $3.25 | 7d | 1 | 1.17mi |
| 265 E Navilla Pl Unit 206 Covina, CA | 1.0 | 1.0 | 750 | $1,695 | $2.26 | 24d | 1 | 1.18mi |
| 228 E Puente St Unit 230 Covina, CA | 2.0 | 1.0 | 1080 | $2,550 | $2.36 | 16d | 1 | 1.18mi |
| 1632 S Glendora Ave Glendora, CA | 3.0 | 2.0 | 1000 | $3,200 | $3.20 | 6d | 1 | 1.18mi |
| 136 W Orange St Covina, CA | 1.0 | 1.0 | 650 | $2,200 | $3.38 | 24d | 1 | 1.20mi |
| 242 E Navilla Pl Unit 248 Covina, CA | 1.0 | 1.0 | 650 | $1,695 | $2.61 | 21d | 1 | 1.22mi |
| 248 E Navilla Pl Covina, CA | 1.0 | 1.0 | 650 | $1,695 | $2.61 | 24d | 1 | 1.22mi |
| 200 N Grand Ave West Covina, CA | 1.0–3.0 | 1.0–2.0 | 860 | $2,942 | $3.42 | 1d | 12 | 1.25mi |
| 18645 E Arrow Hwy Covina, CA | 2.0 | — | 919 | $2,129 | $2.32 | 13d | 1 | 1.37mi |
| 681 S 1st Ave Apt N Covina, CA | 1.0 | 1.0 | 650 | $1,750 | $2.69 | 43d | 1 | 1.38mi |
| 440 W Gladstone St Glendora, CA | 1.0–2.0 | 1.0–2.0 | 875 | $2,390 | $2.73 | 1d | 9 | 1.38mi |
| 18537 E Arrow Hwy Covina, CA | 1.0–2.0 | 1.0–2.5 | 937 | $2,650 | $2.83 | 4d | 7 | 1.39mi |
| 18615 E Arrow Hwy Covina, CA | 1.0 | 1.0 | 619 | $1,976 | $3.19 | 10d | 2 | 1.39mi |
| 1145 N Barston Ave Covina, CA | 2.0 | 1.0 | 836 | $2,300 | $2.75 | 7d | 1 | 1.40mi |
| 670 S 2nd Ave Covina, CA | 2.0 | 1.0 | 700 | $2,495 | $3.56 | 43d | 1 | 1.43mi |
| 20983 E Covina Blvd Covina, CA | 2.0 | 2.0 | 962 | $2,500 | $2.60 | 24d | 1 | 1.46mi |
Listing history 23 events
-
2026-06-18days on market $65,000 Active 36 DOM
-
2026-06-17days on market $65,000 Active 35 DOM
-
2026-06-16days on market $65,000 Active 34 DOM
-
2026-06-15days on market $65,000 Active 33 DOM
-
2026-06-09days on market $65,000 Active 32 DOM
-
2026-06-08days on market $65,000 Active 31 DOM
-
2026-06-07days on market $65,000 Active 30 DOM
-
2026-06-04days on market $65,000 Active 27 DOM
-
2026-06-03days on market $65,000 Active 26 DOM
-
2026-06-02days on market $65,000 Active 25 DOM
-
2026-06-01days on market $65,000 Active 24 DOM
-
2026-05-31days on market $65,000 Active 23 DOM
-
2026-05-08$65,000 Active 136-char remark
-
2026-03-02historical
-
2026-02-13$64,900 Active
-
2026-02-10historical
-
2026-01-24price $65,900
-
2026-01-20price $68,900
-
2026-01-14price $79,950
-
2026-01-07price $80,900
-
2025-12-17price $85,500
-
2025-12-08price $92,500
-
2025-11-26$119,900 Active
ⓘ Source: listings_history table (triggers on properties + properties_extension) + one-shot
backfill from property_details.listing_events for pre-trigger history.
Climate risk First Street
- Flood 1/10 Low FEMA zone X (unshaded) · 0% chance over 30 yrs
- Wildfire 5/10 Major
- Heat 7/10 Severe 7 d/yr ≥98°F today · 20 d/yr by 30 yrs out
- Wind 1/10 Low
- Air quality 7/10 Severe 15 unhealthy d/yr today · 17 by 30 yrs out
Nearby sold comps map
Loading sold comps map…
Walkable amenities ~0.75 mi
Loading nearby amenities…
Taxation est. · year 1
- Rental income
- $28,243
- − Mortgage interest
- −$3,641
- − Property taxes
- −$975
- − Insurance
- −$325
- − Repairs & maintenance
- −$2,259
- − Management
- −$2,259
- − Depreciation
- −$1,891
- Taxable income
- $16,892
- Est. tax owed @ 24.0%
- −$4,054
- After-tax cash flow
- $12,868/yr
For passive investors: Depreciation is non-cash, so a rental often shows a tax loss while cash-flowing — sheltering income. Rental losses are passive: they offset passive income freely, and up to $25,000/yr can offset ordinary (W-2) income if you actively participate and your MAGI is under $100k (phasing out to $0 by $150k); unused losses carry forward. On sale, claimed depreciation is recaptured at up to 25%, and gains may owe capital-gains tax (a 1031 exchange can defer both). Figures are a year-1 estimate at your 24.0% rate — not tax advice; consult a CPA.
Condition & rehab AI · 8 photos
This mobile home is in good condition with minimal repairs needed. It is move-in ready and has potential for further value increases through cosmetic upgrades and improvements.
Value-add opportunities
- Both Painting exterior and interior walls — Fresh paint enhances curb appeal and interior aesthetics
- Both Landscaping and curb appeal improvements — Enhances curb appeal and can attract more buyers
- Resale Upgrading kitchen appliances — Modern appliances can increase the home's appeal to potential buyers
- Resale Upgrading bathrooms with modern fixtures — Modern bathrooms can significantly increase the home's value
- Both Upgrading HVAC system — A new HVAC system can improve comfort and energy efficiency
Renovation cost estimate screening
Value-add ROI direction
- Both Painting exterior and interior walls — Fresh paint enhances curb appeal and interior aesthetics ↑
- Both Landscaping and curb appeal improvements — Enhances curb appeal and can attract more buyers ↑
- Resale Upgrading kitchen appliances — Modern appliances can increase the home's appeal to potential buyers ↑
- Resale Upgrading bathrooms with modern fixtures — Modern bathrooms can significantly increase the home's value ↑
- Both Upgrading HVAC system — A new HVAC system can improve comfort and energy efficiency ↑
ⓘ Cost ranges are severity-bucket heuristics (US national rule-of-thumb). Get contractor quotes + a written scope before underwriting a rehab budget.
Schools (NCES district)
- District
- Charter Oak Unified
- NCES district ID
- 0608190
- Math proficiency
- 45% ▲ 2.00%
- Reading proficiency
- 55% ▲ 4.00%
- Median HH income
- $72,756
- Composite
- 46.95/100
- National rank
- #5160
- State rank
- #387 of 1400 in CA
Livability — Covina
- Score
- 72/100
- State rank
- #181
- US rank
- #5811
Category grades
Schools grade is shown separately in the Schools card above.
Census & demographics
- Census place
- Covina, CA
- County
- Los Angeles County · 9,444,647 people
- City population
- 81,184
- Metro
- Los Angeles-Long Beach-Anaheim, CA
- Population (ZIP)
- 28,352
- Household income
- $103,163
- Rent vs Own
- Severe rent burden
- 550.0
Population outlook (Los Angeles County) Hauer SSP2
- Today (2025)
- 10,940,515 people
- By 2030
- 11,256,481 · +2.9%
- By 2040
- 11,729,929 · +7.2%
- By 2050
- 11,948,407 · +9.2%
- By 2075
- 11,818,114 · +8.0%
- By 2100
- 10,842,928 · -0.9%
Race, ethnicity, and origin ACS 2023
- Neighborhood character
- Diverse neighborhood (Simpson 0.63)
- Race & ethnicity
- Hispanic / Latino 55% White 22% Two or more races 19% Asian 14% Black 5% Native American 2%
- Hispanic origin (detail)
- Mexican 44%
- Common ancestry
- Portuguese 1% Slovak 1% Iranian 1%
- Foreign-born
- 24% · Canada, China, Vietnam
- Languages at home
- 53% English-only · Spanish 33% Chinese 5% Tagalog/Filipino 3%
Political lean MEDSL · Los Angeles
- 2024 margin
- Solid D (+32.9) · D 64.8% · R 31.9% · Other 3.3%
- 2008→2024 swing
- -7.4pp toward R · 2008: 40.4pp · 2024: 32.9pp
- All cycles
- 2024: D+32.9 2020: D+44.2 2016: D+48.0 2012: D+40.0 2008: D+40.4
Not yet ingested
- Civics
- —
Market trends
- HPI YoY
- ▼ -732.51%
- Current HPI
- 370.5956
- Rent YoY
- —
- Metro
- Los Angeles-Long Beach-Anaheim, CA
- State GDP YoY
- ▲ 3.21%
- F500 in state
- 116
Industry mix (Fortune 500 HQ in CA)
| Industry | F500 HQs | Revenue |
|---|---|---|
| Technology | 27 | $1,492B |
|
||
| Financial Services | 3 | $174B |
|
||
| Retail | 3 | $44B |
|
||
| Insurance | 3 | $26B |
|
||
| Media / Entertainment | 2 | $115B |
|
||
| Pharmaceuticals / Biotech | 2 | $62B |
|
||
Price history
-45.8% since first listed13 events — show timeline
- 2026-06-15 Relisted — CRMLS
- 2026-06-10 Listing Removed — CRMLS
- 2026-05-08 Listed $65,000 CRMLS
- 2026-03-02 Listing Removed — CRMLS
- 2026-02-13 Listed $64,900 CRMLS
- 2026-02-10 Listing Removed — CRMLS
- 2026-01-24 Price Changed $65,900 CRMLS
- 2026-01-20 Price Changed $68,900 CRMLS
- 2026-01-14 Price Changed $79,950 CRMLS
- 2026-01-07 Price Changed $80,900 CRMLS
- 2025-12-17 Price Changed $85,500 CRMLS
- 2025-12-08 Price Changed $92,500 CRMLS
- 2025-11-26 Listed $119,900 CRMLS
Cash-flow waterfall
monthlySold comps — $/sqft
last 12 mo · ≤1 miLoading sold comps…