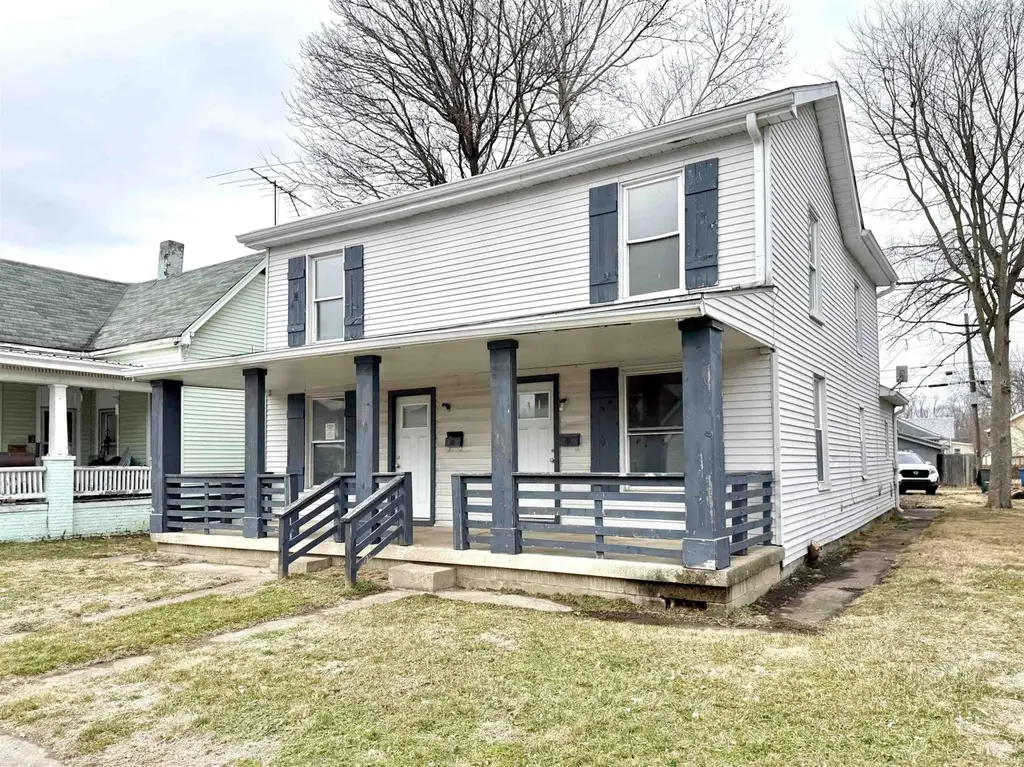
 Duplex
328 E Mechanic St · Shelbyville, IN
Flood risk 6/10 · Moderate
- FEMA flood zone
- X (unshaded)
- Chance of flooding over 30 yrs
- 0.74%
- Est. flood insurance / yr
- $507 – $1,088
Fire risk 1/10 · Minimal
- Est. fire insurance / yr
- $717 – $1,331
Heat risk 4/10 · Minor
- Hot days now (above 102°F)
- 7 days/yr
- Hot days in 30 yrs
- 19 days/yr
Wind risk 2/10 · Minimal
- Chance of severe wind over 30 yrs
- 1.0%
Air-quality risk 2/10 · Minimal
- Unhealthy air days now
- 1 days/yr
- Unhealthy air days in 30 yrs
- 2 days/yr
Risk factors via First Street. Map © Google.
Why this score? — see what drove the B+ grade
The composite is a weighted blend of 9 inputs, each scored 0–100. Each bar is that input's sub-score; the figure is the points it added to the 100-point composite (weight × sub-score).
- Cash flow +30.0/30.0
- ARV discount +15.0/15.0
- 1% rule +10.0/10.0
- DSCR +10.0/10.0
- Schools +3.4/10.0
- Livability +3.2/5.0
- Rent growth +2.5/5.0
- Condition / age +2.5/5.0
- Appreciation +0.0/10.0
$120,000
🖨 Deal sheet 📄 Offer letter ✓ Due diligence
Multi-family units
County records classify this as Multi-Family (2-4 Unit). Listing-text estimate: 2 units. confirmed
Listing remarks MLS
A distinctive opportunity awaits that presents a truly great option for investors and all handy homeowners. This expansive duplex sits on a generous lot and represents a remarkable opportunity to invest in a versatile dwelling with enduring character and significant potential for creating a personalized and rewarding living experience.
Key facts
- 6,000 sq ft lot
- Built 1910
- Listed 62 days
Neighborhood map
What this means for you Summary
Snapshot
- This is a 2 × 2-bed/1.0-bath units multifamily listed at $120k.
Deal economics
- At list price, monthly cash flow is $694 ($8k/yr) — positive. Per door: $347/mo.
- The deal already cash-flows at list — no discount required.
- Meets the 1% rule at list price ($2k rent vs $120k).
- Recommended offer: $113k (6.0% below list) — sets the bar for market timing.
- Cap rate 13.2% vs local median 4.3% in Shelbyville — top-decile yield for the area; either an underpriced asset or a hidden risk that comps aren't pricing in. Stress-test before assuming the spread holds.
Location & tenants
- Location reads 63/100 on livability (#450 in IN) — a middle-class / working-renter tenant base. Strengths: cost of living A+, housing A+, crime B; Watch: employment C-, schools D+, amenities F.
- Shelbyville Central Schools (town): math 40% / reading 39% proficiency, ranked #148 of 301 in IN (top 49%) — families likely to look elsewhere, expect single-tenant / working-renter base with shorter leases.
- Market conditions: 229 active listings in the ZIP; 2 comparable units currently listed for rent nearby; 285 units permitted in Shelby County in 2024 (147 in 5+ unit buildings).
- This rent runs 35% of the median local income ($65k/yr) — at the standard rent-burdened threshold; future hikes will face affordability resistance.
Forward outlook
- Local home prices are declining (-3.0%/yr); year-one equity from $830 of loan paydown is wiped out by about $4k of value loss. Plan a longer hold.
- Shelby County population projected to shrink 6% by 2050 — rents likely to lag national; underwrite the cash flow, not the appreciation.
- At projected returns (-3.0% appreciation + 3.0% rent growth), your $34k cash investment doubles in ~5 years — after that, you're playing with house money.
Negotiation context
- It's been on market 62 days — a 6% lower offer ($113k) is reasonable based on typical stale-listing flexibility.
Risks & watch-outs
- Watch-outs: built in 1910 — expect roof / HVAC / electrical / plumbing capex.
- Climate carrying-cost: major flood risk — expect insurance premiums to compound above CPI over the hold.
Questions for the listing agent
- It's been on market 62 days. Have you received any prior offers? Is the seller open to a 6% concession, seller financing, or rate buy-down credit?
- Can we see the unit-by-unit rent roll, current vacancy, and any below-market leases? What's the average tenancy length?
- What capital expenditures (roof, boiler, parking lot, exteriors) have been made in the last 5 years, and what's planned in the next 2?
- Built in 1910 — when were the roof, HVAC, electrical panel, plumbing, and water heater last replaced?
- Why hasn't it sold? Are there any deal-killer items the seller is aware of (foundation, flood, title, zoning, code violations)?
- Is there a deadline driving the sale (1031 exchange, divorce, estate, relocation)? That informs how much negotiation room exists.
- Schools are D-rated, which usually means shorter tenancies and higher turnover. Who's the typical renter profile here, and what's been the actual vacancy rate?
- What's the average days-on-market for RENTAL listings here right now (not sales)? A rising rental-DOM trend means longer vacancies and softer asking-rent achievability than the comps imply.
- What's the recent tenant-quality profile in this submarket — average credit score on applications, eviction rate, late-payment / NSF rate, and stable-employment percentage? A property-management company in the area should have these aggregated.
- How much new apartment / multifamily construction is in the pipeline within 1–3 miles? Heavy new supply (>2% of stock underway) typically softens rents 12–24 months out; light construction supports rent growth.
Investment metrics
- 1% rule
- 1.57% ✓
- Cap rate
- 13.23%
- Cash-on-cash
- 24.79%
- DSCR
- 2.10
- GRM
- 5.3
CMA / ARV
- ARV (median comp)
- $173,406
- List price
- $120,000
- Delta
- -30.80%
- Verdict
- UNDERPRICED
- Comps
- 4 within 1.0 mi
Projected returns pro-forma
-3.0% appreciation · 3.0% rent growth · sell at horizon
- IRR
- 18.2%
- Equity multiple
- 1.74×
- Total profit
- $24,774
- Equity at exit
- $17,892
- IRR
- 26.6%
- Equity multiple
- 3.34×
- Total profit
- $78,527
- Equity at exit
- $10,375
Cash invested: $33,600 (down + closing). Projections, not guarantees.
Landlord ↔ Tenant lean methodology
- Overall (STATE)
- 90 Strongly Landlord-Friendly
- State Indiana
- 90 Strongly Landlord-Friendly · R+11
- County
- — inherits STATE
- City
- — inherits STATE
ZIP-level market 46176
- Home prices YoY
- -33.9%
- Active inventory
- 229
- Price-to-rent
- 10.6×
Monthly cashflow live
- Estimated rent
- $1,881 high interval (Pro) →
- Mortgage (P&I)
- −$629
- Tax from tax record
- −$112 /mo · $1,350/yr
- Insurance
- −$50
- HOA
- −$0
- Vacancy / Maint / Mgmt
- −$395
- Net cashflow
- $694
Break-even live
2-unit breakdown (identical units grouped — click to expand)
| Units | Beds | Baths | Est. rent |
|---|---|---|---|
| 2× units | 2 | 1 | $1,882 |
| #1 | 2 | 1 | $941 |
| #2 | 2 | 1 | $941 |
| Total (2 units) | $1,881 | ||
UW: 25.0% down · 7.5% · 30yr · 1.5% tax · 5.0% vac · 8.0% maint · 8.0% mgmt
Financing live
Cash to close
- Down payment
- $30,000
- Closing costs
- $3,600
- Reserves months
- —
- Total cash needed
- —
Loan-product check · same deal, 3 products live
Conventional
25% down · 7.5% · 30yr
- Down + closing
- —
- Monthly P&I
- —
- Monthly cashflow
- —
- DSCR
- —
- Eligible?
- —
Personal DTI + credit; lowest rate.
DSCR
20% down · 8.5% · 30yr
- Down + closing
- —
- Monthly P&I
- —
- Monthly cashflow
- —
- DSCR
- —
- Eligible?
- —
No personal income docs; deal must DSCR.
Hard money
10% down · 12.0% · 12mo
- Down + closing
- —
- Monthly P&I
- —
- Monthly cashflow
- —
- DSCR
- —
- Eligible?
- —
Short-term bridge; refi at stabilization.
Rent comps 2 comps
| Address | Beds | Baths | Sqft | Rent | $/sqft | DOM | Units | Dist |
|---|---|---|---|---|---|---|---|---|
| 425 N Harrison St Shelbyville, IN | 3.0 | 1.0–2.0 | 909 | $1,882 | $2.07 | 1d | 7 | 0.45mi |
| 1021 Amos Rd Shelbyville, IN | 3.0 | 1.5 | 1476 | $1,635 | $1.11 | 7d | 1 | 0.98mi |
Listing history 14 events
-
2026-06-18days on market $120,000 Active 62 DOM
-
2026-06-17days on market $120,000 Active 61 DOM
-
2026-06-16days on market $120,000 Active 60 DOM
-
2026-06-15days on market $120,000 Active 59 DOM
-
2026-06-13days on market $120,000 Active 57 DOM
-
2026-06-13days on market $120,000 Active 56 DOM
-
2026-06-09days on market $120,000 Active 53 DOM
-
2026-06-08days on market $120,000 Active 52 DOM
-
2026-06-07days on market $120,000 Active 51 DOM
-
2026-06-03days on market $120,000 Active 47 DOM
-
2026-06-02days on market $120,000 Active 46 DOM
-
2026-06-01days on market $120,000 Active 45 DOM
-
2026-05-31days on market $120,000 Active 44 DOM
-
2026-04-17$120,000 Active 337-char remark
Show marketing remark (337 chars)
A distinctive opportunity awaits that presents a truly great option for investors and all handy homeowners. This expansive duplex sits on a generous lot and represents a remarkable opportunity to invest in a versatile dwelling with enduring character and significant potential for creating a personalized and rewarding living experience.
ⓘ Source: listings_history table (triggers on properties + properties_extension) + one-shot
backfill from property_details.listing_events for pre-trigger history.
Tax reassessment forecast IN · Partial reset (capped growth)
- Current annual tax
- $1,350 · $112/mo
- Projected year-2 tax
- $1,350 · $112/mo
- Expected delta
- $0/yr ($0/mo · 0.0%)
ⓘ Screening estimate from a state-policy table — verify with the county assessor before closing.
Climate risk First Street
- Flood 6/10 Major FEMA zone X (unshaded) · 74% chance over 30 yrs
- Wildfire 1/10 Low
- Heat 4/10 Moderate 7 d/yr ≥102°F today · 19 d/yr by 30 yrs out
- Wind 2/10 Low 100% chance of damaging wind over 30 yrs
- Air quality 2/10 Low 1 unhealthy d/yr today · 2 by 30 yrs out
Nearby sold comps map
Loading sold comps map…
Walkable amenities ~0.75 mi
Loading nearby amenities…
Taxation est. · year 1
- Rental income
- $22,572
- − Mortgage interest
- −$6,722
- − Property taxes
- −$1,350
- − Insurance
- −$600
- − Repairs & maintenance
- −$1,806
- − Management
- −$1,806
- − Depreciation
- −$3,491
- Taxable income
- $6,798
- Est. tax owed @ 24.0%
- −$1,631
- After-tax cash flow
- $6,699/yr
For passive investors: Depreciation is non-cash, so a rental often shows a tax loss while cash-flowing — sheltering income. Rental losses are passive: they offset passive income freely, and up to $25,000/yr can offset ordinary (W-2) income if you actively participate and your MAGI is under $100k (phasing out to $0 by $150k); unused losses carry forward. On sale, claimed depreciation is recaptured at up to 25%, and gains may owe capital-gains tax (a 1031 exchange can defer both). Figures are a year-1 estimate at your 24.0% rate — not tax advice; consult a CPA.
Schools (NCES district)
- District
- Shelbyville Central Schools
- NCES district ID
- 1810140
- Math proficiency
- 40% ▼ -10.00%
- Reading proficiency
- 39% ▼ -9.00%
- Median HH income
- $45,199
- Composite
- 33.63/100
- National rank
- #5402
- State rank
- #148 of 301 in IN
Livability — Shelbyville
- Score
- 63/100
- State rank
- #450
- US rank
- #16051
Category grades
Schools grade is shown separately in the Schools card above.
Census & demographics
- Census place
- Shelbyville, IN
- County
- Shelby County · 28,782 people
- City population
- 28,782
- Metro
- Indianapolis-Carmel-Anderson, IN
- Population (ZIP)
- 28,782
- Household income
- $65,182
- Rent vs Own
- Severe rent burden
- 921.0
Population outlook (Shelby County) Hauer SSP2
- Today (2025)
- 45,020 people
- By 2030
- 44,962 · -0.1%
- By 2040
- 44,126 · -2.0%
- By 2050
- 42,110 · -6.5%
- By 2075
- 37,131 · -17.5%
- By 2100
- 29,714 · -34.0%
Race, ethnicity, and origin ACS 2023
- Neighborhood character
- Predominantly White (88%)
- Race & ethnicity
- White 88% Hispanic / Latino 7% Two or more races 4% Black 2% Asian 1%
- Hispanic origin (detail)
- Mexican 5%
- Common ancestry
- Italian 2% Slovak 1% Lithuanian 1%
- Foreign-born
- 5% · Canada
- Languages at home
- 92% English-only · Spanish 5% German/W. Germanic 1% Other Asian/Pacific 1%
Political lean MEDSL · Shelby
- 2024 margin
- Solid R (+48.0) · D 25.1% · R 73.1% · Other 1.8%
- 2008→2024 swing
- -29.0pp toward R · 2008: -19.0pp · 2024: -48.0pp
- All cycles
- 2024: R+48.0 2020: R+47.7 2016: R+47.2 2012: R+33.5 2008: R+19.0
Not yet ingested
- Civics
- —
Market trends
- HPI YoY
- ▼ -116.59%
- Current HPI
- 227.6747
- Rent YoY
- —
- Metro
- Indianapolis-Carmel-Anderson, IN
- State GDP YoY
- ▲ 2.90%
- F500 in state
- 18
Industry mix (Fortune 500 HQ in IN)
| Industry | F500 HQs | Revenue |
|---|---|---|
| Industrial Machinery | 2 | $37B |
|
||
| Healthcare | 1 | $177B |
|
||
| Pharmaceuticals | 1 | $45B |
|
||
| Metals / Steel | 1 | $18B |
|
||
| Agriculture | 1 | $17B |
|
||
| Packaging | 1 | $12B |
|
||
Price history
1 event — show timeline
- 2026-04-17 Listed $120,000 IRMLS
Property tax history
+3.9%/yrLatest (2025): $1,350 · +0.1% YoY. Source: county tax records.
Cash-flow waterfall
monthlySold comps — $/sqft
last 12 mo · ≤1 miLoading sold comps…