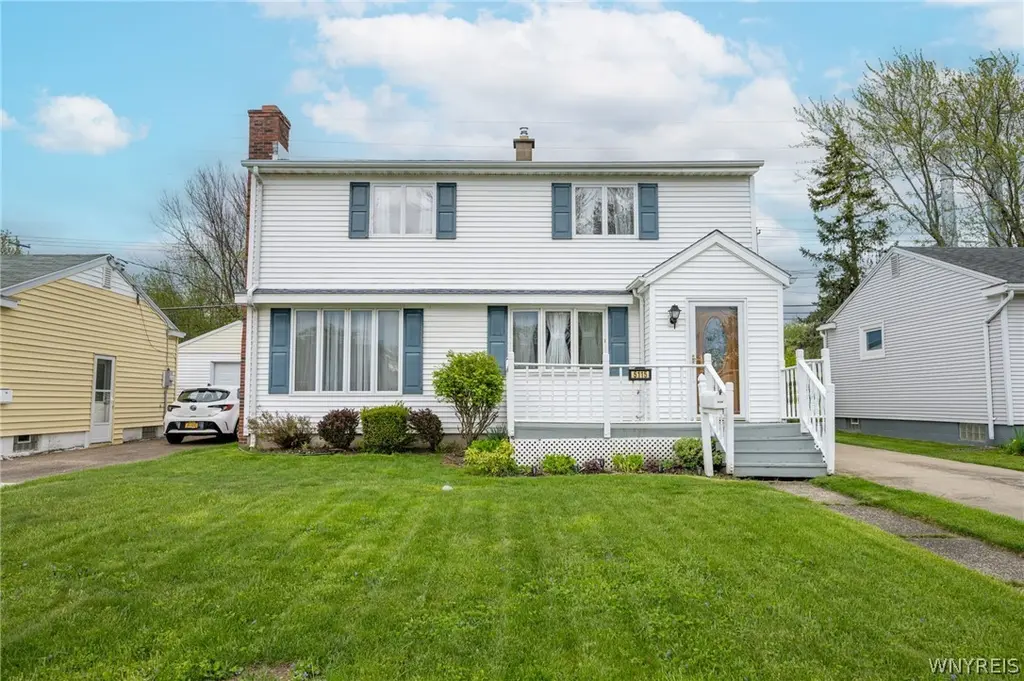
5115 Morgan Pkwy · Wanakah, NY
Flood risk 1/10 · Minimal
- FEMA flood zone
- X (unshaded)
- Chance of flooding over 30 yrs
- 0.0%
- Est. flood insurance / yr
- $473 – $860
Fire risk 1/10 · Minimal
- Est. fire insurance / yr
- $691 – $1,283
Heat risk 2/10 · Minimal
- Hot days now (above 93°F)
- 7 days/yr
- Hot days in 30 yrs
- 16 days/yr
Wind risk 1/10 · Minimal
- Chance of severe wind over 30 yrs
- —
Air-quality risk 2/10 · Minimal
- Unhealthy air days now
- 1 days/yr
- Unhealthy air days in 30 yrs
- 2 days/yr
Risk factors via First Street. Map © Google.
Why this score? — see what drove the D grade
The composite is a weighted blend of 9 inputs, each scored 0–100. Each bar is that input's sub-score; the figure is the points it added to the 100-point composite (weight × sub-score).
- ARV discount +15.0/15.0
- Cash flow +7.9/30.0
- Schools +4.7/10.0
- Rent growth +3.8/5.0
- Livability +3.5/5.0
- 1% rule +3.1/10.0
- Condition / age +2.5/5.0
- DSCR +2.0/10.0
- Appreciation +0.0/10.0
$229,900
🖨 Deal sheet (PDF) 📄 Offer letter ✓ Due diligence
Listing remarks
Beautiful 3-bedroom, 2 full bath Colonial offering spacious living in a fantastic location close to all conveniences! The large, bright living room/dining room combination features a cozy gas fireplace, creating the perfect space for entertaining or everyday living. Kitchen offers granite countertops, laminate flooring, and all appliances included. The family room opens to a charming 3-season sunroom overlooking the backyard. Full basement is partially finished and offers endless possibilities for additional living space, recreation, or storage. Detached 2-car garage. Recent updates include roof (5 years), metal roof on sunroom and garage (3 years), newer carpeting in bedroom and a hot wate
Key facts
- Gas fireplace
- 3-season sunroom
- Granite countertops
Tags
Property features AI
Exterior
- Parking: Detached garage; 2 garage spaces
- Utilities: Public water (connected); Sewer connected; Cable available; Circuit breaker electrical
- Home design: 2-story house; Existing (resale) property; Vinyl siding
- Construction: Poured foundation; Vinyl siding construction
- Exterior features: Concrete driveway; Deck; Fully fenced yard; Rectangular residential lot; City street frontage
Interior
- Kitchen: Granite counters; Gas oven; Gas range; Microwave; Refrigerator
- Flooring: Carpet; Laminate; Varies
- Bathrooms: 2 full bathrooms; 1 main-level bathroom
- Heating & cooling: Gas forced-air heating; Central air conditioning
- Interior features: Separate/formal dining room; Eat-in kitchen; Separate/formal living room; Granite counters; Full, partially finished basement; Living room; Recreation room; Sunroom; Florida room
- Laundry & utility: Washer and dryer located in basement; Gas water heater
Neighborhood map
What this means for you Summary
Snapshot
- This is a 3-bed/2.5-bath single-family listed at $230k.
Deal economics
- At list price, monthly cash flow is $-244 ($-3k/yr) — negative.
- To cash-flow at today's rent, offer at most $187k (18.8% below list).
- To meet the 1% rule (rent ≥ 1% of price), the offer needs to be $185k (19.3% below list).
- Recommended offer: $185k (19.3% below list) — sets the bar for 1% rule.
- Cap rate 5.0% vs local median 3.1% in Wanakah — top-decile yield for the area; either an underpriced asset or a hidden risk that comps aren't pricing in. Stress-test before assuming the spread holds.
Location & tenants
- Location reads 69/100 on livability (#508 in NY) — a middle-class / working-renter tenant base. Strengths: employment A+, housing A+, crime B+; Watch: amenities F, commute F, health & safety F.
- Frontier Central School District (suburban): math 54% / reading 55% proficiency, ranked #301 of 590 in NY (top 51%) — acceptable for families but not a draw, mixed tenant base, ~2y average lease; only 20% free/reduced lunch — higher-income household profile.
- Zoned schools: Cloverbank Elementary School (math 52% / reading 57%, grade C, #908 of 2,108 statewide, top 46%, 549 students, 33% FRL); Frontier Middle School (math 38% / reading 53%, grade D+, #337 of 729 statewide, top 47%, 1,071 students, 34% FRL); Frontier Senior High School (math 97% / reading 95%, grade A+, #68 of 1,100 statewide, top 6%, 1,352 students, 31% FRL).
- Market conditions: Rents rising fast (+5.2%/yr); 264 active listings in the ZIP; 1 comparable units currently listed for rent nearby; solid renter incomes; 1,244 units permitted in Erie County in 2024 (563 in 5+ unit buildings).
Forward outlook
- Local home prices are declining (-3.0%/yr); year-one equity from $2k of loan paydown is wiped out by about $7k of value loss. Plan a longer hold.
Negotiation context
- Only 8 days on market — expect competitive offers; lowballing is unlikely to land.
- 4 sale attempts since 7y ago with the ask held roughly flat each time — persistent listings suggest the price (not the market) is what's stuck; bring a comps-based counter.
Risks & watch-outs
- Watch-outs: built in 1955 — expect roof / HVAC / electrical / plumbing capex.
Questions for the listing agent
- What do current leases actually rent for vs. the listed asking? Can we see a recent rent roll and the last 12 months of T-12 income?
- Built in 1955 — when were the roof, HVAC, electrical panel, plumbing, and water heater last replaced?
- Is there a deadline driving the sale (1031 exchange, divorce, estate, relocation)? That informs how much negotiation room exists.
- The area grade is low — what's the realistic commute time and amenity access for the typical tenant pool here? Any planned neighborhood developments (good or bad) we should know about?
- What's the average days-on-market for RENTAL listings here right now (not sales)? A rising rental-DOM trend means longer vacancies and softer asking-rent achievability than the comps imply.
- What's the recent tenant-quality profile in this submarket — average credit score on applications, eviction rate, late-payment / NSF rate, and stable-employment percentage? A property-management company in the area should have these aggregated.
- How much new for-sale + rental construction is in the pipeline within 1–3 miles? Heavy new supply typically softens prices + rents 12–24 months out; constrained supply supports both.
Investment metrics
- 1% rule
- 0.81% ✗
- Cap rate
- 5.02%
- Cash-on-cash
- -4.55%
- DSCR
- 0.80
- GRM
- 10.3
CMA / ARV
- ARV (median comp)
- $290,710
- List price
- $229,900
- Delta
- -20.92%
- Verdict
- UNDERPRICED
- Comps
- 20 within 1.0 mi
Show comp detail 12 sales within ~0.75 mi
| Address | Dist | Beds/Ba | Sqft | Sold | Price | $/sf | Match |
|---|---|---|---|---|---|---|---|
| 5009 Chapman Pkwy | 0.20mi | 3/2.0 | 1,482 (-0%) | 10mo | $285,000 | $192 | 80 |
| 2820 Bell Dr | 0.14mi | 3/1.0 | 1,548 (+4%) | 1mo | $247,500 | $160 | 80 |
| 5084 Stewart Pkwy | 0.19mi | 4/2.0 (+1) | 1,508 (+1%) | 14mo | $345,500 | $229 | 70 |
| 5031 Chapman Pkwy | 0.15mi | 3/2.0 | 1,638 (+10%) | 9mo | $320,000 | $195 | 66 |
| 4937 Chapman Pkwy | 0.36mi | 3/2.0 | 1,412 (-5%) | 19mo | $275,000 | $195 | 57 |
| 3087 Cloverbank Rd | 0.74mi | 4/1.5 (+1) | 1,468 (-1%) | 2mo | $320,000 | $218 | 52 |
| 4980 Chapman Pkwy | 0.26mi | 3/1.0 | 1,306 (-12%) | 14mo | $275,000 | $211 | 50 |
| 2798 Amsdell Rd | 0.71mi | 3/1.0 | 1,482 (-0%) | 20mo | $322,000 | $217 | 44 |
| 2636 Hawthorne Ave | 0.50mi | 3/2.0 | 1,322 (-11%) | 17mo | $240,000 | $182 | 42 |
| 4796 Mount Vernon Blvd | 0.60mi | 3/1.0 | 1,672 (+12%) | 12mo | $310,000 | $185 | 35 |
| 2992 Avery Dr | 0.70mi | 3/1.0 | 1,296 (-13%) | 21mo | $246,000 | $190 | 22 |
| 5063 Lake Shore Rd | 0.75mi | 3/2.0 | 1,264 (-15%) | 23mo | $318,500 | $252 | 19 |
Match score weights: distance 35% · size 25% · config 20% · recency 20%. Top-matched comps best support the ARV.
Projected returns pro-forma
-3.0% appreciation · 5.21% rent growth · sell at horizon
- IRR
- -21.3%
- Equity multiple
- 0.25×
- Total profit
- $-48,491
- Equity at exit
- $34,279
- IRR
- -10.1%
- Equity multiple
- 0.32×
- Total profit
- $-43,742
- Equity at exit
- $19,878
Cash invested: $64,372 (down + closing). Projections, not guarantees.
Landlord ↔ Tenant lean methodology
- Overall (STATE)
- 15 Strongly Tenant-Friendly
- State New York
- 15 Strongly Tenant-Friendly · D+10
- County
- — inherits STATE
- City
- — inherits STATE
ZIP-level market 14075
- Rents YoY
- 5.2%
- Active inventory
- 264
- Price-to-rent
- 10.3×
Monthly cashflow live
- Estimated rent
- $1,855 medium interval (Pro) →
- Mortgage (P&I)
- −$1,206
- Tax from tax record
- −$408 /mo · $4,897/yr
- Insurance
- −$96
- HOA
- −$0
- Vacancy / Maint / Mgmt
- −$389
- Net cashflow
- $-244
Break-even live
Sensitivity live
| Price | -10% $-114 | -5% $-179 | +0% $-244 | +5% $-309 | +10% $-374 |
|---|---|---|---|---|---|
| Rent | -10% $-391 | -5% $-317 | +0% $-244 | +5% $-171 | +10% $-98 |
| Rate | -1.0pp $-128 | -0.5pp $-186 | base $-244 | +0.5pp $-304 | +1.0pp $-364 |
UW: 25.0% down · 7.5% · 30yr · 1.5% tax · 5.0% vac · 8.0% maint · 8.0% mgmt
Financing live
Cash to close
- Down payment
- $57,475
- Closing costs
- $6,897
- Reserves months
- —
- Total cash needed
- —
Loan-product check · same deal, 3 products live
Conventional
25% down · 7.5% · 30yr
- Down + closing
- —
- Monthly P&I
- —
- Monthly cashflow
- —
- DSCR
- —
- Eligible?
- —
Personal DTI + credit; lowest rate.
DSCR
20% down · 8.5% · 30yr
- Down + closing
- —
- Monthly P&I
- —
- Monthly cashflow
- —
- DSCR
- —
- Eligible?
- —
No personal income docs; deal must DSCR.
Hard money
10% down · 12.0% · 12mo
- Down + closing
- —
- Monthly P&I
- —
- Monthly cashflow
- —
- DSCR
- —
- Eligible?
- —
Short-term bridge; refi at stabilization.
Rent comps 1 comps
| Address | Beds | Baths | Sqft | Rent | $/sqft | DOM | Units | Dist |
|---|---|---|---|---|---|---|---|---|
| 5510 Southwestern Blvd Hamburg, NY | 2.0 | 2.0 | 1107 | $2,082 | $1.88 | 3d | 1 | 1.04mi |
Listing history 8 events
-
2026-05-15status Pending 897-char remark
-
2026-05-07$229,900 Active 897-char remark
-
2019-09-25historical
-
2019-09-04status Active
-
2019-08-23status Under Contract- Do Not Show
-
2019-06-25status Active
-
2019-05-07status Under Contract- Do Not Show
-
2019-04-25$169,900 Active
ⓘ Source: listings_history table (triggers on properties + properties_extension) + one-shot
backfill from property_details.listing_events for pre-trigger history.
Tax reassessment forecast NY · Partial reset (capped growth)
- Current annual tax
- $4,897 · $408/mo
- Projected year-2 tax
- $4,897 · $408/mo
- Expected delta
- $0/yr ($0/mo · 0.0%)
ⓘ Screening estimate from a state-policy table — verify with the county assessor before closing.
Climate risk First Street
- Flood 1/10 Low FEMA zone X (unshaded) · 0% chance over 30 yrs
- Wildfire 1/10 Low
- Heat 2/10 Low 7 d/yr ≥93°F today · 16 d/yr by 30 yrs out
- Wind 1/10 Low
- Air quality 2/10 Low 1 unhealthy d/yr today · 2 by 30 yrs out
Nearby sold comps map
Loading sold comps map…
Walkable amenities ~0.75 mi
Loading nearby amenities…
Taxation est. · year 1
- Rental income
- $22,257
- − Mortgage interest
- −$12,878
- − Property taxes
- −$4,897
- − Insurance
- −$1,150
- − Repairs & maintenance
- −$1,781
- − Management
- −$1,781
- − Depreciation
- −$6,688
- Taxable loss
- −$6,916
- Est. tax savings @ 24.0%
- +$1,660
- After-tax cash flow
- $-1,271/yr
For passive investors: Depreciation is non-cash, so a rental often shows a tax loss while cash-flowing — sheltering income. Rental losses are passive: they offset passive income freely, and up to $25,000/yr can offset ordinary (W-2) income if you actively participate and your MAGI is under $100k (phasing out to $0 by $150k); unused losses carry forward. On sale, claimed depreciation is recaptured at up to 25%, and gains may owe capital-gains tax (a 1031 exchange can defer both). Figures are a year-1 estimate at your 24.0% rate — not tax advice; consult a CPA.
Schools (NCES district)
- District
- Frontier Central School District
- NCES district ID
- 3611670
- Math proficiency
- 54% ▼ -16.00%
- Reading proficiency
- 55% ▼ -10.00%
- Median HH income
- $58,807
- Composite
- 47.36/100
- National rank
- #2291
- State rank
- #301 of 590 in NY
Livability — Wanakah
- Score
- 69/100
- State rank
- #508
- US rank
- #8972
Category grades
Schools grade is shown separately in the Schools card above.
Census & demographics
- Census place
- Wanakah, NY
- County
- Erie County · 714,559 people
- Metro
- Buffalo-Cheektowaga, NY
- Population (ZIP)
- 44,520
- Household income
- $83,383
- Rent vs Own
- Severe rent burden
- 824.0
Population outlook (Erie County) Hauer SSP2
- Today (2025)
- 933,037 people
- By 2030
- 935,181 · +0.2%
- By 2040
- 928,531 · -0.5%
- By 2050
- 905,725 · -2.9%
- By 2075
- 834,037 · -10.6%
- By 2100
- 708,033 · -24.1%
Race, ethnicity, and origin ACS 2023
- Neighborhood character
- Predominantly White (92%)
- Race & ethnicity
- White 92% Two or more races 4% Hispanic / Latino 3% Black 1%
- Common ancestry
- Romanian 20% Lithuanian 2% Slovak 2%
- Foreign-born
- 2% · Canada
- Languages at home
- 97% English-only · Spanish 1% Other Indo-European 1%
Political lean MEDSL · Erie
- 2024 margin
- Lean D (+9.7) · D 54.8% · R 45.2%
- 2008→2024 swing
- -7.9pp toward R · 2008: 17.5pp · 2024: 9.7pp
- All cycles
- 2024: D+9.7 2020: D+14.7 2016: D+4.8 2012: D+15.6 2008: D+17.5
Not yet ingested
- Civics
- —
Market trends
- HPI YoY
- ▼ -261.10%
- Current HPI
- 300.2852
- Rent YoY
- ▲ 5.21%
- Metro
- Buffalo-Cheektowaga, NY
- State GDP YoY
- ▲ 2.60%
- F500 in state
- 92
Industry mix (Fortune 500 HQ in NY)
| Industry | F500 HQs | Revenue |
|---|---|---|
| Financial Services | 10 | $950B |
|
||
| Consumer Goods | 9 | $162B |
|
||
| Insurance | 4 | $225B |
|
||
| Telecommunications | 2 | $144B |
|
||
| Pharmaceuticals | 2 | $112B |
|
||
| Media / Entertainment | 2 | $69B |
|
||
Price history
+35.3% since first listed8 events — show timeline
- 2026-05-15 Pending — WNYREIS
- 2026-05-07 Listed $229,900 WNYREIS
- 2019-09-25 Listing Removed — WNYREIS
- 2019-09-04 Relisted — WNYREIS
- 2019-08-23 Pending — WNYREIS
- 2019-06-25 Relisted — WNYREIS
- 2019-05-07 Pending — WNYREIS
- 2019-04-25 Listed $169,900 WNYREIS
Property tax history
+5.2%/yrLatest (2025): $4,897 · +12.3% YoY. Source: county tax records.
Cash-flow waterfall
monthlySold comps — $/sqft
last 12 mo · ≤1 miLoading sold comps…