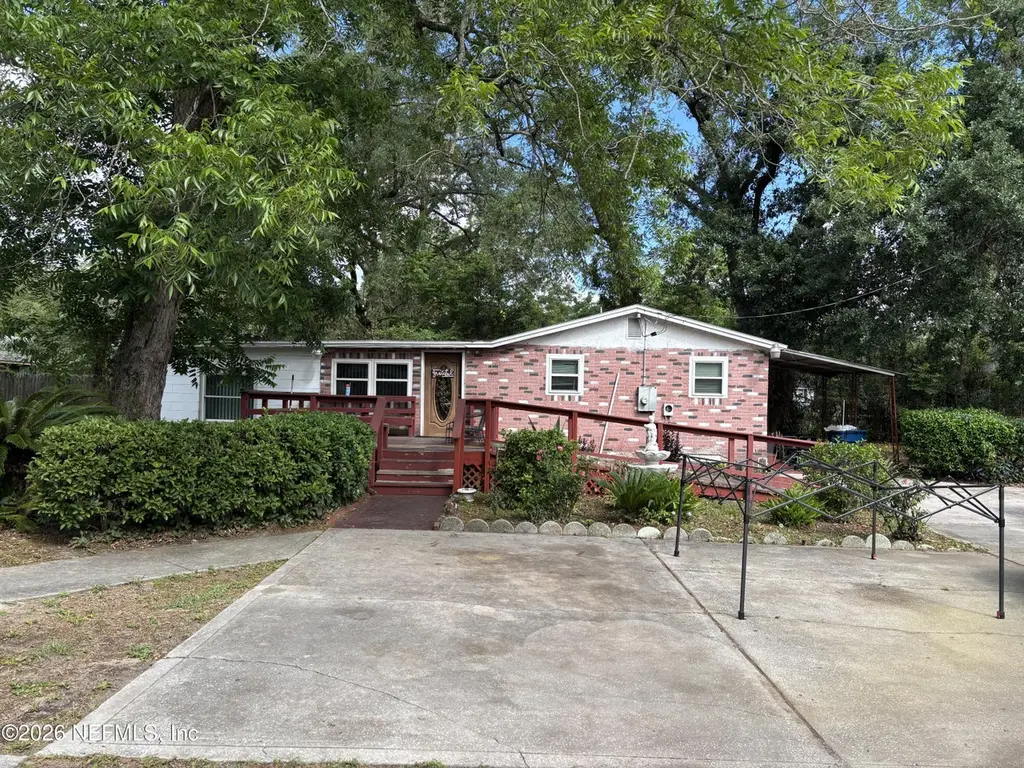
1459 Helena St · Jacksonville, FL
Flood risk 1/10 · Minimal
- FEMA flood zone
- X (unshaded)
- Chance of flooding over 30 yrs
- 0.0%
- Est. flood insurance / yr
- $507 – $1,088
Fire risk 2/10 · Minimal
- Est. fire insurance / yr
- $947 – $1,759
Heat risk 9/10 · Severe
- Hot days now (above 107°F)
- 7 days/yr
- Hot days in 30 yrs
- 19 days/yr
Wind risk 9/10 · Severe
- Chance of severe wind over 30 yrs
- 99.0%
Air-quality risk 4/10 · Minor
- Unhealthy air days now
- 6 days/yr
- Unhealthy air days in 30 yrs
- 6 days/yr
Risk factors via First Street. Map © Google.
Why this score? — see what drove the B- grade
The composite is a weighted blend of 9 inputs, each scored 0–100. Each bar is that input's sub-score; the figure is the points it added to the 100-point composite (weight × sub-score).
- Cash flow +23.8/30.0
- ARV discount +15.0/15.0
- DSCR +7.7/10.0
- 1% rule +6.7/10.0
- Livability +4.2/5.0
- Schools +3.9/10.0
- Condition / age +2.5/5.0
- Rent growth +2.2/5.0
- Appreciation +0.0/10.0
$130,000
🖨 Deal sheet 📄 Offer letter ✓ Due diligence
Listing remarks
GREAT FIXER UPPER; ON A HUGH LOT!!! INVESTOR OPPPORTUNITY; 4 BEDROOMS 2 FULL BATHS; SPLIT PLAN; LARGE PRIMARY BEDROOM; SEPERATE LIVING AND DINING ROOM; INSIDE LAUNDRY
Key facts
- 0.47 acre lot
- 2 parking spots
- Built 1967
Property features AI
Finance
- Other: Road frontage on a city street; Lot approximately 0.47 acres
- HOA & community: Not a senior community
Exterior
- Parking: 2-space carport; Additional parking available; Other parking features
- Security: Smoke detector(s)
- Utilities: Septic tank
- Home design: Single family residence; One level; Entry on level 1; Current use: Residential
- Construction: Aluminum siding, concrete, and stucco construction; Shingle roof; Guest house on property; Workshop on property
- Exterior features: Front porch; Smoke detector(s)
Interior
- Kitchen: Electric range; Refrigerator
- Bedrooms: 4 bedrooms
- Flooring: Carpet; Tile
- Bathrooms: 2 full bathrooms
- Heating & cooling: Central heating; Central air conditioning
- Interior features: Ceiling fan(s); Split bedroom layout
- Laundry & utility: Washer hookup in unit; Electric dryer hookup
Neighborhood map
What this means for you Summary
Snapshot
- This is a 4-bed/2.0-bath single-family listed at $130k.
Deal economics
- At list price, monthly cash flow is $250 ($3k/yr) — positive.
- The deal already cash-flows at list — no discount required.
- Meets the 1% rule at list price ($2k rent vs $130k).
- Cap rate 8.6% vs local median 4.0% in Jacksonville — top-decile yield for the area; either an underpriced asset or a hidden risk that comps aren't pricing in. Stress-test before assuming the spread holds.
Location & tenants
- Location reads 83/100 on livability (#50 in FL, #911 nationally) — a professional / high-income tenant draw. Strengths: amenities A+, commute A+, housing A+.
- Duval (urban): math 46% / reading 45% proficiency, ranked #48 of 73 in FL (top 66%) — families likely to look elsewhere, expect single-tenant / working-renter base with shorter leases.
- Market conditions: Rents soft (-1.4%/yr); 291 active listings in the ZIP; 40 comparable units currently listed for rent nearby; rentals at typical pace (median 21d on market — plan ~3-4 weeks tenant-placement turnaround); lower-income renter base — watch delinquency; 6,503 units permitted in Duval County in 2024 (1,131 in 5+ unit buildings).
- This rent runs 44% of the median local income ($41k/yr) — at the standard rent-burdened threshold; future hikes will face affordability resistance.
Forward outlook
- Local home prices are declining (-3.0%/yr); year-one equity from $899 of loan paydown is wiped out by about $4k of value loss. Plan a longer hold.
- Duval County population projected at +19% by 2050 — long-run rental-demand tailwind backs the buy-and-hold thesis.
Negotiation context
- Only 1 days on market — expect competitive offers; lowballing is unlikely to land.
Risks & watch-outs
- Climate carrying-cost: severe wind risk, 99% chance of damaging wind over 30y; extreme-heat days projected 7→19/yr by 2055 (HVAC capex compounding) — expect insurance premiums to compound above CPI over the hold.
Questions for the listing agent
- Built in 1967 — when were the roof, HVAC, electrical panel, plumbing, and water heater last replaced?
- Is there a deadline driving the sale (1031 exchange, divorce, estate, relocation)? That informs how much negotiation room exists.
- Schools are B-rated — typically a magnet for longer-tenancy family renters. What's the average tenant stay here, and is there a school-zone premium baked into asking?
- What's the average days-on-market for RENTAL listings here right now (not sales)? A rising rental-DOM trend means longer vacancies and softer asking-rent achievability than the comps imply.
- What's the recent tenant-quality profile in this submarket — average credit score on applications, eviction rate, late-payment / NSF rate, and stable-employment percentage? A property-management company in the area should have these aggregated.
- How much new for-sale + rental construction is in the pipeline within 1–3 miles? Heavy new supply typically softens prices + rents 12–24 months out; constrained supply supports both.
Investment metrics
- 1% rule
- 1.17% ✓
- Cap rate
- 8.60%
- Cash-on-cash
- 8.24%
- DSCR
- 1.37
- GRM
- 7.1
CMA / ARV
- ARV (on-the-fly)
- $182,784
- Comps found
- 12
Show comp detail 12 sales within ~0.75 mi
| Address | Dist | Beds/Ba | Sqft | Sold | Price | $/sf | Match |
|---|---|---|---|---|---|---|---|
| 7604 Calvin St | 0.59mi | 4/2.0 | 1,536 (0%) | 14mo | $165,000 | $107 | 61 |
| 7840 Stephenson Dr | 0.74mi | 4/2.0 | 1,578 (+3%) | 2mo | $259,900 | $165 | 59 |
| 1204 N North Shore Dr | 0.54mi | 4/2.0 | 1,399 (-9%) | 2mo | $145,000 | $104 | 58 |
| 1677 Rowe Ave | 0.26mi | 4/2.0 | 1,316 (-14%) | 7mo | $175,000 | $133 | 58 |
| 7548 Epperson Ave | 0.48mi | 4/2.0 | 1,620 (+6%) | 16mo | $225,000 | $139 | 55 |
| 1613 Lessard Cir | 0.61mi | 3/2.0 (-1) | 1,534 (-0%) | 18mo | $216,000 | $141 | 52 |
| 5837 Christobel Ave | 0.34mi | 3/1.0 (-1) | 1,462 (-5%) | 20mo | $91,500 | $63 | 51 |
| 1044 Alderside St | 0.54mi | 3/2.0 (-1) | 1,669 (+9%) | 5mo | $125,000 | $75 | 51 |
| 1256 Wainwright Ct | 0.58mi | 4/2.0 | 1,339 (-13%) | 3mo | $160,000 | $119 | 50 |
| 5741 Castellano Ave | 0.56mi | 4/2.0 | 1,320 (-14%) | 4mo | $99,200 | $75 | 47 |
| 7606 Pickett St | 0.65mi | 3/2.0 (-1) | 1,665 (+8%) | 18mo | $245,000 | $147 | 36 |
| 1030 Ardoon St | 0.74mi | 3/1.0 (-1) | 1,335 (-13%) | 17mo | $140,000 | $105 | 20 |
Match score weights: distance 35% · size 25% · config 20% · recency 20%. Top-matched comps best support the ARV.
Projected returns pro-forma
-3.0% appreciation · 0.0% rent growth · sell at horizon
- IRR
- -7.3%
- Equity multiple
- 0.74×
- Total profit
- $-9,552
- Equity at exit
- $19,383
- IRR
- -2.3%
- Equity multiple
- 0.87×
- Total profit
- $-4,837
- Equity at exit
- $11,240
Cash invested: $36,400 (down + closing). Projections, not guarantees.
Landlord ↔ Tenant lean methodology
- Overall (STATE)
- 87 Strongly Landlord-Friendly
- State Florida
- 87 Strongly Landlord-Friendly · R+3
- County
- — inherits STATE
- City
- — inherits STATE
ZIP-level market 32208
- Home prices YoY
- -33.6%
- Rents YoY
- -1.4%
- Active inventory
- 291
- Price-to-rent
- 7.1×
Monthly cashflow live
- Estimated rent
- $1,523 high interval (Pro) →
- Mortgage (P&I)
- −$682
- Tax from tax record
- −$217 /mo · $2,609/yr
- Insurance
- −$54
- HOA
- −$0
- Vacancy / Maint / Mgmt
- −$320
- Net cashflow
- $250
Break-even live
UW: 25.0% down · 7.5% · 30yr · 1.5% tax · 5.0% vac · 8.0% maint · 8.0% mgmt
Financing live
Cash to close
- Down payment
- $32,500
- Closing costs
- $3,900
- Reserves months
- —
- Total cash needed
- —
Loan-product check · same deal, 3 products live
Conventional
25% down · 7.5% · 30yr
- Down + closing
- —
- Monthly P&I
- —
- Monthly cashflow
- —
- DSCR
- —
- Eligible?
- —
Personal DTI + credit; lowest rate.
DSCR
20% down · 8.5% · 30yr
- Down + closing
- —
- Monthly P&I
- —
- Monthly cashflow
- —
- DSCR
- —
- Eligible?
- —
No personal income docs; deal must DSCR.
Hard money
10% down · 12.0% · 12mo
- Down + closing
- —
- Monthly P&I
- —
- Monthly cashflow
- —
- DSCR
- —
- Eligible?
- —
Short-term bridge; refi at stabilization.
Rent comps 40 comps
| Address | Beds | Baths | Sqft | Rent | $/sqft | DOM | Units | Dist |
|---|---|---|---|---|---|---|---|---|
| 5903 Droad St Jacksonville, FL | 3.0 | 1.0 | 1161 | $1,400 | $1.21 | 3d | 1 | 0.30mi |
| 5805 Christobel Ave Jacksonville, FL | 4.0 | 2.0 | 1986 | $1,800 | $0.91 | 7d | 1 | 0.33mi |
| 1567 Rutledge Ave Jacksonville, FL | 3.0 | 2.0 | 1050 | $1,113 | $1.06 | 23d | 1 | 0.38mi |
| 7345 Linda Dr Jacksonville, FL | 5.0 | 2.0 | 1380 | $1,650 | $1.20 | 23d | 1 | 0.52mi |
| 6510 Avalon St Jacksonville, FL | 4.0 | 2.0 | 1488 | $1,425 | $0.96 | 23d | 1 | 0.62mi |
| 920 Alderside St Jacksonville, FL | 3.0 | 1.0 | 1255 | $1,195 | $0.95 | 4d | 1 | 0.63mi |
| 1750 Rutledge Ave Jacksonville, FL | 3.0 | 2.0 | 1250 | $1,358 | $1.09 | 14d | 1 | 0.64mi |
| 7927 Reid Ave Jacksonville, FL | 3.0 | 1.0 | 1055 | $1,500 | $1.42 | 23d | 1 | 0.65mi |
| 1010 Edgewood Ave W Jacksonville, FL | 4.0 | 2.0 | 1450 | $1,250 | $0.86 | 14d | 1 | 0.70mi |
| 1010 Edgewood Ave W Jacksonville, FL | 4.0 | 2.0 | 1450 | $1,250 | $0.86 | 23d | 1 | 0.70mi |
| 7762 Lake Park Dr Jacksonville, FL | 4.0 | 2.0 | 2140 | $1,451 | $0.68 | 23d | 1 | 0.70mi |
| 1348 Crestwood St Jacksonville, FL | 3.0 | 1.0 | 1300 | $1,100 | $0.85 | 23d | 1 | 0.75mi |
| 1834 Meharry Ave Jacksonville, FL | 3.0 | 1.0 | 1291 | $1,295 | $1.00 | 4d | 1 | 0.94mi |
| 5352 Dodge Rd Jacksonville, FL | 3.0 | 2.0 | 1050 | $1,261 | $1.20 | 23d | 1 | 0.99mi |
| 1823 W 44th St Jacksonville, FL | 3.0 | 2.0 | 1066 | $1,500 | $1.41 | 23d | 1 | 1.01mi |
| 664 Escambia St Jacksonville, FL | 3.0 | 2.0 | 1352 | $1,500 | $1.11 | 17d | 1 | 1.03mi |
| 646 Escambia St Jacksonville, FL | 3.0 | 2.0 | 1200 | $1,395 | $1.16 | 21d | 1 | 1.04mi |
| 1021 Lake Forest Blvd Jacksonville, FL | 3.0 | 1.0 | 1393 | $1,290 | $0.93 | 3d | 1 | 1.10mi |
| 472 W 65th St Jacksonville, FL | 3.0 | 1.0 | 1312 | $1,295 | $0.99 | 21d | 1 | 1.11mi |
| 915 Wayne St Jacksonville, FL | 4.0 | 2.0 | 1220 | $1,313 | $1.08 | 3d | 1 | 1.13mi |
| 8642 2nd Ave Jacksonville, FL | 3.0 | 2.0 | 1074 | $1,245 | $1.16 | 1d | 1 | 1.13mi |
| 2151 Wilberforce Rd Jacksonville, FL | 3.0 | 2.0 | 1166 | $1,249 | $1.07 | 23d | 1 | 1.17mi |
| 1867 W 41st St Jacksonville, FL | 3.0 | 2.0 | 1218 | $1,325 | $1.09 | 17d | 1 | 1.18mi |
| 2069 Talladega Rd Jacksonville, FL | 4.0 | 2.0 | 1152 | $1,298 | $1.13 | 4d | 1 | 1.21mi |
| 356 Duray Ct Jacksonville, FL | 3.0 | 2.0 | 1070 | $1,425 | $1.33 | 14d | 1 | 1.23mi |
| 5816 Paris Ave Jacksonville, FL | 4.0 | 2.0 | 1701 | $1,599 | $0.94 | 23d | 1 | 1.24mi |
| 8721 4th Ave Jacksonville, FL | 3.0 | 1.5 | 1344 | $1,399 | $1.04 | 23d | 1 | 1.24mi |
| 8726 Monroe Ave Jacksonville, FL | 3.0 | 2.0 | 1920 | $1,400 | $0.73 | 14d | 1 | 1.24mi |
| 1490 W 33rd St Jacksonville, FL | 4.0 | 1.5 | 1150 | $1,150 | $1.00 | 23d | 1 | 1.26mi |
| 562 W 49th St Jacksonville, FL | 3.0 | 1.0 | 1091 | $1,195 | $1.10 | 23d | 1 | 1.26mi |
| 343 W 60th St Jacksonville, FL | 3.0 | 1.0 | 1238 | $1,299 | $1.05 | 21d | 1 | 1.26mi |
| 2108 Talladega Rd Jacksonville, FL | 3.0 | 2.0 | 1160 | $1,579 | $1.36 | 4d | 1 | 1.27mi |
| 2818 Palmdale St Jacksonville, FL | 4.0 | 2.5 | 1484 | $1,900 | $1.28 | 23d | 1 | 1.28mi |
| 346 W 68th St Jacksonville, FL | 3.0 | 1.0 | 1114 | $1,385 | $1.24 | 4d | 1 | 1.31mi |
| 1407 W 31st St Jacksonville, FL | 3.0 | 3.5 | 1140 | $1,550 | $1.36 | 23d | 1 | 1.32mi |
| 425 W 47th St Jacksonville, FL | 3.0 | 1.5 | 1083 | $1,193 | $1.10 | 7d | 1 | 1.34mi |
| 1587 W 30th St Jacksonville, FL | 3.0 | 1.0 | 1363 | $1,450 | $1.06 | 14d | 1 | 1.39mi |
| 8918 1st Ave Jacksonville, FL | 3.0 | 2.0 | 1435 | $1,321 | $0.92 | 16d | 1 | 1.45mi |
| 1530 W 29th St Jacksonville, FL | 3.0 | 2.0 | 1164 | $1,385 | $1.19 | 23d | 1 | 1.45mi |
| 8910 Adams Ave Jacksonville, FL | 4.0 | 2.0 | 1250 | $1,225 | $0.98 | 3d | 1 | 1.46mi |
Listing history 2 events
-
2026-05-15status Pending
-
2026-05-13$130,000 Active
ⓘ Source: listings_history table (triggers on properties + properties_extension) + one-shot
backfill from property_details.listing_events for pre-trigger history.
Tax reassessment forecast FL · Resets to sale price
- Current annual tax
- $2,609 · $217/mo
- Projected year-2 tax
- $2,609 · $217/mo
- Expected delta
- $0/yr ($0/mo · 0.0%)
ⓘ Screening estimate from a state-policy table — verify with the county assessor before closing.
Climate risk First Street
- Flood 1/10 Low FEMA zone X (unshaded) · 0% chance over 30 yrs
- Wildfire 2/10 Low
- Heat 9/10 Extreme 7 d/yr ≥107°F today · 19 d/yr by 30 yrs out
- Wind 9/10 Extreme 99% chance of damaging wind over 30 yrs
- Air quality 4/10 Moderate 6 unhealthy d/yr today · 6 by 30 yrs out
Nearby sold comps map
Loading sold comps map…
Walkable amenities ~0.75 mi
Loading nearby amenities…
Taxation est. · year 1
- Rental income
- $18,278
- − Mortgage interest
- −$7,282
- − Property taxes
- −$2,609
- − Insurance
- −$650
- − Repairs & maintenance
- −$1,462
- − Management
- −$1,462
- − Depreciation
- −$3,782
- Taxable income
- $1,031
- Est. tax owed @ 24.0%
- −$247
- After-tax cash flow
- $2,752/yr
For passive investors: Depreciation is non-cash, so a rental often shows a tax loss while cash-flowing — sheltering income. Rental losses are passive: they offset passive income freely, and up to $25,000/yr can offset ordinary (W-2) income if you actively participate and your MAGI is under $100k (phasing out to $0 by $150k); unused losses carry forward. On sale, claimed depreciation is recaptured at up to 25%, and gains may owe capital-gains tax (a 1031 exchange can defer both). Figures are a year-1 estimate at your 24.0% rate — not tax advice; consult a CPA.
Schools (NCES district)
- District
- Duval
- NCES district ID
- 1200480
- Math proficiency
- 46% ▼ -11.00%
- Reading proficiency
- 45% ▼ -4.00%
- Median HH income
- $48,987
- Composite
- 38.97/100
- National rank
- #4076
- State rank
- #48 of 73 in FL
Livability — Jacksonville
- Score
- 83/100
- State rank
- #50
- US rank
- #911
Category grades
Schools grade is shown separately in the Schools card above.
Census & demographics
- Census place
- Jacksonville, FL
- County
- Duval County · 1,015,274 people
- City population
- 979,034
- Metro
- Jacksonville, FL
- Population (ZIP)
- 32,699
- Household income
- $41,324
- Rent vs Own
- Severe rent burden
- 1765.0
Population outlook (Duval County) Hauer SSP2
- Today (2025)
- 1,013,010 people
- By 2030
- 1,059,228 · +4.6%
- By 2040
- 1,141,439 · +12.7%
- By 2050
- 1,205,258 · +19.0%
- By 2075
- 1,324,282 · +30.7%
- By 2100
- 1,319,620 · +30.3%
Race, ethnicity, and origin ACS 2023
- Neighborhood character
- Predominantly Black (77%)
- Race & ethnicity
- Black 77% White 16% Two or more races 4% Hispanic / Latino 3%
- Common ancestry
- Italian 1%
- Foreign-born
- 2% · Canada
- Languages at home
- 97% English-only · Spanish 2%
Political lean MEDSL · Duval
- 2024 margin
- Toss-up / Even · D 48.7% · R 50.1% · Other 1.2%
- 2008→2024 swing
- +0.4pp no change · 2008: -1.9pp · 2024: -1.5pp
- All cycles
- 2024: R+1.5 2020: D+3.8 2016: R+1.5 2012: R+3.6 2008: R+1.9
Not yet ingested
- Civics
- —
Market trends
- HPI YoY
- ▼ -110.56%
- Current HPI
- 217.9706
- Rent YoY
- ▼ -1.36%
- Metro
- Jacksonville, FL
- State GDP YoY
- ▲ 3.28%
- F500 in state
- 36
Industry mix (Fortune 500 HQ in FL)
| Industry | F500 HQs | Revenue |
|---|---|---|
| Industrial Technology | 2 | $29B |
|
||
| Insurance | 2 | $17B |
|
||
| Retail | 1 | $60B |
|
||
| Technology Distribution | 1 | $58B |
|
||
| Homebuilding | 1 | $35B |
|
||
| Technology Manufacturing | 1 | $35B |
|
||
Price history
2 events — show timeline
- 2026-05-15 Pending — realMLS
- 2026-05-13 Listed $130,000 realMLS
Property tax history
+25.7%/yrLatest (2025): $2,609 · +17.7% YoY. Source: county tax records.
Cash-flow waterfall
monthlySold comps — $/sqft
last 12 mo · ≤1 miLoading sold comps…