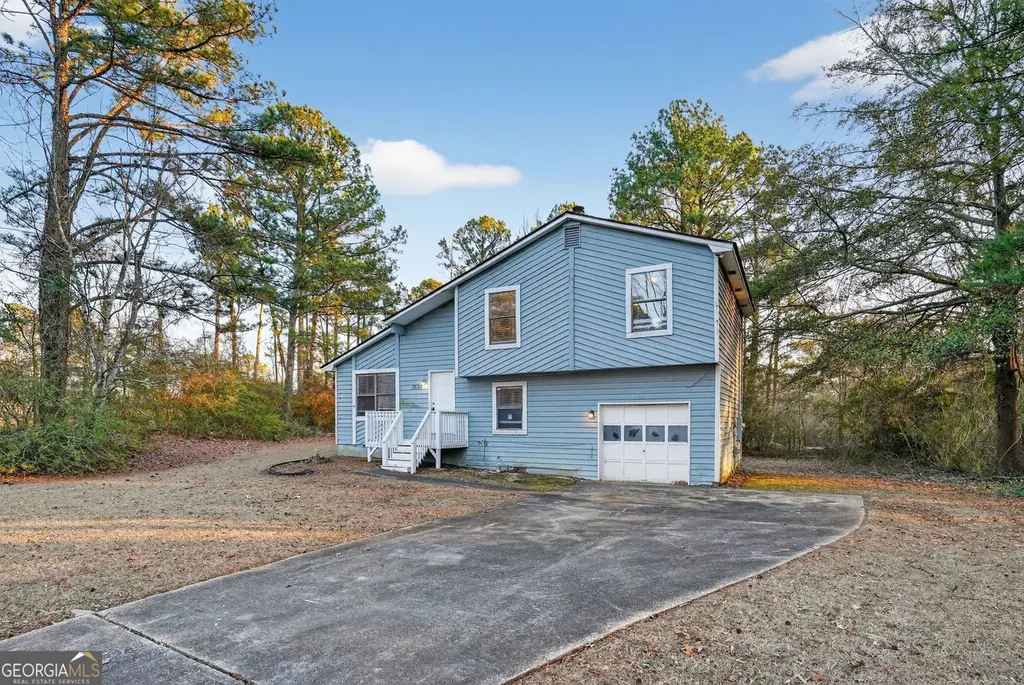
3520 Valley Chase Ct · Stonecrest, GA
Flood risk 1/10 · Minimal
- FEMA flood zone
- X (unshaded)
- Chance of flooding over 30 yrs
- 0.0%
- Est. flood insurance / yr
- $507 – $1,088
Fire risk 3/10 · Minor
- Est. fire insurance / yr
- $963 – $1,789
Heat risk 5/10 · Moderate
- Hot days now (above 106°F)
- 6 days/yr
- Hot days in 30 yrs
- 15 days/yr
Wind risk 5/10 · Moderate
- Chance of severe wind over 30 yrs
- 24.0%
Air-quality risk 5/10 · Moderate
- Unhealthy air days now
- 7 days/yr
- Unhealthy air days in 30 yrs
- 10 days/yr
Risk factors via First Street. Map © Google.
Why this score? — see what drove the C- grade
The composite is a weighted blend of 9 inputs, each scored 0–100. Each bar is that input's sub-score; the figure is the points it added to the 100-point composite (weight × sub-score).
- Cash flow +16.0/30.0
- ARV discount +15.0/15.0
- DSCR +4.9/10.0
- 1% rule +4.8/10.0
- Rent growth +3.7/5.0
- Livability +2.5/5.0
- Condition / age +2.5/5.0
- Schools +2.1/10.0
- Appreciation +0.0/10.0
$199,900
🖨 Deal sheet 📄 Offer letter ✓ Due diligence
Listing remarks MLS
Welcome to 3520 Valley Chase Ct in Stonecrest! This 3-bedroom, 2-bath, two-story home offers a functional layout with plenty of living space. The main level features a comfortable living area, a well-sized kitchen, and convenient flow for everyday living and entertaining. Upstairs, you'll find generously sized bedrooms and full baths that provide privacy and comfort.
Key facts
- 0.4 acre lot
- Garage
- Built 1985
Neighborhood map
What this means for you Summary
Snapshot
- This is a 3-bed/2.0-bath single-family listed at $200k.
Deal economics
- At list price, monthly cash flow is $99 ($1k/yr) — positive.
- The deal already cash-flows at list — no discount required.
- To meet the 1% rule (rent ≥ 1% of price), the offer needs to be $195k (2.3% below list).
- Recommended offer: $182k (9.0% below list) — sets the bar for market timing.
- Cap rate 6.9% vs local median 5.1% in Stonecrest — top-decile yield for the area; either an underpriced asset or a hidden risk that comps aren't pricing in. Stress-test before assuming the spread holds.
Location & tenants
- Location reads: area grade C — affects rentability + tenant quality, not the cash-flow math above.
- Dekalb County (suburban): math 19% / reading 28% proficiency, ranked #125 of 174 in GA (top 72%) — low school quality limits family demand, transient renter base, plan for 1-2y turnover; 68% free/reduced lunch — lower-income household profile, screen leases tightly.
- Market conditions: Rents rising fast (+4.6%/yr); 320 active listings in the ZIP; 7 comparable units currently listed for rent nearby; rentals leasing fast (median 10d on market — plan ~1-2 weeks tenant-placement turnaround); 1,240 units permitted in DeKalb County in 2024 (385 in 5+ unit buildings).
- This rent runs 32% of the median local income ($74k/yr) — at the standard rent-burdened threshold; future hikes will face affordability resistance.
Forward outlook
- Local home prices are declining (-3.0%/yr); year-one equity from $1k of loan paydown is wiped out by about $6k of value loss. Plan a longer hold.
- DeKalb County population projected at +28% by 2050 — long-run rental-demand tailwind backs the buy-and-hold thesis.
Negotiation context
- It's been on market 110 days — a 9% lower offer ($182k) is reasonable based on typical stale-listing flexibility.
- 14 sale attempts since 13y ago; this cycle's ask has dropped $15k (7%) from the opening price — seller is motivated, your offer sets the floor, not the list.
Risks & watch-outs
- Climate carrying-cost: moderate wind risk, 24% chance of damaging wind over 30y; extreme-heat days projected 6→15/yr by 2055 (HVAC capex compounding) — expect insurance premiums to compound above CPI over the hold.
Questions for the listing agent
- It's been on market 110 days. Have you received any prior offers? Is the seller open to a 9% concession, seller financing, or rate buy-down credit?
- Why hasn't it sold? Are there any deal-killer items the seller is aware of (foundation, flood, title, zoning, code violations)?
- Is there a deadline driving the sale (1031 exchange, divorce, estate, relocation)? That informs how much negotiation room exists.
- What's the average days-on-market for RENTAL listings here right now (not sales)? A rising rental-DOM trend means longer vacancies and softer asking-rent achievability than the comps imply.
- What's the recent tenant-quality profile in this submarket — average credit score on applications, eviction rate, late-payment / NSF rate, and stable-employment percentage? A property-management company in the area should have these aggregated.
- How much new for-sale + rental construction is in the pipeline within 1–3 miles? Heavy new supply typically softens prices + rents 12–24 months out; constrained supply supports both.
Investment metrics
- 1% rule
- 0.98% ✗
- Cap rate
- 6.89%
- Cash-on-cash
- 2.12%
- DSCR
- 1.09
- GRM
- 8.5
CMA / ARV
- ARV (median comp)
- $241,298
- List price
- $199,900
- Delta
- -17.16%
- Verdict
- UNDERPRICED
- Comps
- 20 within 1.0 mi
Show comp detail 12 sales within ~0.75 mi
| Address | Dist | Beds/Ba | Sqft | Sold | Price | $/sf | Match |
|---|---|---|---|---|---|---|---|
| 3512 Valley Chase Ct | 0.02mi | 3/2.0 | 1,341 (-3%) | 6mo | $271,500 | $202 | 89 |
| 5055 Great Meadows Rd | 0.20mi | 3/2.0 | 1,382 (0%) | 7mo | $208,000 | $151 | 85 |
| 4954 Browns Mill Rd | 0.29mi | 3/2.0 | 1,414 (+2%) | 2mo | $226,500 | $160 | 81 |
| 3449 Oak Run Dr | 0.23mi | 3/2.0 | 1,512 (+9%) | 1mo | $153,500 | $102 | 73 |
| 5209 Salem Rd | 0.41mi | 3/1.0 | 1,472 (+6%) | 4mo | $70,000 | $48 | 62 |
| 5326 Rocky Pine Dr | 0.63mi | 3/2.0 | 1,400 (+1%) | 8mo | $190,000 | $136 | 62 |
| 3599 Salem Glen Rd | 0.65mi | 3/2.0 | 1,478 (+7%) | 8mo | $230,000 | $156 | 52 |
| 5263 Salem Rd | 0.44mi | 3/1.0 | 1,175 (-15%) | 4mo | $80,000 | $68 | 47 |
| 5267 Tasman Trl | 0.64mi | 3/2.0 | 1,258 (-9%) | 12mo | $159,900 | $127 | 46 |
| 5438 Salem Springs Dr | 0.74mi | 3/2.5 | 1,560 (+13%) | 3mo | $240,000 | $154 | 39 |
| 5362 Salem Springs Dr | 0.73mi | 3/2.0 | 1,192 (-14%) | 6mo | $208,000 | $174 | 38 |
| 5388 Robertson Path | 0.68mi | 3/2.0 | 1,570 (+14%) | 11mo | $229,000 | $146 | 36 |
Match score weights: distance 35% · size 25% · config 20% · recency 20%. Top-matched comps best support the ARV.
Projected returns pro-forma
-3.0% appreciation · 4.6% rent growth · sell at horizon
- IRR
- -11.0%
- Equity multiple
- 0.59×
- Total profit
- $-22,846
- Equity at exit
- $29,806
- IRR
- 0.5%
- Equity multiple
- 1.04×
- Total profit
- $2,016
- Equity at exit
- $17,284
Cash invested: $55,972 (down + closing). Projections, not guarantees.
Landlord ↔ Tenant lean methodology
- Overall (STATE)
- 90 Strongly Landlord-Friendly
- State Georgia
- 90 Strongly Landlord-Friendly · R+3
- County
- — inherits STATE
- City
- — inherits STATE
ZIP-level market 30038
- Home prices YoY
- -28.0%
- Rents YoY
- 4.6%
- Active inventory
- 320
- Price-to-rent
- 8.5×
Monthly cashflow live
- Estimated rent
- $1,953 high interval (Pro) →
- Mortgage (P&I)
- −$1,048
- Tax from tax record
- −$313 /mo · $3,751/yr
- Insurance
- −$83
- HOA
- −$0
- Vacancy / Maint / Mgmt
- −$410
- Net cashflow
- $99
Break-even live
UW: 25.0% down · 7.5% · 30yr · 1.5% tax · 5.0% vac · 8.0% maint · 8.0% mgmt
Financing live
Cash to close
- Down payment
- $49,975
- Closing costs
- $5,997
- Reserves months
- —
- Total cash needed
- —
Loan-product check · same deal, 3 products live
Conventional
25% down · 7.5% · 30yr
- Down + closing
- —
- Monthly P&I
- —
- Monthly cashflow
- —
- DSCR
- —
- Eligible?
- —
Personal DTI + credit; lowest rate.
DSCR
20% down · 8.5% · 30yr
- Down + closing
- —
- Monthly P&I
- —
- Monthly cashflow
- —
- DSCR
- —
- Eligible?
- —
No personal income docs; deal must DSCR.
Hard money
10% down · 12.0% · 12mo
- Down + closing
- —
- Monthly P&I
- —
- Monthly cashflow
- —
- DSCR
- —
- Eligible?
- —
Short-term bridge; refi at stabilization.
Rent comps 7 comps
| Address | Beds | Baths | Sqft | Rent | $/sqft | DOM | Units | Dist |
|---|---|---|---|---|---|---|---|---|
| 3712 Salem Chapel Dr Lithonia, GA | 3.0 | 2.5 | 1683 | $1,650 | $0.98 | 10d | 1 | 0.69mi |
| 3673 Walnut Creek Way Lithonia, GA | 4.0 | 3.0 | 1692 | $1,895 | $1.12 | 2d | 1 | 0.81mi |
| 5238 Walnut Ct Lithonia, GA | 4.0 | 2.5 | 1492 | $1,940 | $1.30 | 1d | 1 | 0.83mi |
| 5302 Timor Trl Lithonia, GA | 3.0 | 2.0 | 1330 | $1,900 | $1.43 | 43d | 1 | 0.91mi |
| 100 Cavalier Xing Stonecrest, GA | 3.0 | 2.0 | 1558 | $1,990 | $1.28 | 24d | 1 | 1.26mi |
| 3199 Pearce Ct Lithonia, GA | 4.0 | 2.5 | 1700 | $2,035 | $1.20 | 24d | 1 | 1.34mi |
| 5301 W Fairington Pkwy Lithonia, GA | 1.0–3.0 | 1.0–2.0 | 1020 | $1,946 | $1.91 | 1d | 37 | 1.34mi |
Listing history 50 events
-
2026-06-09days on market $199,900 Active 110 DOM
-
2026-06-08days on market $199,900 Active 109 DOM
-
2026-06-07days on market $199,900 Active 108 DOM
-
2026-06-04days on market $199,900 Active 105 DOM
-
2026-06-03days on market $199,900 Active 104 DOM
-
2026-06-02days on market $199,900 Active 103 DOM
-
2026-06-01days on market $199,900 Active 102 DOM
-
2026-05-31days on market $199,900 Active 101 DOM
-
2026-05-11price $199,900 369-char remark
Show marketing remark (369 chars)
Welcome to 3520 Valley Chase Ct in Stonecrest! This 3-bedroom, 2-bath, two-story home offers a functional layout with plenty of living space. The main level features a comfortable living area, a well-sized kitchen, and convenient flow for everyday living and entertaining. Upstairs, you'll find generously sized bedrooms and full baths that provide privacy and comfort.
-
2026-04-18price $204,900 369-char remark
Show marketing remark (369 chars)
Welcome to 3520 Valley Chase Ct in Stonecrest! This 3-bedroom, 2-bath, two-story home offers a functional layout with plenty of living space. The main level features a comfortable living area, a well-sized kitchen, and convenient flow for everyday living and entertaining. Upstairs, you'll find generously sized bedrooms and full baths that provide privacy and comfort.
-
2026-02-19$214,900 New 369-char remark
Show marketing remark (369 chars)
Welcome to 3520 Valley Chase Ct in Stonecrest! This 3-bedroom, 2-bath, two-story home offers a functional layout with plenty of living space. The main level features a comfortable living area, a well-sized kitchen, and convenient flow for everyday living and entertaining. Upstairs, you'll find generously sized bedrooms and full baths that provide privacy and comfort.
-
2024-04-29historical
-
2024-04-29historical
-
2024-04-26status Back On Market
-
2024-04-26status Active
-
2024-04-15status Pending
-
2024-04-09status Under Contract
-
2024-02-20$190,000 Active
-
2024-02-20$190,000 New
-
2023-10-19status Under Contract
-
2023-09-27status Pending Offer Approval
-
2023-09-26historical Active Under Contract
-
2023-09-26historical
-
2023-09-08$195,000 New
-
2023-02-10historical On Hold
-
2023-02-10status Back On Market
-
2023-01-24status Under Contract
-
2023-01-04historical
-
2022-12-30price $205,000
-
2022-12-05price $219,500
-
2022-11-05price $227,001
-
2022-10-10price $239,000
-
2022-09-06$205,000 New
-
2022-09-04$255,000 New
-
2022-06-22price $1,720
-
2022-01-05soldstatus $7,435,817
-
2018-01-22soldstatus $1,273,600
-
2014-03-14price $50,000
-
2014-03-04soldstatus $50,000
-
2014-02-28price $50,000
-
2014-02-27historical
-
2014-02-27historical
-
2014-02-25price $65,000
-
2014-02-25soldstatus $50,000 Sold
-
2014-02-21soldstatus $50,000 Sold
-
2013-12-16status Back On Market
-
2013-12-16status Active
-
2013-09-19historical Pending Approval
-
2013-09-19status Pending Offer Approval
-
2013-09-19price $65,000
ⓘ Source: listings_history table (triggers on properties + properties_extension) + one-shot
backfill from property_details.listing_events for pre-trigger history.
Tax reassessment forecast GA · Resets to sale price
- Current annual tax
- $3,751 · $313/mo
- Projected year-2 tax
- $3,751 · $313/mo
- Expected delta
- $0/yr ($0/mo · 0.0%)
ⓘ Screening estimate from a state-policy table — verify with the county assessor before closing.
Climate risk First Street
- Flood 1/10 Low FEMA zone X (unshaded) · 0% chance over 30 yrs
- Wildfire 3/10 Moderate
- Heat 5/10 Major 6 d/yr ≥106°F today · 15 d/yr by 30 yrs out
- Wind 5/10 Major 24% chance of damaging wind over 30 yrs
- Air quality 5/10 Major 7 unhealthy d/yr today · 10 by 30 yrs out
Nearby sold comps map
Loading sold comps map…
Walkable amenities ~0.75 mi
Loading nearby amenities…
Taxation est. · year 1
- Rental income
- $23,436
- − Mortgage interest
- −$11,198
- − Property taxes
- −$3,751
- − Insurance
- −$1,000
- − Repairs & maintenance
- −$1,875
- − Management
- −$1,875
- − Depreciation
- −$5,815
- Taxable loss
- −$2,077
- Est. tax savings @ 24.0%
- +$499
- After-tax cash flow
- $1,683/yr
For passive investors: Depreciation is non-cash, so a rental often shows a tax loss while cash-flowing — sheltering income. Rental losses are passive: they offset passive income freely, and up to $25,000/yr can offset ordinary (W-2) income if you actively participate and your MAGI is under $100k (phasing out to $0 by $150k); unused losses carry forward. On sale, claimed depreciation is recaptured at up to 25%, and gains may owe capital-gains tax (a 1031 exchange can defer both). Figures are a year-1 estimate at your 24.0% rate — not tax advice; consult a CPA.
Schools (NCES district)
- District
- Dekalb County
- NCES district ID
- 1301740
- Math proficiency
- 19% ▼ -12.00%
- Reading proficiency
- 28% ▼ -7.00%
- Median HH income
- $51,448
- Composite
- 20.92/100
- National rank
- #8482
- State rank
- #125 of 174 in GA
Livability — Stonecrest
No livability data for this city. (Only ~50 U.S. cities are tracked.)
Census & demographics
- Census place
- Stonecrest, GA
- County
- Dekalb County · 782,738 people
- City population
- 106,165
- Metro
- Atlanta-Sandy Springs-Alpharetta, GA
- Population (ZIP)
- 43,776
- Household income
- $73,694
- Rent vs Own
- Severe rent burden
- 1168.0
Population outlook (DeKalb County) Hauer SSP2
- Today (2025)
- 839,977 people
- By 2030
- 891,768 · +6.2%
- By 2040
- 988,894 · +17.7%
- By 2050
- 1,074,583 · +27.9%
- By 2075
- 1,245,026 · +48.2%
- By 2100
- 1,303,135 · +55.1%
Race, ethnicity, and origin ACS 2023
- Neighborhood character
- Predominantly Black (84%)
- Race & ethnicity
- Black 84% Two or more races 10% Hispanic / Latino 5% White 4% Asian 1%
- Foreign-born
- 12% · Canada, China
- Languages at home
- 90% English-only · Spanish 5% French/Haitian/Cajun 1% Other Indo-European 0%
Political lean MEDSL · DeKalb
- 2024 margin
- Solid D (+64.8) · D 81.9% · R 17.1% · Other 1.0%
- 2008→2024 swing
- +6.1pp toward D · 2008: 58.6pp · 2024: 64.8pp
- All cycles
- 2024: D+64.8 2020: D+67.4 2016: D+64.8 2012: D+56.8 2008: D+58.6
Not yet ingested
- Civics
- —
Market trends
- HPI YoY
- ▼ -74.98%
- Current HPI
- 192.8328
- Rent YoY
- ▲ 4.60%
- Metro
- Atlanta-Sandy Springs-Alpharetta, GA
- State GDP YoY
- ▲ 2.66%
- F500 in state
- 28
Industry mix (Fortune 500 HQ in GA)
| Industry | F500 HQs | Revenue |
|---|---|---|
| Paper / Packaging | 2 | $29B |
|
||
| Retail | 1 | $160B |
|
||
| Transportation / Logistics | 1 | $91B |
|
||
| Airlines | 1 | $62B |
|
||
| Consumer Goods | 1 | $47B |
|
||
| Utilities | 1 | $25B |
|
||
Price history
+246.4% since first listed50 events — show timeline
- 2026-05-11 Price Changed $199,900 GAMLS
- 2026-04-18 Price Changed $204,900 GAMLS
- 2026-02-19 Listed $214,900 GAMLS
- 2024-04-29 Listing Removed — GAMLS
- 2024-04-29 Listing Removed — FMLS
- 2024-04-26 Relisted — GAMLS
- 2024-04-26 Relisted — FMLS
- 2024-04-15 Pending — FMLS
- 2024-04-09 Pending — GAMLS
- 2024-02-20 Listed $190,000 GAMLS
- 2024-02-20 Listed $190,000 FMLS
- 2023-10-19 Pending — GAMLS
- 2023-09-27 Pending — GAMLS
- 2023-09-26 Contingent — GAMLS
- 2023-09-26 Listing Removed — GAMLS
- 2023-09-08 Listed $195,000 GAMLS
- 2023-02-10 Delisted — GAMLS
- 2023-02-10 Relisted — GAMLS
- 2023-01-24 Pending — GAMLS
- 2023-01-04 Listing Removed — GAMLS
- 2022-12-30 Price Changed $205,000 GAMLS
- 2022-12-05 Price Changed $219,500 GAMLS
- 2022-11-05 Price Changed $227,001 GAMLS
- 2022-10-10 Price Changed $239,000 GAMLS
- 2022-09-06 Listed $205,000 GAMLS
- 2022-09-04 Listed $255,000 GAMLS
- 2022-06-22 Price Changed $1,720 RENT.
- 2022-01-05 Sold (Public Records) $7,435,817 Public Records
- 2018-01-22 Sold (Public Records) $1,273,600 Public Records
- 2014-03-14 Price Changed $50,000 GAMLS
- 2014-03-04 Sold (Public Records) $50,000 Public Records
- 2014-02-28 Price Changed $50,000 FMLS
- 2014-02-27 Listing Removed — GAMLS
- 2014-02-27 Listing Removed — FMLS
- 2014-02-25 Sold (MLS) $50,000 FMLS
- 2014-02-25 Price Changed $65,000 FMLS
- 2014-02-21 Sold (MLS) $50,000 GAMLS
- 2013-12-16 Relisted — GAMLS
- 2013-12-16 Relisted — FMLS
- 2013-09-19 Contingent — GAMLS
- 2013-09-19 Pending — FMLS
- 2013-09-19 Price Changed $65,000 GAMLS
- 2013-09-11 Relisted — FMLS
- 2013-09-06 Pending — FMLS
- 2013-08-26 Listed $65,000 GAMLS
- 2013-08-26 Listed $65,000 FMLS
- 2004-12-09 Sold (Public Records) $103,500 Public Records
- 1996-09-03 Sold (Public Records) $60,000 Public Records
- 1995-04-27 Sold (Public Records) $57,700 Public Records
- 1995-03-07 Sold (Public Records) $57,700 Public Records
Property tax history
+7.4%/yrLatest (2025): $3,751 · +0.7% YoY. Source: county tax records.
Cash-flow waterfall
monthlySold comps — $/sqft
last 12 mo · ≤1 miLoading sold comps…