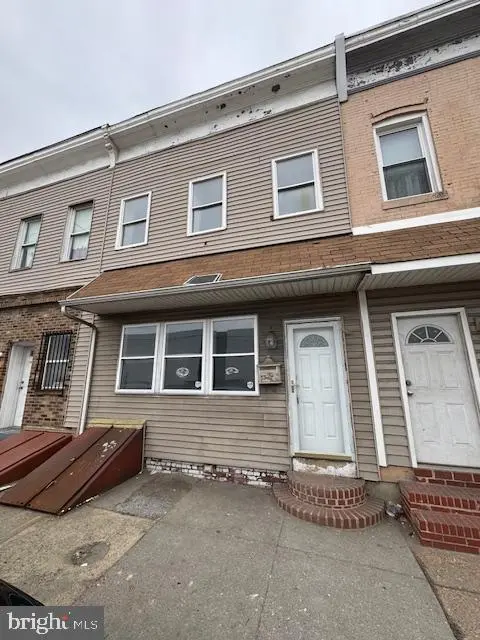
4620 Curtis Ave · Baltimore, MD
Flood risk 1/10 · Minimal
- FEMA flood zone
- X (unshaded)
- Chance of flooding over 30 yrs
- 0.0%
- Est. flood insurance / yr
- $473 – $860
Fire risk 1/10 · Minimal
- Est. fire insurance / yr
- $755 – $1,403
Heat risk 8/10 · Major
- Hot days now (above 103°F)
- 7 days/yr
- Hot days in 30 yrs
- 15 days/yr
Wind risk 6/10 · Moderate
- Chance of severe wind over 30 yrs
- 27.0%
Air-quality risk 4/10 · Minor
- Unhealthy air days now
- 5 days/yr
- Unhealthy air days in 30 yrs
- 7 days/yr
Risk factors via First Street. Map © Google.
Why this score? — see what drove the B- grade
The composite is a weighted blend of 9 inputs, each scored 0–100. Each bar is that input's sub-score; the figure is the points it added to the 100-point composite (weight × sub-score).
- Cash flow +30.0/30.0
- DSCR +10.0/10.0
- 1% rule +9.8/10.0
- Appreciation +8.9/10.0
- Livability +3.8/5.0
- Rent growth +2.5/5.0
- Condition / age +2.5/5.0
- Schools +1.0/10.0
- ARV discount +0.0/15.0
$150,000
🖨 Deal sheet 📄 Offer letter ✓ Due diligence
Listing remarks MLS
Updated 4 bed 1 bath townhome in Curtis Bay now available. Home is tenant occupied by month to month tenants who are paying 1500 per month and are current on rent.
Key facts
- Built 1900
- Listed 61 days
Neighborhood map
What this means for you Summary
Snapshot
- This is a 4-bed/2.0-bath townhouse listed at $150k.
Deal economics
- At list price, monthly cash flow is $845 ($10k/yr) — positive.
- The deal already cash-flows at list — no discount required.
- Meets the 1% rule at list price ($2k rent vs $150k).
- Recommended offer: $141k (6.0% below list) — sets the bar for market timing.
- Cap rate 13.1% vs local median 6.0% in Baltimore — top-decile yield for the area; either an underpriced asset or a hidden risk that comps aren't pricing in. Stress-test before assuming the spread holds.
Location & tenants
- Location reads 76/100 on livability (#90 in MD, #3,396 nationally) — a middle-class / working-renter tenant base. Strengths: amenities A+, commute A+, housing A+; Watch: schools D, crime F.
- Baltimore City Public Schools (urban): math 7% / reading 16% proficiency, ranked #24 of 24 in MD (top 100%) — low school quality limits family demand, transient renter base, plan for 1-2y turnover; 79% free/reduced lunch — lower-income household profile, screen leases tightly.
- Market conditions: 45 active listings in the ZIP; 3 comparable units currently listed for rent nearby; rentals at typical pace (median 24d on market — plan ~3-4 weeks tenant-placement turnaround); 1,273 units permitted in Baltimore city in 2024 (1,104 in 5+ unit buildings).
Forward outlook
- In year one you build about $13k of equity ($1k loan paydown + $12k appreciation (7.8% local appreciation)).
- Baltimore County population projected to shrink 4% by 2050 — rents likely to lag national; underwrite the cash flow, not the appreciation.
- At projected returns (7.8% appreciation + 3.0% rent growth), your $42k cash investment doubles in ~2 years — after that, you're playing with house money.
- By year 3, paydown + projected appreciation supports a ~$32k cash-out refi (75% LTV) — recoverable capital for the next deal without selling this one.
Negotiation context
- It's been on market 61 days — a 6% lower offer ($141k) is reasonable based on typical stale-listing flexibility.
- Current owner paid $60k; list at $150k implies a 148% gain — meaningful room to come down on a strong offer.
Risks & watch-outs
- Watch-outs: built in 1900 — expect roof / HVAC / electrical / plumbing capex.
- Climate carrying-cost: major wind risk, 27% chance of damaging wind over 30y; extreme-heat days projected 7→15/yr by 2055 (HVAC capex compounding) — expect insurance premiums to compound above CPI over the hold.
Questions for the listing agent
- It's been on market 61 days. Have you received any prior offers? Is the seller open to a 6% concession, seller financing, or rate buy-down credit?
- Built in 1900 — when were the roof, HVAC, electrical panel, plumbing, and water heater last replaced?
- Why hasn't it sold? Are there any deal-killer items the seller is aware of (foundation, flood, title, zoning, code violations)?
- Is there a deadline driving the sale (1031 exchange, divorce, estate, relocation)? That informs how much negotiation room exists.
- Schools are D-rated, which usually means shorter tenancies and higher turnover. Who's the typical renter profile here, and what's been the actual vacancy rate?
- Crime grade is F in this area — have there been break-ins, vandalism, or insurance claims at this property in the last 3 years? What carrier currently insures it and at what premium?
- What's the average days-on-market for RENTAL listings here right now (not sales)? A rising rental-DOM trend means longer vacancies and softer asking-rent achievability than the comps imply.
- What's the recent tenant-quality profile in this submarket — average credit score on applications, eviction rate, late-payment / NSF rate, and stable-employment percentage? A property-management company in the area should have these aggregated.
- How much new for-sale + rental construction is in the pipeline within 1–3 miles? Heavy new supply typically softens prices + rents 12–24 months out; constrained supply supports both.
Investment metrics
- 1% rule
- 1.48% ✓
- Cap rate
- 13.05%
- Cash-on-cash
- 24.14%
- DSCR
- 2.07
- GRM
- 5.6
CMA / ARV
- ARV (median comp)
- $119,171
- List price
- $150,000
- Delta
- 25.87%
- Verdict
- OVERPRICED
- Comps
- 20 within 1.0 mi
Show comp detail 8 sales within ~0.75 mi
| Address | Dist | Beds/Ba | Sqft | Sold | Price | $/sf | Match |
|---|---|---|---|---|---|---|---|
| 1604 Hazel | 0.17mi | 3/2.0 (-1) | 1,680 (-7%) | 22mo | $35,000 | $21 | 58 |
| 4026 Pennington Ave | 0.33mi | 3/2.5 (-1) | 1,680 (-7%) | 12mo | $189,900 | $113 | 57 |
| 3930 Pennington | 0.38mi | 3/1.0 (-1) | 1,701 (-6%) | 13mo | $115,000 | $68 | 53 |
| 1326 Tompkins St | 0.40mi | 3/2.0 (-1) | 1,554 (-14%) | 3mo | $205,000 | $132 | 51 |
| 3932 Pennington Ave | 0.37mi | 4/2.0 | 1,554 (-14%) | 14mo | $102,000 | $66 | 48 |
| 3623 Fairhaven Ave | 0.55mi | 4/2.5 | 1,640 (-9%) | 14mo | $149,900 | $91 | 45 |
| 1102 Inner Cir | 0.60mi | 3/1.5 (-1) | 1,599 (-11%) | 8mo | $205,000 | $128 | 40 |
| 1321 E Patapsco Ave | 0.65mi | 3/3.0 (-1) | 1,536 (-15%) | 16mo | $159,000 | $104 | 23 |
Match score weights: distance 35% · size 25% · config 20% · recency 20%. Top-matched comps best support the ARV.
Projected returns pro-forma
7.75% appreciation · 3.0% rent growth · sell at horizon
- IRR
- 38.7%
- Equity multiple
- 3.69×
- Total profit
- $113,156
- Equity at exit
- $111,415
- IRR
- 34.7%
- Equity multiple
- 7.86×
- Total profit
- $288,190
- Equity at exit
- $218,776
Cash invested: $42,000 (down + closing). Projections, not guarantees.
Landlord ↔ Tenant lean methodology
- Overall (CITY)
- 12 Strongly Tenant-Friendly
- State Maryland
- 27 Tenant-Leaning · D+14
- County
- — inherits STATE
- City Baltimore
- 12 Strongly Tenant-Friendly · D+58
ZIP-level market 21226
- Home prices YoY
- 2.5%
- Active inventory
- 45
- Price-to-rent
- 5.6×
Monthly cashflow live
- Estimated rent
- $2,216 medium interval (Pro) →
- Mortgage (P&I)
- −$787
- Tax from tax record
- −$57 /mo · $681/yr
- Insurance
- −$62
- HOA
- −$0
- Vacancy / Maint / Mgmt
- −$465
- Net cashflow
- $845
Break-even live
UW: 25.0% down · 7.5% · 30yr · 1.5% tax · 5.0% vac · 8.0% maint · 8.0% mgmt
Financing live
Cash to close
- Down payment
- $37,500
- Closing costs
- $4,500
- Reserves months
- —
- Total cash needed
- —
Loan-product check · same deal, 3 products live
Conventional
25% down · 7.5% · 30yr
- Down + closing
- —
- Monthly P&I
- —
- Monthly cashflow
- —
- DSCR
- —
- Eligible?
- —
Personal DTI + credit; lowest rate.
DSCR
20% down · 8.5% · 30yr
- Down + closing
- —
- Monthly P&I
- —
- Monthly cashflow
- —
- DSCR
- —
- Eligible?
- —
No personal income docs; deal must DSCR.
Hard money
10% down · 12.0% · 12mo
- Down + closing
- —
- Monthly P&I
- —
- Monthly cashflow
- —
- DSCR
- —
- Eligible?
- —
Short-term bridge; refi at stabilization.
Rent comps 3 comps
| Address | Beds | Baths | Sqft | Rent | $/sqft | DOM | Units | Dist |
|---|---|---|---|---|---|---|---|---|
| 3822 6th St Brooklyn, MD | 3.0 | 3.0 | 1580 | $1,850 | $1.17 | 23d | 1 | 1.13mi |
| 3544 4th St Brooklyn, MD | 4.0 | 2.5 | 1800 | $1,940 | $1.08 | 23d | 1 | 1.39mi |
| 166 Drydock Way Unit 1 Baltimore, MD | 3.0 | 2.5 | 1980 | $3,000 | $1.52 | 43d | 1 | 1.48mi |
Listing history 16 events
-
2026-06-18days on market $150,000 Active 61 DOM
-
2026-06-17days on market $150,000 Active 60 DOM
-
2026-06-16days on market $150,000 Active 59 DOM
-
2026-06-15days on market $150,000 Active 58 DOM
-
2026-06-13days on market $150,000 Active 56 DOM
-
2026-06-09days on market $150,000 Active 52 DOM
-
2026-06-08days on market $150,000 Active 51 DOM
-
2026-06-07days on market $150,000 Active 50 DOM
-
2026-06-04days on market $150,000 Active 47 DOM
-
2026-06-03days on market $150,000 Active 46 DOM
-
2026-06-02days on market $150,000 Active 45 DOM
-
2026-06-01days on market $150,000 Active 44 DOM
-
2026-05-31days on market $150,000 Active 43 DOM
-
2026-04-18$150,000 Active 163-char remark
Show marketing remark (163 chars)
Updated 4 bed 1 bath townhome in Curtis Bay now available. Home is tenant occupied by month to month tenants who are paying 1500 per month and are current on rent.
-
1995-02-07soldstatus $60,500
-
1989-12-19soldstatus $45,000
ⓘ Source: listings_history table (triggers on properties + properties_extension) + one-shot
backfill from property_details.listing_events for pre-trigger history.
Tax reassessment forecast MD · Partial reset (capped growth)
- Current annual tax
- $681 · $57/mo
- Projected year-2 tax
- $1,158 · $97/mo
- Expected delta
- +$477/yr (+$40/mo · 70.0%)
ⓘ Screening estimate from a state-policy table — verify with the county assessor before closing.
Climate risk First Street
- Flood 1/10 Low FEMA zone X (unshaded) · 0% chance over 30 yrs
- Wildfire 1/10 Low
- Heat 8/10 Severe 7 d/yr ≥103°F today · 15 d/yr by 30 yrs out
- Wind 6/10 Major 27% chance of damaging wind over 30 yrs
- Air quality 4/10 Moderate 5 unhealthy d/yr today · 7 by 30 yrs out
Nearby sold comps map
Loading sold comps map…
Walkable amenities ~0.75 mi
Loading nearby amenities…
Taxation est. · year 1
- Rental income
- $26,592
- − Mortgage interest
- −$8,402
- − Property taxes
- −$681
- − Insurance
- −$750
- − Repairs & maintenance
- −$2,127
- − Management
- −$2,127
- − Depreciation
- −$4,364
- Taxable income
- $8,140
- Est. tax owed @ 24.0%
- −$1,954
- After-tax cash flow
- $8,183/yr
For passive investors: Depreciation is non-cash, so a rental often shows a tax loss while cash-flowing — sheltering income. Rental losses are passive: they offset passive income freely, and up to $25,000/yr can offset ordinary (W-2) income if you actively participate and your MAGI is under $100k (phasing out to $0 by $150k); unused losses carry forward. On sale, claimed depreciation is recaptured at up to 25%, and gains may owe capital-gains tax (a 1031 exchange can defer both). Figures are a year-1 estimate at your 24.0% rate — not tax advice; consult a CPA.
Schools (NCES district)
- District
- Baltimore City Public Schools
- NCES district ID
- 2400090
- Math proficiency
- 7% ▼ -9.00%
- Reading proficiency
- 16% ▼ -5.00%
- Median HH income
- $42,108
- Composite
- 10.08/100
- National rank
- #9805
- State rank
- #24 of 24 in MD
Livability — Baltimore
- Score
- 76/100
- State rank
- #90
- US rank
- #3396
Category grades
Schools grade is shown separately in the Schools card above.
Census & demographics
- Census place
- Baltimore, MD
- City population
- 588,727
- Population (ZIP)
- 6,593
Population outlook (Baltimore County) Hauer SSP2
- Today (2025)
- 624,249 people
- By 2030
- 621,541 · -0.4%
- By 2040
- 609,756 · -2.3%
- By 2050
- 597,249 · -4.3%
- By 2075
- 552,236 · -11.5%
- By 2100
- 513,934 · -17.7%
Race, ethnicity, and origin ACS 2023
- Neighborhood character
- Diverse neighborhood (Simpson 0.61)
- Race & ethnicity
- White 59% Black 18% Two or more races 13% Hispanic / Latino 8% Asian 4%
- Hispanic origin (detail)
- Mexican 4% Puerto Rican 3%
- Common ancestry
- Slovak 7% Romanian 2% Scotch-Irish 1%
- Foreign-born
- 7% · Canada, Jamaica
- Languages at home
- 91% English-only · Spanish 7% Tagalog/Filipino 1% Other Indo-European 1%
Political lean MEDSL · Baltimore
- 2024 margin
- Solid D (+73.0) · D 85.2% · R 12.2% · Other 2.6%
- 2008→2024 swing
- -2.5pp toward R · 2008: 75.5pp · 2024: 73.0pp
- All cycles
- 2024: D+73.0 2020: D+76.6 2016: D+74.6 2012: D+76.4 2008: D+75.5
Not yet ingested
- Civics
- —
Market trends
- HPI YoY
- ▲ 7.75%
- Current HPI
- 318.79
- Rent YoY
- —
- Metro
- —
- State GDP YoY
- ▲ 2.97%
- F500 in state
- 12
Industry mix (Fortune 500 HQ in MD)
| Industry | F500 HQs | Revenue |
|---|---|---|
| Aerospace / Defense | 1 | $71B |
|
||
| Utilities | 1 | $25B |
|
||
| Hotels | 1 | $24B |
|
||
| Consumer Goods | 1 | $7B |
|
||
| Real Estate | 1 | $6B |
|
||
| Chemicals | 1 | $2B |
|
||
Price history
+233.3% since first listed3 events — show timeline
- 2026-04-18 Listed $150,000 BRIGHT MLS
- 1995-02-07 Sold (Public Records) $60,500 Public Records
- 1989-12-19 Sold (Public Records) $45,000 Public Records
Property tax history
-3.9%/yrLatest (2025): $681 · +31.8% YoY. Source: county tax records.
Cash-flow waterfall
monthlySold comps — $/sqft
last 12 mo · ≤1 miLoading sold comps…