12303 White Cap Ln · Old Jamestown, MO
Flood risk No data
- FEMA flood zone
- —
- Chance of flooding over 30 yrs
- —
- Est. flood insurance / yr
- —
Fire risk No data
- Est. fire insurance / yr
- —
Heat risk No data
- Hot days now (above threshold)
- —
- Hot days in 30 yrs
- —
Wind risk No data
- Chance of severe wind over 30 yrs
- —
Air-quality risk No data
- Unhealthy air days now
- —
- Unhealthy air days in 30 yrs
- —
Risk factors via First Street. Map © Google.
Why this score? — see what drove the B- grade
The composite is a weighted blend of 9 inputs, each scored 0–100. Each bar is that input's sub-score; the figure is the points it added to the 100-point composite (weight × sub-score).
- Cash flow +23.8/30.0
- Appreciation +10.0/10.0
- 1% rule +8.9/10.0
- DSCR +7.7/10.0
- ARV discount +7.5/15.0
- Rent growth +4.4/5.0
- Livability +3.3/5.0
- Condition / age +2.5/5.0
- Schools +1.7/10.0
$129,900
🖨 Deal sheet 📄 Offer letter ✓ Due diligence
Listing remarks
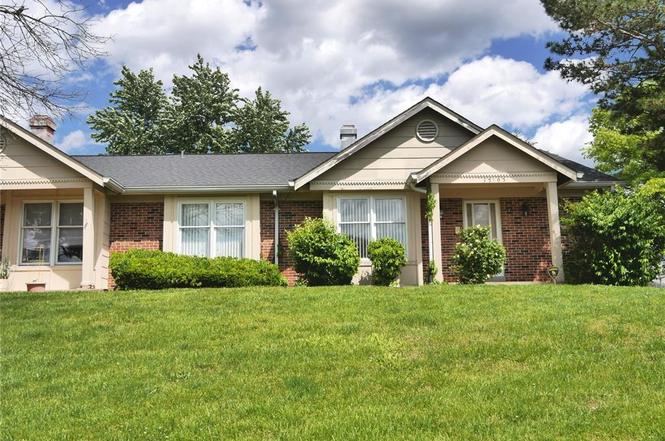
This impeccably maintained 2-bedroom, 3-bath ranch-style condominium offers over 2,000 square feet of comfortable living space, including a beautifully finished lower level. Nestled in the desirable Paddock Lake community, you will enjoy scenic lake views as you arrive home each day. This property features a rear-entry 2-car garage situated at the end of a quiet cul-de-sac, and ample guest parking on the large grassy area in front. Inside, the welcoming entry foyer opens to a bright and spacious living and dining area, complete with a cozy wood-burning fireplace and charming box window—add some pillows for a reading nook or sitting area. Stylish luxury vinyl plank flooring has been re
Key facts
- Walk-in closet
- Finished basement
- View of the lake
Tags
Neighborhood map
What this means for you Summary
Snapshot
- This is a 2-bed/2.0-bath condo listed at $130k.
Deal economics
- At list price, monthly cash flow is $250 ($3k/yr) — positive.
- The deal already cash-flows at list — no discount required.
- Meets the 1% rule at list price ($2k rent vs $130k).
- Cap rate 8.6% vs local median 5.3% in Old Jamestown — top-decile yield for the area; either an underpriced asset or a hidden risk that comps aren't pricing in. Stress-test before assuming the spread holds.
Location & tenants
- Location reads 66/100 on livability (#247 in MO) — a middle-class / working-renter tenant base. Strengths: employment A+, housing A+, cost of living A; Watch: amenities F, commute F, health & safety F.
- Hazelwood (suburban): math 11% / reading 26% proficiency, ranked #306 of 324 in MO (top 94%) — low school quality limits family demand, transient renter base, plan for 1-2y turnover.
- Market conditions: Rents rising fast (+7.5%/yr); 218 active listings in the ZIP; 6 comparable units currently listed for rent nearby; rentals at typical pace (median 22d on market — plan ~3-4 weeks tenant-placement turnaround); 920 units permitted in St. Louis County in 2024 (250 in 5+ unit buildings).
- This rent runs 32% of the median local income ($67k/yr) — at the standard rent-burdened threshold; future hikes will face affordability resistance.
Forward outlook
- In year one you build about $14k of equity ($898 loan paydown + $13k appreciation (10.0% local appreciation)).
- At projected returns (10.0% appreciation + 7.5% rent growth), your $36k cash investment doubles in ~3 years — after that, you're playing with house money.
- By year 3, paydown + projected appreciation supports a ~$35k cash-out refi (75% LTV) — recoverable capital for the next deal without selling this one.
Negotiation context
- Only 2 days on market — expect competitive offers; lowballing is unlikely to land.
- Current owner paid $105k; 24% above their basis — modest negotiation headroom, anchor on the comps not their cost.
Questions for the listing agent
- What does the HOA fee cover, when was the last increase, and are there any pending special assessments or reserve-fund shortfalls?
- Any open or pending special assessments — roof, HVAC, plumbing, elevator, façade? What's the per-unit balance and payoff schedule, and is the seller paying it off at close or rolling it to the buyer?
- Is there a deadline driving the sale (1031 exchange, divorce, estate, relocation)? That informs how much negotiation room exists.
- What's the average days-on-market for RENTAL listings here right now (not sales)? A rising rental-DOM trend means longer vacancies and softer asking-rent achievability than the comps imply.
- What's the recent tenant-quality profile in this submarket — average credit score on applications, eviction rate, late-payment / NSF rate, and stable-employment percentage? A property-management company in the area should have these aggregated.
- How much new apartment / multifamily construction is in the pipeline within 1–3 miles? Heavy new supply (>2% of stock underway) typically softens rents 12–24 months out; light construction supports rent growth.
Investment metrics
- 1% rule
- 1.39% ✓
- Cap rate
- 8.60%
- Cash-on-cash
- 8.26%
- DSCR
- 1.37
- GRM
- 6.0
CMA / ARV
No comps found within radius.
Projected returns pro-forma
10.0% appreciation · 7.51% rent growth · sell at horizon
- IRR
- 32.8%
- Equity multiple
- 3.62×
- Total profit
- $95,455
- Equity at exit
- $117,024
- IRR
- 30.2%
- Equity multiple
- 8.97×
- Total profit
- $289,788
- Equity at exit
- $252,367
Cash invested: $36,372 (down + closing). Projections, not guarantees.
Landlord ↔ Tenant lean methodology
- Overall (STATE)
- 81 Strongly Landlord-Friendly
- State Missouri
- 81 Strongly Landlord-Friendly · R+10
- County
- — inherits STATE
- City
- — inherits STATE
ZIP-level market 63033
- Home prices YoY
- 2.5%
- Rents YoY
- 7.5%
- Active inventory
- 218
- Price-to-rent
- 6.0×
Monthly cashflow live
- Estimated rent
- $1,806 high interval (Pro) →
- Mortgage (P&I)
- −$681
- Tax from tax record
- −$144 /mo · $1,734/yr
- Insurance
- −$54
- HOA
- −$297
- Vacancy / Maint / Mgmt
- −$379
- Net cashflow
- $250
Break-even live
UW: 25.0% down · 7.5% · 30yr · 1.5% tax · 5.0% vac · 8.0% maint · 8.0% mgmt
Financing live
Cash to close
- Down payment
- $32,475
- Closing costs
- $3,897
- Reserves months
- —
- Total cash needed
- —
Loan-product check · same deal, 3 products live
Conventional
25% down · 7.5% · 30yr
- Down + closing
- —
- Monthly P&I
- —
- Monthly cashflow
- —
- DSCR
- —
- Eligible?
- —
Personal DTI + credit; lowest rate.
DSCR
20% down · 8.5% · 30yr
- Down + closing
- —
- Monthly P&I
- —
- Monthly cashflow
- —
- DSCR
- —
- Eligible?
- —
No personal income docs; deal must DSCR.
Hard money
10% down · 12.0% · 12mo
- Down + closing
- —
- Monthly P&I
- —
- Monthly cashflow
- —
- DSCR
- —
- Eligible?
- —
Short-term bridge; refi at stabilization.
Rent comps 6 comps
| Address | Beds | Baths | Sqft | Rent | $/sqft | DOM | Units | Dist |
|---|---|---|---|---|---|---|---|---|
| 12810 Verwood Dr Florissant, MO | 3.0 | 2.0 | 1408 | $2,026 | $1.44 | 44d | 1 | 0.48mi |
| 6431 Brown Fox Dr Florissant, MO | 3.0 | 2.0 | 1105 | $1,905 | $1.72 | 22d | 1 | 0.72mi |
| 12887 Fox Haven Dr Florissant, MO | 3.0 | 2.0 | 1135 | $1,750 | $1.54 | 44d | 1 | 0.80mi |
| 5454 Misty Crossing Ct Florissant, MO | 3.0 | 3.0 | 1518 | $2,196 | $1.45 | 7d | 1 | 1.21mi |
| 11969 Continental Dr St. Louis, MO | 2.0–3.0 | 1.5 | 1075 | $1,035 | $0.96 | 2d | 3 | 1.40mi |
| 11592 Las Ladera Dr Florissant, MO | 3.0 | 2.0 | 986 | $1,616 | $1.64 | 7d | 1 | 1.42mi |
HOA detail condo
- Monthly dues
- $297 · $3,564/yr
- Assessments
- None detected in remarks — confirm with the listing agent.
Listing history 12 events
-
2026-06-18days on market $129,900 Active 2 DOM
-
2026-06-17pricestatusdays on market $129,900 Active 1 DOM
-
2026-04-07price $134,900
-
2026-03-30price $144,900
-
2026-03-12price $149,900
-
2026-02-28$159,900 Active
-
2026-02-27historical
-
2025-12-03historical
-
2002-06-14soldstatus $105,000
-
1996-10-28soldstatus
-
1994-01-11soldstatus
-
1989-10-01soldstatus $105,000
ⓘ Source: listings_history table (triggers on properties + properties_extension) + one-shot
backfill from property_details.listing_events for pre-trigger history.
Tax reassessment forecast MO · Resets to sale price
- Current annual tax
- $1,734 · $144/mo
- Projected year-2 tax
- $1,734 · $144/mo
- Expected delta
- $0/yr ($0/mo · 0.0%)
ⓘ Screening estimate from a state-policy table — verify with the county assessor before closing.
Nearby sold comps map
Loading sold comps map…
Walkable amenities ~0.75 mi
Loading nearby amenities…
Taxation est. · year 1
- Rental income
- $21,677
- − Mortgage interest
- −$7,276
- − Property taxes
- −$1,734
- − Insurance
- −$650
- − Repairs & maintenance
- −$1,734
- − Management
- −$1,734
- − HOA
- −$3,564
- − Depreciation
- −$3,779
- Taxable income
- $1,206
- Est. tax owed @ 24.0%
- −$289
- After-tax cash flow
- $2,714/yr
For passive investors: Depreciation is non-cash, so a rental often shows a tax loss while cash-flowing — sheltering income. Rental losses are passive: they offset passive income freely, and up to $25,000/yr can offset ordinary (W-2) income if you actively participate and your MAGI is under $100k (phasing out to $0 by $150k); unused losses carry forward. On sale, claimed depreciation is recaptured at up to 25%, and gains may owe capital-gains tax (a 1031 exchange can defer both). Figures are a year-1 estimate at your 24.0% rate — not tax advice; consult a CPA.
Schools (NCES district)
- District
- Hazelwood
- NCES district ID
- 2913830
- Math proficiency
- 11% ▼ -13.00%
- Reading proficiency
- 26% ▼ -6.00%
- Median HH income
- $51,621
- Composite
- 16.77/100
- National rank
- #9156
- State rank
- #306 of 324 in MO
Livability — Old Jamestown
- Score
- 66/100
- State rank
- #247
- US rank
- #12156
Category grades
Schools grade is shown separately in the Schools card above.
Census & demographics
- County
- Saint Louis County · 888,823 people
- City population
- 19,557
- Metro
- St. Louis, MO-IL
- Population (ZIP)
- 43,056
- Household income
- $66,776
- Rent vs Own
- Severe rent burden
- 1429.0
Population outlook (St. Louis County) Hauer SSP2
- Today (2025)
- 1,025,227 people
- By 2030
- 1,028,023 · +0.3%
- By 2040
- 1,020,940 · -0.4%
- By 2050
- 1,007,280 · -1.8%
- By 2075
- 987,277 · -3.7%
- By 2100
- 921,984 · -10.1%
Race, ethnicity, and origin ACS 2023
- Neighborhood character
- Predominantly Black (71%)
- Race & ethnicity
- Black 71% White 23% Two or more races 4% Hispanic / Latino 1%
- Common ancestry
- Romanian 1% Lithuanian 1% Italian 1%
- Foreign-born
- 3% · Canada, Vietnam
- Languages at home
- 95% English-only · Spanish 1% French/Haitian/Cajun 1%
Political lean MEDSL · St. Louis
- 2024 margin
- Strong D (+23.4) · D 60.8% · R 37.4% · Other 1.7%
- 2008→2024 swing
- +3.5pp toward D · 2008: 19.9pp · 2024: 23.4pp
- All cycles
- 2024: D+23.4 2020: D+24.0 2016: D+16.2 2012: D+13.7 2008: D+19.9
Not yet ingested
- Civics
- —
Market trends
- HPI YoY
- ▲ 13.78%
- Current HPI
- 570.6
- Rent YoY
- ▲ 7.51%
- Metro
- St. Louis, MO-IL
- State GDP YoY
- ▲ 1.84%
- F500 in state
- 20
Industry mix (Fortune 500 HQ in MO)
| Industry | F500 HQs | Revenue |
|---|---|---|
| Healthcare | 1 | $163B |
|
||
| Insurance | 1 | $21B |
|
||
| Industrial Technology | 1 | $17B |
|
||
| Retail | 1 | $16B |
|
||
| Industrial Distribution | 1 | $10B |
|
||
| Utilities | 1 | $9B |
|
||
Price history
+28.5% since first listed10 events — show timeline
- 2026-04-07 Price Changed $134,900 MARIS as Distributed by MLS Grid
- 2026-03-30 Price Changed $144,900 MARIS as Distributed by MLS Grid
- 2026-03-12 Price Changed $149,900 MARIS as Distributed by MLS Grid
- 2026-02-28 Listed $159,900 MARIS as Distributed by MLS Grid
- 2026-02-27 Coming Soon — MARIS as Distributed by MLS Grid
- 2025-12-03 Coming Soon — MARIS as Distributed by MLS Grid
- 2002-06-14 Sold (Public Records) $105,000 Public Records
- 1996-10-28 Sold (Public Records) — Public Records
- 1994-01-11 Sold (Public Records) — Public Records
- 1989-10-01 Sold (Public Records) $105,000 Public Records
Property tax history
+2.7%/yrLatest (2022): $1,734 · +5.6% YoY. Source: county tax records.
Cash-flow waterfall
monthlySold comps — $/sqft
last 12 mo · ≤1 miLoading sold comps…