 Triplex
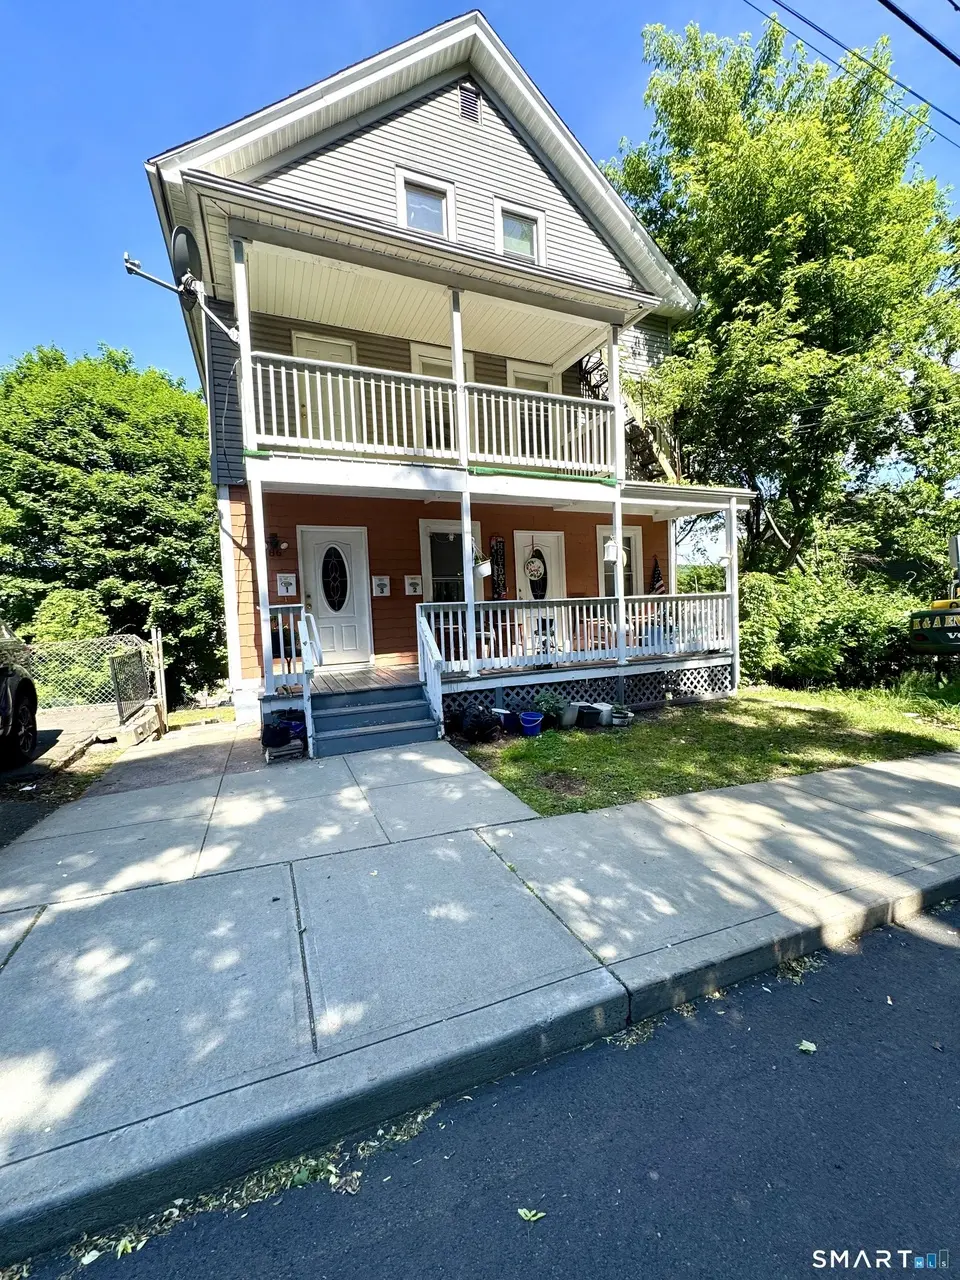
86 Maple St · Meriden, CT
Flood risk 1/10 · Minimal
- FEMA flood zone
- X (unshaded)
- Chance of flooding over 30 yrs
- 0.0%
- Est. flood insurance / yr
- $473 – $860
Fire risk 1/10 · Minimal
- Est. fire insurance / yr
- $829 – $1,539
Heat risk 6/10 · Moderate
- Hot days now (above 98°F)
- 7 days/yr
- Hot days in 30 yrs
- 17 days/yr
Wind risk 6/10 · Moderate
- Chance of severe wind over 30 yrs
- 27.0%
Air-quality risk 4/10 · Minor
- Unhealthy air days now
- 3 days/yr
- Unhealthy air days in 30 yrs
- 5 days/yr
Risk factors via First Street. Map © Google.
Why this score? — see what drove the B- grade
The composite is a weighted blend of 9 inputs, each scored 0–100. Each bar is that input's sub-score; the figure is the points it added to the 100-point composite (weight × sub-score).
- Cash flow +29.2/30.0
- DSCR +10.0/10.0
- 1% rule +8.1/10.0
- ARV discount +7.5/15.0
- Livability +4.2/5.0
- Schools +3.0/10.0
- Rent growth +2.5/5.0
- Condition / age +2.2/5.0
- Appreciation +0.0/10.0
$409,000
🖨 Deal sheet 📄 Offer letter ✓ Due diligence
Multi-family units
County records classify this as Multi-Family (2-4 Unit). Listing-text estimate: 3 units. confirmed
Listing remarks MLS
INCREDIBLE INCOME on renovated 3 unit!!! Request spreadsheet. Large sq. each apartment. New exterior vinyl siding and roof, vinyl windows and super unit with private entry. New gas on demand furnace heats basement unit & supplements hot water heater for entire building. Completely updated electric panels, all fire code approved. 2nd & 3rd fl. are combined to one 6BR unit. All new hot water heat efficiency unit. New windows, private front porches, quiet neighborhood setting. Current with all apartment COs. Nothing to do but collect rents - completely turn-key income producer - MAKE OFFER!
Key facts
- 4,791 sq ft lot
- Built 1900
- Listed 5 days
Property features AI
Exterior
- Utilities: Public water connected; Public sewer connected; Hot water (other)
- Home design: Multi-family property (3-family)
- Construction: Frame construction; Brick and stone foundation; Asphalt shingle gable roof
- Exterior features: Vinyl siding; Sloping lot
Interior
- Bedrooms: 9 bedrooms
- Bathrooms: 4 full bathrooms
- Heating & cooling: Hot water heating; Natural gas fuel; Ceiling fans; Window unit cooling
- Interior features: Ceiling fans; Window units; Partial basement
Neighborhood map
What this means for you Summary
Snapshot
- This is a 3 × 3-bed/1.3-bath units multifamily listed at $409k. Condition is rated fair.
Deal economics
- At list price, monthly cash flow is $1k ($17k/yr) — positive. Per door: $474/mo.
- The deal already cash-flows at list — no discount required.
- Meets the 1% rule at list price ($5k rent vs $409k).
- Cap rate 10.5% vs local median 4.2% in Meriden — top-decile yield for the area; either an underpriced asset or a hidden risk that comps aren't pricing in. Stress-test before assuming the spread holds.
Location & tenants
- Location reads 85/100 on livability (#4 in CT, #505 nationally) — a professional / high-income tenant draw. Strengths: amenities A+, housing A+, health & safety A+.
- Meriden School District (suburban): math 27% / reading 41% proficiency, ranked #116 of 153 in CT (top 76%) — families likely to look elsewhere, expect single-tenant / working-renter base with shorter leases; 61% free/reduced lunch — lower-income household profile, screen leases tightly.
- Market conditions: 70 active listings in the ZIP; 1,059 units permitted in South Central Connecticut Planning Region in 2024 (779 in 5+ unit buildings).
- At $5,377/mo this rent would consume 91% of the median local household income ($71k/yr) (locally 973% of renters already pay >50% of income on rent) — very limited rent-growth headroom before tenants either downsize or default.
Forward outlook
- Local home prices are declining (-3.0%/yr); year-one equity from $3k of loan paydown is wiped out by about $12k of value loss. Plan a longer hold.
- At projected returns (-3.0% appreciation + 3.0% rent growth), your $115k cash investment doubles in ~8 years — after that, you're playing with house money.
Negotiation context
- Only 5 days on market — expect competitive offers; lowballing is unlikely to land.
- 10 sale attempts since 20y ago; this cycle's ask is 141% above the opening price — seller raised mid-cycle; expect resistance to lowballs.
- Current owner paid $162k; list at $409k implies a 153% gain — meaningful room to come down on a strong offer.
Risks & watch-outs
- Watch-outs: built in 1900 — expect roof / HVAC / electrical / plumbing capex.
- Climate carrying-cost: major wind risk, 27% chance of damaging wind over 30y; extreme-heat days projected 7→17/yr by 2055 (HVAC capex compounding) — expect insurance premiums to compound above CPI over the hold.
Questions for the listing agent
- Can we see the unit-by-unit rent roll, current vacancy, and any below-market leases? What's the average tenancy length?
- What capital expenditures (roof, boiler, parking lot, exteriors) have been made in the last 5 years, and what's planned in the next 2?
- Have any recent inspections been done? Can we get a copy of the seller's disclosures and any deferred-maintenance estimates?
- Built in 1900 — when were the roof, HVAC, electrical panel, plumbing, and water heater last replaced?
- Is there a deadline driving the sale (1031 exchange, divorce, estate, relocation)? That informs how much negotiation room exists.
- What's the average days-on-market for RENTAL listings here right now (not sales)? A rising rental-DOM trend means longer vacancies and softer asking-rent achievability than the comps imply.
- What's the recent tenant-quality profile in this submarket — average credit score on applications, eviction rate, late-payment / NSF rate, and stable-employment percentage? A property-management company in the area should have these aggregated.
- How much new apartment / multifamily construction is in the pipeline within 1–3 miles? Heavy new supply (>2% of stock underway) typically softens rents 12–24 months out; light construction supports rent growth.
Investment metrics
- 1% rule
- 1.31% ✓
- Cap rate
- 10.46%
- Cash-on-cash
- 14.89%
- DSCR
- 1.66
- GRM
- 6.3
CMA / ARV
No comps found within radius.
Projected returns pro-forma
-3.0% appreciation · 3.0% rent growth · sell at horizon
- IRR
- 5.5%
- Equity multiple
- 1.21×
- Total profit
- $24,330
- Equity at exit
- $60,983
- IRR
- 14.9%
- Equity multiple
- 2.21×
- Total profit
- $138,081
- Equity at exit
- $35,363
Cash invested: $114,520 (down + closing). Projections, not guarantees.
Landlord ↔ Tenant lean methodology
- Overall (STATE)
- 27 Tenant-Leaning
- State Connecticut
- 27 Tenant-Leaning · D+7
- County
- — inherits STATE
- City
- — inherits STATE
ZIP-level market 06451
- Home prices YoY
- -14.2%
- Active inventory
- 70
- Price-to-rent
- 19.0×
Monthly cashflow live
- Estimated rent
- $5,377 high interval (Pro) →
- Mortgage (P&I)
- −$2,145
- Tax est. 1.5%
- −$511 /mo · $6,135/yr
- Insurance
- −$170
- HOA
- −$0
- Vacancy / Maint / Mgmt
- −$1,129
- Net cashflow
- $1,421
Break-even live
3-unit breakdown (identical units grouped — click to expand)
| Units | Beds | Baths | Est. rent |
|---|---|---|---|
| 3× units | 3 | 1.3 | $5,376 |
| #1 | 3 | 1.3 | $1,792 |
| #2 | 3 | 1.3 | $1,792 |
| #3 | 3 | 1.3 | $1,792 |
| Total (3 units) | $5,377 | ||
UW: 25.0% down · 7.5% · 30yr · 1.5% tax · 5.0% vac · 8.0% maint · 8.0% mgmt
Financing live
Cash to close
- Down payment
- $102,250
- Closing costs
- $12,270
- Reserves months
- —
- Total cash needed
- —
Loan-product check · same deal, 3 products live
Conventional
25% down · 7.5% · 30yr
- Down + closing
- —
- Monthly P&I
- —
- Monthly cashflow
- —
- DSCR
- —
- Eligible?
- —
Personal DTI + credit; lowest rate.
DSCR
20% down · 8.5% · 30yr
- Down + closing
- —
- Monthly P&I
- —
- Monthly cashflow
- —
- DSCR
- —
- Eligible?
- —
No personal income docs; deal must DSCR.
Hard money
10% down · 12.0% · 12mo
- Down + closing
- —
- Monthly P&I
- —
- Monthly cashflow
- —
- DSCR
- —
- Eligible?
- —
Short-term bridge; refi at stabilization.
Listing history 13 events
-
2026-06-18days on market $409,000 Active 5 DOM
-
2026-06-17days on market $409,000 Active 4 DOM
-
2026-06-16days on market $409,000 Active 3 DOM
-
2026-06-15days on market $409,000 Active 2 DOM
-
2026-06-14statusdays on market $409,000 Active 1 DOM
-
2026-06-10days on market $409,000 Coming Soon 9 DOM
-
2026-06-09days on market $409,000 Coming Soon 8 DOM
-
2026-06-08days on market $409,000 Coming Soon 7 DOM
-
2026-06-07days on market $409,000 Coming Soon 6 DOM
-
2026-06-05days on market $409,000 Coming Soon 3 DOM
-
2026-06-03days on market $409,000 Coming Soon 2 DOM
-
2026-06-01remarks 583-char remark
-
2026-06-01$409,000 Coming Soon 1 DOM
ⓘ Source: listings_history table (triggers on properties + properties_extension) + one-shot
backfill from property_details.listing_events for pre-trigger history.
Climate risk First Street
- Flood 1/10 Low FEMA zone X (unshaded) · 0% chance over 30 yrs
- Wildfire 1/10 Low
- Heat 6/10 Major 7 d/yr ≥98°F today · 17 d/yr by 30 yrs out
- Wind 6/10 Major 27% chance of damaging wind over 30 yrs
- Air quality 4/10 Moderate 3 unhealthy d/yr today · 5 by 30 yrs out
Nearby sold comps map
Loading sold comps map…
Walkable amenities ~0.75 mi
Loading nearby amenities…
Taxation est. · year 1
- Rental income
- $64,524
- − Mortgage interest
- −$22,910
- − Property taxes
- −$6,135
- − Insurance
- −$2,045
- − Repairs & maintenance
- −$5,162
- − Management
- −$5,162
- − Depreciation
- −$11,898
- Taxable income
- $11,212
- Est. tax owed @ 24.0%
- −$2,691
- After-tax cash flow
- $14,365/yr
For passive investors: Depreciation is non-cash, so a rental often shows a tax loss while cash-flowing — sheltering income. Rental losses are passive: they offset passive income freely, and up to $25,000/yr can offset ordinary (W-2) income if you actively participate and your MAGI is under $100k (phasing out to $0 by $150k); unused losses carry forward. On sale, claimed depreciation is recaptured at up to 25%, and gains may owe capital-gains tax (a 1031 exchange can defer both). Figures are a year-1 estimate at your 24.0% rate — not tax advice; consult a CPA.
Condition & rehab AI · 2 photos
This multi-family property requires moderate repairs and maintenance to improve its condition and value. Repainting the exterior and repairing the roof are high-priority tasks.
Repairs flagged
- Major roof — Siding condition suggests potential underlying roof issues
- Major exterior siding — Weathered and worn
- Major landscaping — Overgrown and needs trimming
Value-add opportunities
- Both paint exterior — Fresh paint can improve curb appeal and property value
- Both trim and mulch landscaping — Well-maintained landscaping enhances curb appeal and property value
- Both repair roof — A repaired roof can prevent further damage and improve property value
Renovation cost estimate screening
| Repair item | Severity | Est. cost |
|---|---|---|
| roof · Siding condition suggests potential underlying roof issues | Major | $15,000–50,000 |
| exterior siding · Weathered and worn | Major | $15,000–50,000 |
| landscaping · Overgrown and needs trimming | Major | $15,000–50,000 |
| Total estimated repair cost · 3 items | $45,000–150,000 |
Value-add ROI direction
- Both paint exterior — Fresh paint can improve curb appeal and property value ↑
- Both trim and mulch landscaping — Well-maintained landscaping enhances curb appeal and property value ↑
- Both repair roof — A repaired roof can prevent further damage and improve property value ↑
ⓘ Cost ranges are severity-bucket heuristics (US national rule-of-thumb). Get contractor quotes + a written scope before underwriting a rehab budget.
Schools (NCES district)
- District
- Meriden School District
- NCES district ID
- 0902400
- Math proficiency
- 27% ▼ -8.00%
- Reading proficiency
- 41% ▼ -6.00%
- Median HH income
- $53,883
- Composite
- 29.84/100
- National rank
- #6413
- State rank
- #116 of 153 in CT
Livability — Meriden
- Score
- 85/100
- State rank
- #4
- US rank
- #505
Category grades
Schools grade is shown separately in the Schools card above.
Census & demographics
- Census place
- Meriden, CT
- County
- New Haven County · 688,236 people
- City population
- 60,545
- Metro
- New Haven-Milford, CT
- Population (ZIP)
- 24,851
- Household income
- $71,255
- Rent vs Own
- Severe rent burden
- 973.0
Population outlook (South Central Connecticut County) Hauer SSP2
- By 2040
- 608,362
Race, ethnicity, and origin ACS 2023
- Neighborhood character
- Diverse neighborhood (Simpson 0.62)
- Race & ethnicity
- White 46% Hispanic / Latino 40% Two or more races 26% Black 8% Asian 2%
- Hispanic origin (detail)
- Mexican 4% Puerto Rican 24% Cuban 2% Dominican 2%
- Common ancestry
- Romanian 5% Lithuanian 4% Subsaharan African 1%
- Foreign-born
- 11% · Canada, Jamaica, China
- Languages at home
- 65% English-only · Spanish 31% Chinese 1% French/Haitian/Cajun 1%
Political lean MEDSL · South Central Connecticut
- 2024 margin
- Strong D (+20.1) · D 59.0% · R 38.9% · Other 2.1%
- All cycles
- 2024: D+20.1
Not yet ingested
- Civics
- —
Market trends
- HPI YoY
- ▼ -45.38%
- Current HPI
- 274.0567
- Rent YoY
- —
- Metro
- New Haven-Milford, CT
- State GDP YoY
- ▲ 1.06%
- F500 in state
- 38
Industry mix (Fortune 500 HQ in CT)
| Industry | F500 HQs | Revenue |
|---|---|---|
| Industrial Machinery | 4 | $38B |
|
||
| Insurance | 3 | $71B |
|
||
| Financial Services | 2 | $25B |
|
||
| Transportation / Logistics | 2 | $18B |
|
||
| Healthcare | 1 | $247B |
|
||
| Telecommunications | 1 | $55B |
|
||
Price history
+192.1% since first listed23 events — show timeline
- 2026-06-01 Coming Soon $409,000 Smart MLS
- 2019-02-15 Sold (MLS) $161,500 Smart MLS
- 2018-10-11 Listing Removed — Smart MLS
- 2018-08-19 Listed $169,900 Smart MLS
- 2018-04-30 Listing Removed — Smart MLS
- 2018-04-14 Contingent — Smart MLS
- 2018-03-23 Relisted — Smart MLS
- 2018-03-18 Contingent — Smart MLS
- 2018-03-02 Listed $169,900 Smart MLS
- 2018-02-14 Listing Removed — Smart MLS
- 2017-11-13 Listed $169,900 Smart MLS
- 2016-10-31 Listing Removed — Smart MLS
- 2016-09-18 Listed $169,900 Smart MLS
- 2016-07-04 Listing Removed — Smart MLS
- 2016-04-04 Listed $169,900 Smart MLS
- 2015-08-20 Listing Removed — Smart MLS
- 2015-04-20 Listed $179,000 Smart MLS
- 2014-12-12 Listing Removed — Smart MLS
- 2014-09-12 Listed $115,000 Smart MLS
- 2007-02-02 Listing Removed — Smart MLS
- 2007-01-13 Listing Removed — Smart MLS
- 2006-02-02 Listed $125,000 Smart MLS
- 2006-01-13 Listed $140,000 Smart MLS
Cash-flow waterfall
monthlySold comps — $/sqft
last 12 mo · ≤1 miLoading sold comps…