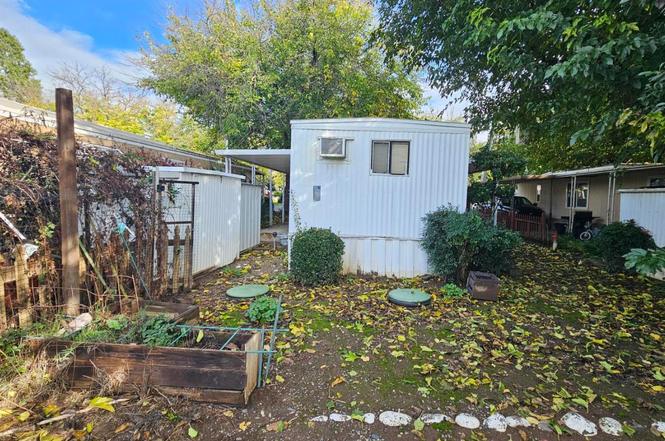
11705 Parey Ave #19 · Proberta, CA
Flood risk 7/10 · Major
- FEMA flood zone
- A
- Chance of flooding over 30 yrs
- 0.75%
- Est. flood insurance / yr
- $1,009 – $1,996
Fire risk 8/10 · Major
- Est. fire insurance / yr
- $659 – $1,223
Heat risk 8/10 · Major
- Hot days now (above 105°F)
- 7 days/yr
- Hot days in 30 yrs
- 16 days/yr
Wind risk 1/10 · Minimal
- Chance of severe wind over 30 yrs
- —
Air-quality risk 10/10 · Severe
- Unhealthy air days now
- 32 days/yr
- Unhealthy air days in 30 yrs
- 36 days/yr
Risk factors via First Street. Map © Google.
Why this score? — see what drove the D grade
The composite is a weighted blend of 9 inputs, each scored 0–100. Each bar is that input's sub-score; the figure is the points it added to the 100-point composite (weight × sub-score).
- Cash flow +15.0/30.0
- ARV discount +7.5/15.0
- 1% rule +5.0/10.0
- DSCR +5.0/10.0
- Schools +4.4/10.0
- Rent growth +2.7/5.0
- Condition / age +2.5/5.0
- Livability +1.9/5.0
- Appreciation +0.0/10.0
$5,000
🖨 Deal sheet 📄 Offer letter ✓ Due diligence
Listing remarks
Welcome home to River View MHC. Home site #19, with beautiful lush Oaks - is available for sale. Home does need work, but overall, it would make a great project for someone looking to live and fix it up! This 1 bedroom, 1 bath is ready for a new owner!!
Key facts
- Parking
- Built 1972
- Listed 161 days
Property features AI
Finance
- Financial info: Land lease: No (listed land lease amount present)
- HOA & community: No homeowners association; Senior community
Exterior
- Parking: Attached parking; no garage
- Utilities: Individual electric meter; Individual gas meter; Public sewer; Water from district
- Home design: Manufactured in park (single wide); Fleetwood make; 1972 construction year
- Construction: Aluminum skirting; Other roof
- Exterior features: Storage shed(s); Garden; River access
Interior
- Kitchen: Gas cook top; Hood over range
- Bedrooms: 1 bedroom
- Flooring: Tile; Vinyl; Wood
- Bathrooms: 1 full bathroom with shower stall
- Heating & cooling: Central heating; Wood stove; Ceiling fan(s); Wall unit(s); Window unit(s)
- Interior features: Porch; Storage area
- Laundry & utility: Washer/dryer hookups only; 220V outlet in laundry
Neighborhood map
What this means for you Summary
Snapshot
- This is a 1-bed/1.0-bath manufactured listed at $5k.
Deal economics
- At list price, monthly cash flow is $818 ($10k/yr) — positive.
- The deal already cash-flows at list — no discount required.
- Meets the 1% rule at list price ($1k rent vs $5k).
- Recommended offer: $4k (12.0% below list) — sets the bar for market timing.
Location & tenants
- Location reads 37/100 on livability (#1,425 in CA) — a limited-amenity area; tenant pool skews transient or value-seeking. Strengths: crime A; Watch: schools D-, amenities F, commute F.
- Lassen View Union Elementary (rural): math 47% / reading 56% proficiency, ranked #142 of 517 in CA (top 28%) — acceptable for families but not a draw, mixed tenant base, ~2y average lease.
- Market conditions: Rents flat; 262 active listings in the ZIP; 186 units permitted in Tehama County in 2024 (0 in 5+ unit buildings).
Forward outlook
- Local home prices are declining (-3.0%/yr); year-one equity from $35 of loan paydown is wiped out by about $150 of value loss. Plan a longer hold.
- Tehama County population projected at -14% by 2050 — secular population decline; favor cash flow + early exit over multi-decade hold.
- At projected returns (-3.0% appreciation + 1.0% rent growth), your $1k cash investment doubles in ~1 year — after that, you're playing with house money.
Negotiation context
- It's been on market 162 days — a 12% lower offer ($4k) is reasonable based on typical stale-listing flexibility.
Risks & watch-outs
- Watch-outs: flood insurance adds $125/mo.
- Climate carrying-cost: in FEMA flood zone A (mandatory federal flood insurance); severe wildfire risk; extreme-heat days projected 7→16/yr by 2055 (HVAC capex compounding) — expect insurance premiums to compound above CPI over the hold.
Questions for the listing agent
- It's been on market 162 days. Have you received any prior offers? Is the seller open to a 12% concession, seller financing, or rate buy-down credit?
- Built in 1972 — when were the roof, HVAC, electrical panel, plumbing, and water heater last replaced?
- What's the actual annual flood-insurance premium (NFIP or private), and is the property in a SFHA with mandatory coverage?
- Why hasn't it sold? Are there any deal-killer items the seller is aware of (foundation, flood, title, zoning, code violations)?
- Is there a deadline driving the sale (1031 exchange, divorce, estate, relocation)? That informs how much negotiation room exists.
- Schools are D-rated, which usually means shorter tenancies and higher turnover. Who's the typical renter profile here, and what's been the actual vacancy rate?
- The area grade is low — what's the realistic commute time and amenity access for the typical tenant pool here? Any planned neighborhood developments (good or bad) we should know about?
- What's the average days-on-market for RENTAL listings here right now (not sales)? A rising rental-DOM trend means longer vacancies and softer asking-rent achievability than the comps imply.
- What's the recent tenant-quality profile in this submarket — average credit score on applications, eviction rate, late-payment / NSF rate, and stable-employment percentage? A property-management company in the area should have these aggregated.
- How much new for-sale + rental construction is in the pipeline within 1–3 miles? Heavy new supply typically softens prices + rents 12–24 months out; constrained supply supports both.
Investment metrics
- 1% rule
- 24.64% ✓
- Cap rate
- 232.72%
- Cash-on-cash
- 808.67%
- DSCR
- 36.98
- GRM
- 0.3
CMA / ARV
No comps found within radius.
Projected returns pro-forma
-3.0% appreciation · 0.98% rent growth · sell at horizon
- IRR
- —
- Equity multiple
- 35.96×
- Total profit
- $48,942
- Equity at exit
- $746
- IRR
- —
- Equity multiple
- 72.73×
- Total profit
- $100,426
- Equity at exit
- $432
Cash invested: $1,400 (down + closing). Projections, not guarantees.
Landlord ↔ Tenant lean methodology
- Overall (STATE)
- 18 Strongly Tenant-Friendly
- State California
- 18 Strongly Tenant-Friendly · D+13
- County
- — inherits STATE
- City
- — inherits STATE
ZIP-level market 96080
- Rents YoY
- 1.0%
- Active inventory
- 262
- Price-to-rent
- 0.3×
Monthly cashflow live
- Estimated rent
- $1,232 medium interval (Pro) →
- Mortgage (P&I)
- −$26
- Tax from tax record
- −$2 /mo · $21/yr
- Insurance
- −$2
- Flood insurance flood zone
- −$125 /mo · $1,502/yr
- HOA
- −$0
- Vacancy / Maint / Mgmt
- −$259
- Net cashflow
- $818
Break-even live
UW: 25.0% down · 7.5% · 30yr · 1.5% tax · 5.0% vac · 8.0% maint · 8.0% mgmt
Financing live
Cash to close
- Down payment
- $1,250
- Closing costs
- $150
- Reserves months
- —
- Total cash needed
- —
Loan-product check · same deal, 3 products live
Conventional
25% down · 7.5% · 30yr
- Down + closing
- —
- Monthly P&I
- —
- Monthly cashflow
- —
- DSCR
- —
- Eligible?
- —
Personal DTI + credit; lowest rate.
DSCR
20% down · 8.5% · 30yr
- Down + closing
- —
- Monthly P&I
- —
- Monthly cashflow
- —
- DSCR
- —
- Eligible?
- —
No personal income docs; deal must DSCR.
Hard money
10% down · 12.0% · 12mo
- Down + closing
- —
- Monthly P&I
- —
- Monthly cashflow
- —
- DSCR
- —
- Eligible?
- —
Short-term bridge; refi at stabilization.
Listing history 16 events
-
2026-06-19days on market $5,000 Active 162 DOM
-
2026-06-18days on market $5,000 Active 161 DOM
-
2026-06-17days on market $5,000 Active 160 DOM
-
2026-06-16days on market $5,000 Active 159 DOM
-
2026-06-15days on market $5,000 Active 158 DOM
-
2026-06-14days on market $5,000 Active 156 DOM
-
2026-06-12days on market $5,000 Active 155 DOM
-
2026-06-09days on market $5,000 Active 152 DOM
-
2026-06-08days on market $5,000 Active 151 DOM
-
2026-06-07days on market $5,000 Active 150 DOM
-
2026-06-05days on market $5,000 Active 147 DOM
-
2026-06-03days on market $5,000 Active 146 DOM
-
2026-06-02days on market $5,000 Active 145 DOM
-
2026-06-01days on market $5,000 Active 144 DOM
-
2026-05-31days on market $5,000 Active 143 DOM
-
2026-05-30days on market $5,000 Active 142 DOM
ⓘ Source: listings_history table (triggers on properties + properties_extension) + one-shot
backfill from property_details.listing_events for pre-trigger history.
Tax reassessment forecast CA · Resets to sale price
- Current annual tax
- $21 · $2/mo
- Projected year-2 tax
- $38 · $3/mo
- Expected delta
- +$17/yr (+$1/mo · 85.0%)
ⓘ Screening estimate from a state-policy table — verify with the county assessor before closing.
Climate risk First Street
- Flood 7/10 Severe FEMA zone A · 75% chance over 30 yrs
- Wildfire 8/10 Severe
- Heat 8/10 Severe 7 d/yr ≥105°F today · 16 d/yr by 30 yrs out
- Wind 1/10 Low
- Air quality 10/10 Extreme 32 unhealthy d/yr today · 36 by 30 yrs out
Nearby sold comps map
Loading sold comps map…
Walkable amenities ~0.75 mi
Loading nearby amenities…
Taxation est. · year 1
- Rental income
- $14,787
- − Mortgage interest
- −$280
- − Property taxes
- −$21
- − Insurance
- −$1,528
- − Repairs & maintenance
- −$1,183
- − Management
- −$1,183
- − Depreciation
- −$145
- Taxable income
- $10,447
- Est. tax owed @ 24.0%
- −$2,507
- After-tax cash flow
- $7,312/yr
For passive investors: Depreciation is non-cash, so a rental often shows a tax loss while cash-flowing — sheltering income. Rental losses are passive: they offset passive income freely, and up to $25,000/yr can offset ordinary (W-2) income if you actively participate and your MAGI is under $100k (phasing out to $0 by $150k); unused losses carry forward. On sale, claimed depreciation is recaptured at up to 25%, and gains may owe capital-gains tax (a 1031 exchange can defer both). Figures are a year-1 estimate at your 24.0% rate — not tax advice; consult a CPA.
Schools (NCES district)
- District
- Lassen View Union Elementary
- NCES district ID
- 0621090
- Math proficiency
- 47% ▲ 4.00%
- Reading proficiency
- 56% ▲ 4.00%
- Median HH income
- $45,781
- Composite
- 43.59/100
- National rank
- #2974
- State rank
- #142 of 517 in CA
Livability — Proberta
- Score
- 37/100
- State rank
- #1425
- US rank
- #27601
Category grades
Schools grade is shown separately in the Schools card above.
Census & demographics
- County
- Tehama County · 31,554 people
- City population
- 95
- Metro
- Red Bluff, CA
- Population (ZIP)
- 31,554
- Household income
- $66,076
- Rent vs Own
- Severe rent burden
- 981.0
Population outlook (Tehama County) Hauer SSP2
- Today (2025)
- 61,058 people
- By 2030
- 59,493 · -2.6%
- By 2040
- 56,076 · -8.2%
- By 2050
- 52,372 · -14.2%
- By 2075
- 43,895 · -28.1%
- By 2100
- 34,186 · -44.0%
Race, ethnicity, and origin ACS 2023
- Neighborhood character
- Predominantly White (71%)
- Race & ethnicity
- White 71% Hispanic / Latino 19% Two or more races 13% Native American 3% Black 2% Asian 1%
- Hispanic origin (detail)
- Mexican 17%
- Common ancestry
- Italian 2% Slovak 2% Lithuanian 2%
- Foreign-born
- 6% · Canada, Vietnam
- Languages at home
- 89% English-only · Spanish 9%
Political lean MEDSL · Tehama
- 2024 margin
- Solid R (+41.8) · D 27.9% · R 69.7% · Other 2.3%
- 2008→2024 swing
- -17.7pp toward R · 2008: -24.1pp · 2024: -41.8pp
- All cycles
- 2024: R+41.8 2020: R+35.6 2016: R+36.8 2012: R+27.4 2008: R+24.1
Not yet ingested
- Civics
- —
Market trends
- HPI YoY
- ▼ -139.80%
- Current HPI
- 246.877
- Rent YoY
- ▲ 0.98%
- Metro
- Red Bluff, CA
- State GDP YoY
- ▲ 3.21%
- F500 in state
- 116
Industry mix (Fortune 500 HQ in CA)
| Industry | F500 HQs | Revenue |
|---|---|---|
| Technology | 27 | $1,492B |
|
||
| Financial Services | 3 | $174B |
|
||
| Retail | 3 | $44B |
|
||
| Insurance | 3 | $26B |
|
||
| Media / Entertainment | 2 | $115B |
|
||
| Pharmaceuticals / Biotech | 2 | $62B |
|
||
Property tax history
-5.4%/yrLatest (2025): $21 · +0.0% YoY. Source: county tax records.
Cash-flow waterfall
monthlySold comps — $/sqft
last 12 mo · ≤1 miLoading sold comps…