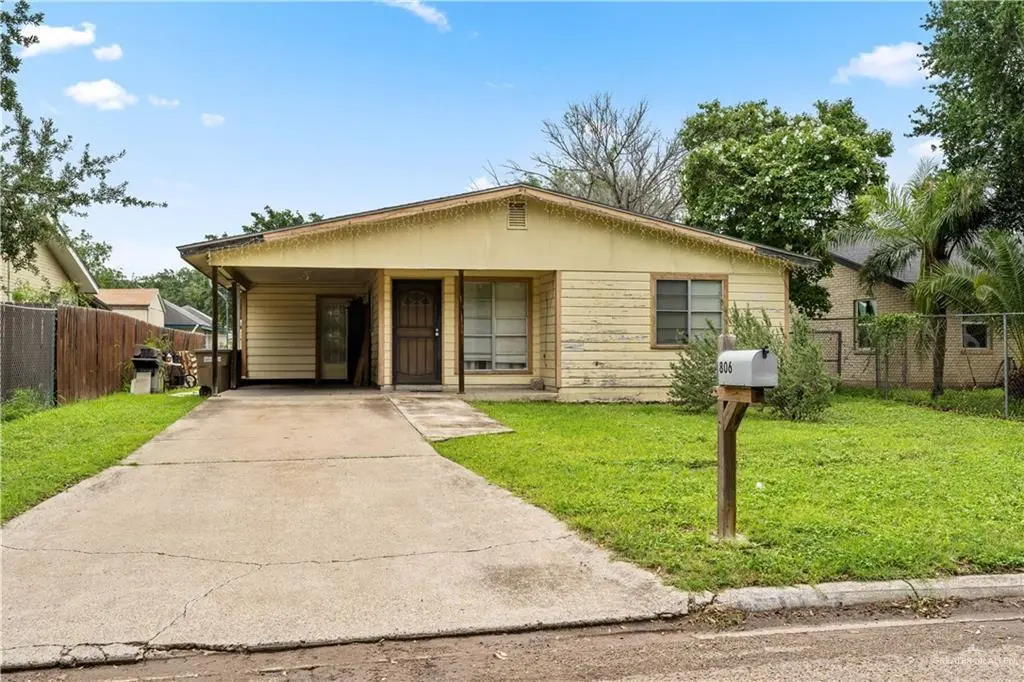
806 S 20th Ave · Edinburg, TX
Flood risk 6/10 · Moderate
- FEMA flood zone
- X (shaded)
- Chance of flooding over 30 yrs
- 0.69%
- Est. flood insurance / yr
- $507 – $1,088
Fire risk 6/10 · Moderate
- Est. fire insurance / yr
- $1,222 – $2,270
Heat risk 9/10 · Severe
- Hot days now (above 111°F)
- 7 days/yr
- Hot days in 30 yrs
- 23 days/yr
Wind risk 8/10 · Major
- Chance of severe wind over 30 yrs
- 99.0%
Air-quality risk 2/10 · Minimal
- Unhealthy air days now
- 0 days/yr
- Unhealthy air days in 30 yrs
- 1 days/yr
Risk factors via First Street. Map © Google.
Why this score? — see what drove the C+ grade
The composite is a weighted blend of 9 inputs, each scored 0–100. Each bar is that input's sub-score; the figure is the points it added to the 100-point composite (weight × sub-score).
- Cash flow +23.6/30.0
- ARV discount +15.0/15.0
- DSCR +7.6/10.0
- 1% rule +7.2/10.0
- Livability +3.2/5.0
- Condition / age +2.5/5.0
- Rent growth +2.4/5.0
- Schools +2.2/10.0
- Appreciation +0.0/10.0
$95,000
🖨 Deal sheet 📄 Offer letter ✓ Due diligence
Listing remarks
Investment opportunity with great potential! This 2-bedroom, 1-bath home with a 1-car carport is ready for your vision and personal touch. Situated on a slab foundation in an established neighborhood, this property is ideal for investors, flippers, or first-time homebuyers looking to customize a home to their own style and preferences. Conveniently located near schools, shopping, and Laguna Park, offering easy access to outdoor recreation and community amenities. With solid potential and a desirable location, this property presents an excellent opportunity to create value and make it your own. Being sold as-is.
Key facts
- Slab foundation
- Near schools
- Near shopping
Tags
Property features AI
Finance
- HOA & community: No homeowners association
Exterior
- Parking: 1 covered parking space; 1 carport (attached, garage faces front, no garage)
- Utilities: Public water; City sewer; Electric service (implied by electric water heater)
- Home design: Single-story frame/wood home with wood siding; Composition shingle roof; Slab foundation
- Construction: Frame/Wood construction; Wood siding
- Exterior features: Chain link and wood fencing; Paved road access
Interior
- Kitchen: Electric water heater; No conveying appliances
- Flooring: Vinyl flooring
- Bathrooms: 1 full bathroom
- Interior features: Entrance foyer; Laminate countertops; No window coverings
- Laundry & utility: Laundry room
Neighborhood map
What this means for you Summary
Snapshot
- This is a 3-bed/1.0-bath single-family listed at $95k.
Deal economics
- At list price, monthly cash flow is $179 ($2k/yr) — positive.
- The deal already cash-flows at list — no discount required.
- Meets the 1% rule at list price ($1k rent vs $95k).
- Recommended offer: $94k (1.5% below list) — sets the bar for market timing.
- Cap rate 8.6% vs local median 2.4% in Edinburg — top-decile yield for the area; either an underpriced asset or a hidden risk that comps aren't pricing in. Stress-test before assuming the spread holds.
Location & tenants
- Location reads 64/100 on livability (#784 in TX) — a middle-class / working-renter tenant base. Strengths: cost of living A+, housing A+; Watch: employment D, amenities F, commute F.
- Edinburg CISD (urban): math 20% / reading 34% proficiency, ranked #699 of 826 in TX (top 85%) — low school quality limits family demand, transient renter base, plan for 1-2y turnover; 62% free/reduced lunch — lower-income household profile, screen leases tightly.
- Zoned schools: Travis El (math 12% / reading 32%, grade F, #3,333 of 4,322 statewide, top 80%, 329 students, 89% FRL); Francisco Barrientes Middle (math 12% / reading 33%, grade F, #1,341 of 1,662 statewide, top 82%, 1,215 students, 83% FRL); Edinburg H S (math 14% / reading 35%, grade F, #1,264 of 1,632 statewide, top 82%, 2,433 students, 83% FRL) — zoned schools average 85% FRL vs 62% district-wide (23 pts higher); higher-poverty schools than district average — tighter screening recommended.
- Market conditions: Rents soft (-0.5%/yr); 406 active listings in the ZIP; 31 comparable units currently listed for rent nearby; rentals lingering (median 44d on market — plan ~5-8 weeks vacancy on turnover, expect pricing pressure); 74% of comp listings sitting > 30 days — soft ceiling on asking rent; 7,378 units permitted in Hidalgo County in 2024 (641 in 5+ unit buildings).
Forward outlook
- Local home prices are declining (-3.0%/yr); year-one equity from $657 of loan paydown is wiped out by about $3k of value loss. Plan a longer hold.
- Hidalgo County population projected at +28% by 2050 — long-run rental-demand tailwind backs the buy-and-hold thesis.
Negotiation context
- It's been on market 20 days — a 2% lower offer ($94k) is reasonable based on typical stale-listing flexibility.
Risks & watch-outs
- Watch-outs: property tax is 2.5% of price.
- Climate carrying-cost: major flood risk; severe wind risk, 99% chance of damaging wind over 30y; major wildfire risk; extreme-heat days projected 7→23/yr by 2055 (HVAC capex compounding) — expect insurance premiums to compound above CPI over the hold.
Questions for the listing agent
- Built in 1979 — when were the roof, HVAC, electrical panel, plumbing, and water heater last replaced?
- Property tax is high relative to price — has the assessment been appealed recently, and will the sale trigger a re-assessment?
- Is there a deadline driving the sale (1031 exchange, divorce, estate, relocation)? That informs how much negotiation room exists.
- Schools are D-rated, which usually means shorter tenancies and higher turnover. Who's the typical renter profile here, and what's been the actual vacancy rate?
- What's the average days-on-market for RENTAL listings here right now (not sales)? A rising rental-DOM trend means longer vacancies and softer asking-rent achievability than the comps imply.
- What's the recent tenant-quality profile in this submarket — average credit score on applications, eviction rate, late-payment / NSF rate, and stable-employment percentage? A property-management company in the area should have these aggregated.
- How much new for-sale + rental construction is in the pipeline within 1–3 miles? Heavy new supply typically softens prices + rents 12–24 months out; constrained supply supports both.
Investment metrics
- 1% rule
- 1.22% ✓
- Cap rate
- 8.55%
- Cash-on-cash
- 8.06%
- DSCR
- 1.36
- GRM
- 6.8
CMA / ARV
- ARV (on-the-fly)
- $138,216
- Comps found
- 3
Show comp detail 3 sales within ~0.75 mi
| Address | Dist | Beds/Ba | Sqft | Sold | Price | $/sf | Match |
|---|---|---|---|---|---|---|---|
| 915 E Champion St | 0.18mi | 2/1.0 (-1) | 840 (-5%) | 24mo | $146,000 | $174 | 58 |
| 609 E Sprague St | 0.28mi | 2/1.0 (-1) | 996 (+12%) | 11mo | $155,000 | $156 | 52 |
| 1302 E Cano St | 0.45mi | 3/1.0 | 792 (-11%) | 14mo | $82,500 | $104 | 49 |
Match score weights: distance 35% · size 25% · config 20% · recency 20%. Top-matched comps best support the ARV.
Projected returns pro-forma
-3.0% appreciation · 0.0% rent growth · sell at horizon
- IRR
- -7.7%
- Equity multiple
- 0.72×
- Total profit
- $-7,338
- Equity at exit
- $14,165
- IRR
- -3.0%
- Equity multiple
- 0.83×
- Total profit
- $-4,575
- Equity at exit
- $8,214
Cash invested: $26,600 (down + closing). Projections, not guarantees.
Landlord ↔ Tenant lean methodology
- Overall (STATE)
- 87 Strongly Landlord-Friendly
- State Texas
- 87 Strongly Landlord-Friendly · R+5
- County
- — inherits STATE
- City
- — inherits STATE
ZIP-level market 78539
- Home prices YoY
- -19.6%
- Rents YoY
- -0.5%
- Active inventory
- 406
- Price-to-rent
- 6.8×
Monthly cashflow live
- Estimated rent
- $1,157 high interval (Pro) →
- Mortgage (P&I)
- −$498
- Tax from tax record
- −$198 /mo · $2,375/yr
- Insurance
- −$40
- HOA
- −$0
- Vacancy / Maint / Mgmt
- −$243
- Net cashflow
- $179
Break-even live
UW: 25.0% down · 7.5% · 30yr · 1.5% tax · 5.0% vac · 8.0% maint · 8.0% mgmt
Financing live
Cash to close
- Down payment
- $23,750
- Closing costs
- $2,850
- Reserves months
- —
- Total cash needed
- —
Loan-product check · same deal, 3 products live
Conventional
25% down · 7.5% · 30yr
- Down + closing
- —
- Monthly P&I
- —
- Monthly cashflow
- —
- DSCR
- —
- Eligible?
- —
Personal DTI + credit; lowest rate.
DSCR
20% down · 8.5% · 30yr
- Down + closing
- —
- Monthly P&I
- —
- Monthly cashflow
- —
- DSCR
- —
- Eligible?
- —
No personal income docs; deal must DSCR.
Hard money
10% down · 12.0% · 12mo
- Down + closing
- —
- Monthly P&I
- —
- Monthly cashflow
- —
- DSCR
- —
- Eligible?
- —
Short-term bridge; refi at stabilization.
Rent comps 31 comps
| Address | Beds | Baths | Sqft | Rent | $/sqft | DOM | Units | Dist |
|---|---|---|---|---|---|---|---|---|
| 811 S 19th Ave Edinburg, TX | 3.0 | 2.0 | 1102 | $1,500 | $1.36 | 43d | 1 | 0.12mi |
| 220 S 25th Ave Edinburg, TX | 1.0–3.0 | 1.0 | 773 | $899 | $1.16 | 14d | 6 | 0.56mi |
| 805 Dove Ave Unit 1 Edinburg, TX | 2.0 | 2.0 | 945 | $1,150 | $1.22 | 43d | 1 | 0.65mi |
| 816 Dove Ave Unit 2 Edinburg, TX | 2.0 | 2.0 | 1000 | $1,250 | $1.25 | 43d | 1 | 0.67mi |
| 305 S Raul Longoria Rd Edinburg, TX | 2.0 | 2.0 | 1000 | $1,350 | $1.35 | 43d | 1 | 0.96mi |
| 112 E Peter St Unit 3 Edinburg, TX | 2.0 | 1.0 | 850 | $975 | $1.15 | 43d | 1 | 0.97mi |
| 1920 E Iowa Rd Edinburg, TX | 2.0 | 1.0 | 725 | $695 | $0.96 | 44d | 1 | 0.98mi |
| 1920 E Iowa Rd Apt 2 Edinburg, TX | 2.0 | 1.0 | 725 | $695 | $0.96 | 43d | 1 | 0.98mi |
| 1920 E Iowa Rd Edinburg, TX | 2.0 | 1.0 | 735 | $695 | $0.95 | 23d | 1 | 0.98mi |
| 604 E Schunior St Edinburg, TX | 3.0 | 2.0 | 1100 | $1,150 | $1.05 | 43d | 1 | 0.99mi |
| 1920 E Iowa Rd Apt 5 Edinburg, TX | 2.0 | 1.0 | 725 | $725 | $1.00 | 23d | 1 | 1.01mi |
| 2120 S Oakview Dr Unit 2 Edinburg, TX | 2.0 | 2.0 | 972 | $1,250 | $1.29 | 43d | 1 | 1.02mi |
| 2200 S Oakview Dr Unit 2 Edinburg, TX | 2.0 | 2.0 | 972 | $1,250 | $1.29 | 43d | 1 | 1.05mi |
| 2208 Taxco Ct Unit 4 Edinburg, TX | 2.0 | 2.0 | 980 | $975 | $0.99 | 43d | 1 | 1.21mi |
| 2208 Taxco Ct Unit 3 Edinburg, TX | 3.0 | 2.0 | 1120 | $1,075 | $0.96 | 43d | 1 | 1.21mi |
| 2206 Taxco Ct Unit 2 Edinburg, TX | 2.0 | 2.0 | 855 | $1,100 | $1.29 | 43d | 1 | 1.26mi |
| 2206 Taxco Ct Unit 1 Edinburg, TX | 2.0 | 2.0 | 855 | $1,150 | $1.35 | 43d | 1 | 1.26mi |
| 1105 W Stubbs St Unit C Edinburg, TX | 2.0 | 1.5 | 960 | $800 | $0.83 | 43d | 1 | 1.40mi |
| 1105 W Stubbs St Unit C Edinburg, TX | 2.0 | 1.5 | 960 | $800 | $0.83 | 23d | 1 | 1.40mi |
| 302 S Doolittle Rd Edinburg, TX | 1.0–3.0 | 1.0–2.0 | 750 | $900 | $1.20 | 14d | 7 | 1.42mi |
| 420 W Chavez St Unit 4 Edinburg, TX | 3.0 | 2.0 | 1100 | $1,250 | $1.14 | 43d | 1 | 1.43mi |
| 136 E Wells St Edinburg, TX | 3.0 | 1.0 | 961 | $1,200 | $1.25 | 43d | 1 | 1.43mi |
| 2314 W Stubbs St Unit A Edinburg, TX | 2.0 | 2.0 | 1069 | $875 | $0.82 | 43d | 1 | 1.45mi |
| 106 Teak Dr Unit 4 Edinburg, TX | 2.0 | 2.0 | 1100 | $1,100 | $1.00 | 14d | 1 | 1.45mi |
| 106 Teak Dr Unit 3 Edinburg, TX | 2.0 | 2.0 | 1100 | $1,100 | $1.00 | 43d | 1 | 1.45mi |
| 110 Teak Dr Unit 3 Edinburg, TX | 2.0 | 2.0 | 1021 | $900 | $0.88 | 23d | 1 | 1.45mi |
| 414 Pirul St Unit 1 Edinburg, TX | 2.0 | 2.0 | 750 | $800 | $1.07 | 43d | 1 | 1.45mi |
| 204 Teak Dr Unit 3 Edinburg, TX | 2.0 | 2.0 | 1050 | $1,000 | $0.95 | 43d | 1 | 1.47mi |
| 204 Teak Dr Unit 1 Edinburg, TX | 2.0 | 2.0 | 1050 | $900 | $0.86 | 23d | 1 | 1.47mi |
| 406 N Lotto Ln Unit 4 Edinburg, TX | 2.0 | 2.0 | 850 | $850 | $1.00 | 43d | 1 | 1.48mi |
| 1404 Deer Hls Unit 3 Edinburg, TX | 2.0 | 2.0 | 975 | $1,100 | $1.13 | 43d | 1 | 1.50mi |
Listing history 16 events
-
2026-06-18days on market $95,000 Active 20 DOM
-
2026-06-17days on market $95,000 Active 19 DOM
-
2026-06-16days on market $95,000 Active 18 DOM
-
2026-06-15days on market $95,000 Active 17 DOM
-
2026-06-14days on market $95,000 Active 15 DOM
-
2026-06-13days on market $95,000 Active 14 DOM
-
2026-06-10days on market $95,000 Active 12 DOM
-
2026-06-09days on market $95,000 Active 11 DOM
-
2026-06-08days on market $95,000 Active 10 DOM
-
2026-06-07days on market $95,000 Active 9 DOM
-
2026-06-03days on market $95,000 Active 5 DOM
-
2026-06-02days on market $95,000 Active 4 DOM
-
2026-06-01days on market $95,000 Active 3 DOM
-
2026-05-31days on market $95,000 Active 2 DOM
-
2026-05-31remarks 618-char remark
-
2026-05-31$95,000 Active 1 DOM
ⓘ Source: listings_history table (triggers on properties + properties_extension) + one-shot
backfill from property_details.listing_events for pre-trigger history.
Tax reassessment forecast TX · Resets to sale price
- Current annual tax
- $2,375 · $198/mo
- Projected year-2 tax
- $2,375 · $198/mo
- Expected delta
- $0/yr ($0/mo · 0.0%)
ⓘ Screening estimate from a state-policy table — verify with the county assessor before closing.
Climate risk First Street
- Flood 6/10 Major FEMA zone X (shaded) · 69% chance over 30 yrs
- Wildfire 6/10 Major
- Heat 9/10 Extreme 7 d/yr ≥111°F today · 23 d/yr by 30 yrs out
- Wind 8/10 Severe 99% chance of damaging wind over 30 yrs
- Air quality 2/10 Low 0 unhealthy d/yr today · 1 by 30 yrs out
Nearby sold comps map
Loading sold comps map…
Walkable amenities ~0.75 mi
Loading nearby amenities…
Taxation est. · year 1
- Rental income
- $13,890
- − Mortgage interest
- −$5,321
- − Property taxes
- −$2,375
- − Insurance
- −$475
- − Repairs & maintenance
- −$1,111
- − Management
- −$1,111
- − Depreciation
- −$2,764
- Taxable income
- $732
- Est. tax owed @ 24.0%
- −$176
- After-tax cash flow
- $1,969/yr
For passive investors: Depreciation is non-cash, so a rental often shows a tax loss while cash-flowing — sheltering income. Rental losses are passive: they offset passive income freely, and up to $25,000/yr can offset ordinary (W-2) income if you actively participate and your MAGI is under $100k (phasing out to $0 by $150k); unused losses carry forward. On sale, claimed depreciation is recaptured at up to 25%, and gains may owe capital-gains tax (a 1031 exchange can defer both). Figures are a year-1 estimate at your 24.0% rate — not tax advice; consult a CPA.
Schools (NCES district)
- District
- Edinburg CISD
- NCES district ID
- 4818180
- Math proficiency
- 20% ▼ -34.00%
- Reading proficiency
- 34% ▼ -11.00%
- Median HH income
- $36,985
- Composite
- 22.42/100
- National rank
- #8114
- State rank
- #699 of 826 in TX
Livability — Edinburg
- Score
- 64/100
- State rank
- #784
- US rank
- #14319
Category grades
Schools grade is shown separately in the Schools card above.
Census & demographics
- Census place
- Edinburg, TX
- County
- Hidalgo County · 623,128 people
- City population
- 178,279
- Metro
- McAllen-Edinburg-Mission, TX
- Population (ZIP)
- 37,168
- Household income
- $66,967
- Rent vs Own
- Severe rent burden
- 1525.0
Population outlook (Hidalgo County) Hauer SSP2
- Today (2025)
- 955,232 people
- By 2030
- 1,009,774 · +5.7%
- By 2040
- 1,120,332 · +17.3%
- By 2050
- 1,225,036 · +28.2%
- By 2075
- 1,439,189 · +50.7%
- By 2100
- 1,533,429 · +60.5%
Race, ethnicity, and origin ACS 2023
- Neighborhood character
- Predominantly Hispanic (85%)
- Race & ethnicity
- Hispanic / Latino 85% Two or more races 45% White 10% Asian 4%
- Hispanic origin (detail)
- Mexican 77% Puerto Rican 1%
- Common ancestry
- Lithuanian 1% Italian 1% Romanian 1%
- Foreign-born
- 19% · Canada
- Languages at home
- 32% English-only · Spanish 64% Tagalog/Filipino 2% Other Asian/Pacific 1%
Political lean MEDSL · Hidalgo
- 2024 margin
- Toss-up / Even · D 48.1% · R 51.0%
- 2008→2024 swing
- -41.6pp toward R · 2008: 38.7pp · 2024: -2.9pp
- All cycles
- 2024: R+2.9 2020: D+17.1 2016: D+40.5 2012: D+41.8 2008: D+38.7
Not yet ingested
- Civics
- —
Market trends
- HPI YoY
- ▼ -51.52%
- Current HPI
- 211.4723
- Rent YoY
- ▼ -0.52%
- Metro
- McAllen-Edinburg-Mission, TX
- State GDP YoY
- ▲ 3.95%
- F500 in state
- 110
Industry mix (Fortune 500 HQ in TX)
| Industry | F500 HQs | Revenue |
|---|---|---|
| Energy | 16 | $1,198B |
|
||
| Technology | 5 | $198B |
|
||
| Engineering / Construction | 4 | $72B |
|
||
| Energy Services | 3 | $60B |
|
||
| Utilities | 3 | $41B |
|
||
| Healthcare | 2 | $330B |
|
||
Price history
1 event — show timeline
- 2026-05-30 Listed $95,000 MCALLENMLS
Property tax history
+10.2%/yrLatest (2025): $2,375 · +32.6% YoY. Source: county tax records.
Cash-flow waterfall
monthlySold comps — $/sqft
last 12 mo · ≤1 miLoading sold comps…