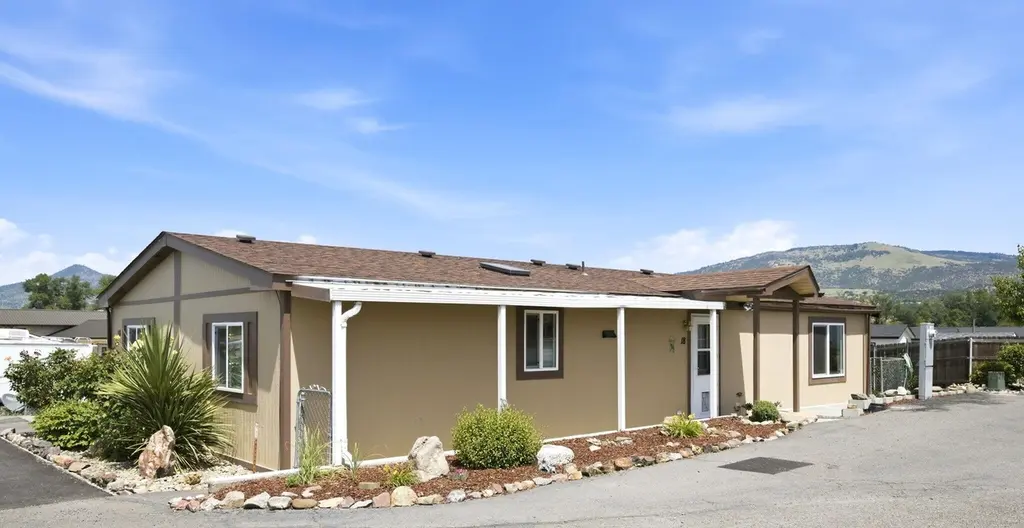
3653 S Pacific Hwy #18 · Medford, OR
Flood risk 1/10 · Minimal
- FEMA flood zone
- X (unshaded)
- Chance of flooding over 30 yrs
- 0.0%
- Est. flood insurance / yr
- $507 – $1,088
Fire risk 7/10 · Major
- Est. fire insurance / yr
- $498 – $926
Heat risk 6/10 · Moderate
- Hot days now (above 97°F)
- 7 days/yr
- Hot days in 30 yrs
- 15 days/yr
Wind risk 1/10 · Minimal
- Chance of severe wind over 30 yrs
- —
Air-quality risk 10/10 · Severe
- Unhealthy air days now
- 27 days/yr
- Unhealthy air days in 30 yrs
- 30 days/yr
Risk factors via First Street. Map © Google.
Why this score? — see what drove the B+ grade
The composite is a weighted blend of 9 inputs, each scored 0–100. Each bar is that input's sub-score; the figure is the points it added to the 100-point composite (weight × sub-score).
- Cash flow +30.0/30.0
- ARV discount +15.0/15.0
- 1% rule +10.0/10.0
- DSCR +10.0/10.0
- Livability +3.8/5.0
- Condition / age +3.8/5.0
- Rent growth +3.1/5.0
- Schools +1.9/10.0
- Appreciation +0.0/10.0
$110,000
🖨 Deal sheet (PDF) 📄 Offer letter ✓ Due diligence
Listing remarks
Well-cared-for manufactured home offering 1,404 square feet, 3 bedrooms and 2 bathrooms. Recent updates include new paint inside and out, new vinyl flooring, newer vinyl windows along with a newer HVAC. The spacious kitchen features abundant cabinet storage, a center island, and all kitchen appliances are included. A generous laundry room provides additional storage space and functionality. The primary suite offers a large bedroom, walk-in closet, and private bath with a walk-in shower. Outside, you'll find a versatile shed/workshop perfect for hobbies, tools, or extra storage. The yard features mature landscaping, colorful flowers, a fenced area, and a large covered carport, creating an in
Key facts
- Manufactured home
- Newer vinyl windows
- New paint
Tags
Property features AI
Finance
- Financial info: Monthly land lease of 950
- HOA & community: CCRs apply; May remain in park
Exterior
- Parking: Attached carport
- Security: Audio and video surveillance on the premises
- Utilities: Public water; Public sewer; Electricity connected; Cable connected
- Home design: Mobile home (double wide) located in a park; One level
- Construction: Built in 1995; Composition roof; Pillar/post/pier foundation
- Exterior features: Landscaped grounds; Double pane windows with vinyl frames; Shed(s)
Interior
- Kitchen: Range; Range hood; Refrigerator; Water heater
- Bedrooms: 3 bedrooms (including a primary bedroom)
- Flooring: Vinyl
- Bathrooms: 2 full bathrooms
- Heating & cooling: Heat pump for heating and cooling
- Interior features: Kitchen island; Linen closet; Vaulted ceilings; High‑speed internet
- Laundry & utility: Laundry area
Neighborhood map
What this means for you Summary
Snapshot
- This is a 3-bed/2.0-bath manufactured listed at $110k. Condition is rated good.
Deal economics
- At list price, monthly cash flow is $641 ($8k/yr) — positive.
- The deal already cash-flows at list — no discount required.
- Meets the 1% rule at list price ($2k rent vs $110k).
- Recommended offer: $108k (1.5% below list) — sets the bar for market timing.
- Cap rate 13.3% vs local median 2.8% in Medford — top-decile yield for the area; either an underpriced asset or a hidden risk that comps aren't pricing in. Stress-test before assuming the spread holds.
Location & tenants
- Location reads 76/100 on livability (#78 in OR, #3,467 nationally) — a middle-class / working-renter tenant base. Strengths: commute A+, health & safety A+, amenities A-; Watch: employment D+, crime F.
- Phoenix-Talent SD 4 (suburban): math 14% / reading 32% proficiency, ranked #58 of 58 in OR (top 100%) — low school quality limits family demand, transient renter base, plan for 1-2y turnover.
- Zoned schools: Orchard Hill Elementary School (math 24% / reading 24%, grade F, #320 of 412 statewide, top 82%, 345 students, 78% FRL); Talent Middle School (math 10% / reading 33%, grade F, #122 of 128 statewide, top 95%, 473 students, 79% FRL); Phoenix High School (math 24% / reading 70%, grade D-, #56 of 143 statewide, top 41%, 700 students, 79% FRL) — zoned schools average 79% FRL vs 60% district-wide (19 pts higher); higher-poverty schools than district average — tighter screening recommended.
- Market conditions: Rents rising (+2.5%/yr); 70 active listings in the ZIP; 6 comparable units currently listed for rent nearby; rentals at typical pace (median 23d on market — plan ~3-4 weeks tenant-placement turnaround); 904 units permitted in Jackson County in 2024 (212 in 5+ unit buildings).
- This rent runs 33% of the median local income ($64k/yr) — at the standard rent-burdened threshold; future hikes will face affordability resistance.
Forward outlook
- Local home prices are declining (-3.0%/yr); year-one equity from $761 of loan paydown is wiped out by about $3k of value loss. Plan a longer hold.
- Jackson County population projected at +17% by 2050 — long-run rental-demand tailwind backs the buy-and-hold thesis.
- At projected returns (-3.0% appreciation + 2.5% rent growth), your $31k cash investment doubles in ~5 years — after that, you're playing with house money.
Negotiation context
- It's been on market 23 days — a 2% lower offer ($108k) is reasonable based on typical stale-listing flexibility.
Risks & watch-outs
- Climate carrying-cost: major wildfire risk; extreme-heat days projected 7→15/yr by 2055 (HVAC capex compounding) — expect insurance premiums to compound above CPI over the hold.
Questions for the listing agent
- Is there a deadline driving the sale (1031 exchange, divorce, estate, relocation)? That informs how much negotiation room exists.
- Crime grade is F in this area — have there been break-ins, vandalism, or insurance claims at this property in the last 3 years? What carrier currently insures it and at what premium?
- What's the average days-on-market for RENTAL listings here right now (not sales)? A rising rental-DOM trend means longer vacancies and softer asking-rent achievability than the comps imply.
- What's the recent tenant-quality profile in this submarket — average credit score on applications, eviction rate, late-payment / NSF rate, and stable-employment percentage? A property-management company in the area should have these aggregated.
- How much new for-sale + rental construction is in the pipeline within 1–3 miles? Heavy new supply typically softens prices + rents 12–24 months out; constrained supply supports both.
Investment metrics
- 1% rule
- 1.61% ✓
- Cap rate
- 13.29%
- Cash-on-cash
- 24.98%
- DSCR
- 2.11
- GRM
- 5.2
CMA / ARV
- ARV (on-the-fly)
- $134,784
- Comps found
- 12
Show comp detail 12 sales within ~0.75 mi
| Address | Dist | Beds/Ba | Sqft | Sold | Price | $/sf | Match |
|---|---|---|---|---|---|---|---|
| 93 Northridge Ter #26 | 0.07mi | 3/2.0 | 1,404 (0%) | 3mo | $109,000 | $78 | 94 |
| 93 Northridge Ter Spc 23 | 0.07mi | 3/2.0 | 1,404 (0%) | 9mo | $116,000 | $83 | 89 |
| 3555 S Pacific Hwy Spc 131 | 0.14mi | 3/2.0 | 1,344 (-4%) | 7mo | $98,000 | $73 | 81 |
| 3555 S Pacific Hwy #26 | 0.14mi | 4/2.0 (+1) | 1,440 (+3%) | 10mo | $180,000 | $125 | 76 |
| 93 Northridge Ter #50 | 0.07mi | 3/2.0 | 1,568 (+12%) | 10mo | $227,000 | $145 | 69 |
| 3555 S Pacific Hwy Spc 204 | 0.14mi | 3/2.0 | 1,200 (-14%) | 2mo | $138,000 | $115 | 68 |
| 3431 S Pacific Hwy #77 | 0.46mi | 3/2.0 | 1,440 (+3%) | 8mo | $85,000 | $59 | 68 |
| 3966 S Pacific Hwy #6 | 0.27mi | 3/2.0 | 1,512 (+8%) | 12mo | $223,000 | $147 | 65 |
| 10 E South Stage Rd Spc 101 | 0.53mi | 3/2.0 | 1,296 (-8%) | 5mo | $125,000 | $96 | 59 |
| 10 E South Stage Rd Spc 72 | 0.53mi | 2/2.0 (-1) | 1,458 (+4%) | 8mo | $159,900 | $110 | 57 |
| 3431 S Pacific Hwy Spc 98 | 0.46mi | 2/2.0 (-1) | 1,248 (-11%) | 1mo | $85,000 | $68 | 54 |
| 3431 S Pacific Hwy Spc 9 | 0.46mi | 3/2.0 | 1,200 (-14%) | 1mo | $50,000 | $42 | 53 |
Match score weights: distance 35% · size 25% · config 20% · recency 20%. Top-matched comps best support the ARV.
Projected returns pro-forma
-3.0% appreciation · 2.53% rent growth · sell at horizon
- IRR
- 17.9%
- Equity multiple
- 1.72×
- Total profit
- $22,209
- Equity at exit
- $16,401
- IRR
- 26.0%
- Equity multiple
- 3.23×
- Total profit
- $68,645
- Equity at exit
- $9,511
Cash invested: $30,800 (down + closing). Projections, not guarantees.
Landlord ↔ Tenant lean methodology
- Overall (STATE)
- 28 Tenant-Leaning
- State Oregon
- 28 Tenant-Leaning · D+6
- County
- — inherits STATE
- City
- — inherits STATE
ZIP-level market 97501
- Rents YoY
- 2.5%
- Active inventory
- 70
- Price-to-rent
- 5.2×
Monthly cashflow live
- Estimated rent
- $1,774 high interval (Pro) →
- Mortgage (P&I)
- −$577
- Tax est. 1.5%
- −$138 /mo · $1,650/yr
- Insurance
- −$46
- HOA
- −$0
- Vacancy / Maint / Mgmt
- −$373
- Net cashflow
- $641
Break-even live
Sensitivity live
| Price | -10% $717 | -5% $679 | +0% $641 | +5% $603 | +10% $565 |
|---|---|---|---|---|---|
| Rent | -10% $501 | -5% $571 | +0% $641 | +5% $711 | +10% $781 |
| Rate | -1.0pp $697 | -0.5pp $669 | base $641 | +0.5pp $613 | +1.0pp $584 |
UW: 25.0% down · 7.5% · 30yr · 1.5% tax · 5.0% vac · 8.0% maint · 8.0% mgmt
Financing live
Cash to close
- Down payment
- $27,500
- Closing costs
- $3,300
- Reserves months
- —
- Total cash needed
- —
Loan-product check · same deal, 3 products live
Conventional
25% down · 7.5% · 30yr
- Down + closing
- —
- Monthly P&I
- —
- Monthly cashflow
- —
- DSCR
- —
- Eligible?
- —
Personal DTI + credit; lowest rate.
DSCR
20% down · 8.5% · 30yr
- Down + closing
- —
- Monthly P&I
- —
- Monthly cashflow
- —
- DSCR
- —
- Eligible?
- —
No personal income docs; deal must DSCR.
Hard money
10% down · 12.0% · 12mo
- Down + closing
- —
- Monthly P&I
- —
- Monthly cashflow
- —
- DSCR
- —
- Eligible?
- —
Short-term bridge; refi at stabilization.
Rent comps 6 comps
| Address | Beds | Baths | Sqft | Rent | $/sqft | DOM | Units | Dist |
|---|---|---|---|---|---|---|---|---|
| 168 Northridge Ter Medford, OR | 2.0 | 1.5 | 950 | $1,600 | $1.68 | 22d | 1 | 0.17mi |
| 204 Cheryl Ln Unit J Phoenix, OR | 2.0 | 1.5 | 1008 | $1,350 | $1.34 | 45d | 1 | 0.54mi |
| 110 6th St Phoenix, OR | 3.0 | 1.0 | 1040 | $1,895 | $1.82 | 22d | 1 | 0.81mi |
| 110 6th St Phoenix, OR | 3.0 | 1.0 | 1040 | $1,895 | $1.82 | 15d | 1 | 0.81mi |
| 211 W 1st St Apt B Phoenix, OR | 2.0 | 1.5 | 1250 | $1,600 | $1.28 | 15d | 1 | 1.14mi |
| 412 Oak St Unit 2 Phoenix, OR | 3.0 | 2.5 | 1368 | $1,750 | $1.28 | 45d | 1 | 1.33mi |
Listing history 17 events
-
2026-06-21days on market $110,000 Active 23 DOM
-
2026-06-19days on market $110,000 Active 21 DOM
-
2026-06-18days on market $110,000 Active 20 DOM
-
2026-06-17days on market $110,000 Active 19 DOM
-
2026-06-16days on market $110,000 Active 18 DOM
-
2026-06-15days on market $110,000 Active 17 DOM
-
2026-06-14days on market $110,000 Active 15 DOM
-
2026-06-13days on market $110,000 Active 14 DOM
-
2026-06-10days on market $110,000 Active 12 DOM
-
2026-06-09days on market $110,000 Active 11 DOM
-
2026-06-08days on market $110,000 Active 10 DOM
-
2026-06-07days on market $110,000 Active 9 DOM
-
2026-06-02days on market $110,000 Active 4 DOM
-
2026-06-01days on market $110,000 Active 3 DOM
-
2026-05-31days on market $110,000 Active 2 DOM
-
2026-05-30remarks 699-char remark
-
2026-05-30$110,000 Active 1 DOM
ⓘ Source: listings_history table (triggers on properties + properties_extension) + one-shot
backfill from property_details.listing_events for pre-trigger history.
Climate risk First Street
- Flood 1/10 Low FEMA zone X (unshaded) · 0% chance over 30 yrs
- Wildfire 7/10 Severe
- Heat 6/10 Major 7 d/yr ≥97°F today · 15 d/yr by 30 yrs out
- Wind 1/10 Low
- Air quality 10/10 Extreme 27 unhealthy d/yr today · 30 by 30 yrs out
Nearby sold comps map
Loading sold comps map…
Walkable amenities ~0.75 mi
Loading nearby amenities…
Taxation est. · year 1
- Rental income
- $21,288
- − Mortgage interest
- −$6,162
- − Property taxes
- −$1,650
- − Insurance
- −$550
- − Repairs & maintenance
- −$1,703
- − Management
- −$1,703
- − Depreciation
- −$3,200
- Taxable income
- $6,320
- Est. tax owed @ 24.0%
- −$1,517
- After-tax cash flow
- $6,178/yr
For passive investors: Depreciation is non-cash, so a rental often shows a tax loss while cash-flowing — sheltering income. Rental losses are passive: they offset passive income freely, and up to $25,000/yr can offset ordinary (W-2) income if you actively participate and your MAGI is under $100k (phasing out to $0 by $150k); unused losses carry forward. On sale, claimed depreciation is recaptured at up to 25%, and gains may owe capital-gains tax (a 1031 exchange can defer both). Figures are a year-1 estimate at your 24.0% rate — not tax advice; consult a CPA.
Condition & rehab AI · 12 photos
This well-maintained manufactured home offers a good condition with recent updates and a good curb appeal. It is ready for a new owner to move in and enjoy.
Value-add opportunities
- Both Painting exterior and interior — Fresh paint enhances curb appeal and interior aesthetics
- Both Upgrading HVAC system — Modern HVAC improves comfort and energy efficiency
- Both Landscaping improvements — Enhances curb appeal and adds value
Renovation cost estimate screening
Value-add ROI direction
- Both Painting exterior and interior — Fresh paint enhances curb appeal and interior aesthetics ↑
- Both Upgrading HVAC system — Modern HVAC improves comfort and energy efficiency ↑
- Both Landscaping improvements — Enhances curb appeal and adds value ↑
ⓘ Cost ranges are severity-bucket heuristics (US national rule-of-thumb). Get contractor quotes + a written scope before underwriting a rehab budget.
Schools (NCES district)
- District
- Phoenix-Talent SD 4
- NCES district ID
- 4109630
- Math proficiency
- 14% ▼ -9.00%
- Reading proficiency
- 32% ▼ -8.00%
- Median HH income
- $38,625
- Composite
- 19.24/100
- National rank
- #8809
- State rank
- #58 of 58 in OR
Livability — Medford
- Score
- 76/100
- State rank
- #78
- US rank
- #3467
Category grades
Schools grade is shown separately in the Schools card above.
Census & demographics
- County
- Jackson County · 159,661 people
- City population
- 95,759
- Metro
- Medford, OR
- Population (ZIP)
- 44,670
- Household income
- $63,977
- Rent vs Own
- Severe rent burden
- 1799.0
Population outlook (Jackson County) Hauer SSP2
- Today (2025)
- 234,433 people
- By 2030
- 243,834 · +4.0%
- By 2040
- 259,717 · +10.8%
- By 2050
- 273,269 · +16.6%
- By 2075
- 300,624 · +28.2%
- By 2100
- 305,256 · +30.2%
Race, ethnicity, and origin ACS 2023
- Neighborhood character
- Predominantly White (72%)
- Race & ethnicity
- White 72% Hispanic / Latino 18% Two or more races 16% Black 1%
- Hispanic origin (detail)
- Mexican 15%
- Common ancestry
- Slovak 2% Portuguese 2% Italian 2%
- Foreign-born
- 6% · Canada
- Languages at home
- 88% English-only · Spanish 10%
Political lean MEDSL · Jackson
- 2024 margin
- Lean R (+6.4) · D 45.5% · R 51.9% · Other 2.6%
- 2008→2024 swing
- -6.5pp toward R · 2008: 0.1pp · 2024: -6.4pp
- All cycles
- 2024: R+6.4 2020: R+3.5 2016: R+9.2 2012: R+5.0 2008: D+0.1
Not yet ingested
- Civics
- —
Market trends
- HPI YoY
- ▼ -428.31%
- Current HPI
- 248.6495
- Rent YoY
- ▲ 2.53%
- Metro
- Medford, OR
- State GDP YoY
- ▲ 2.05%
- F500 in state
- 2
Industry mix (Fortune 500 HQ in OR)
| Industry | F500 HQs | Revenue |
|---|---|---|
| Consumer Goods | 1 | $51B |
|
||
Price history
1 event — show timeline
- 2026-05-29 Listed $110,000 MLSCO
Cash-flow waterfall
monthlySold comps — $/sqft
last 12 mo · ≤1 miLoading sold comps…