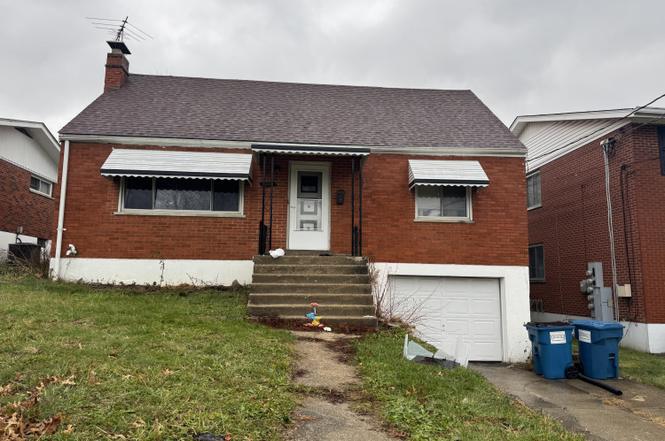
328 Sunset Ave · Erlanger, KY
Flood risk 1/10 · Minimal
- FEMA flood zone
- X (unshaded)
- Chance of flooding over 30 yrs
- 0.0%
- Est. flood insurance / yr
- $507 – $1,088
Fire risk 1/10 · Minimal
- Est. fire insurance / yr
- $839 – $1,559
Heat risk 4/10 · Minor
- Hot days now (above 101°F)
- 7 days/yr
- Hot days in 30 yrs
- 19 days/yr
Wind risk 2/10 · Minimal
- Chance of severe wind over 30 yrs
- 1.0%
Air-quality risk 2/10 · Minimal
- Unhealthy air days now
- 1 days/yr
- Unhealthy air days in 30 yrs
- 3 days/yr
Risk factors via First Street. Map © Google.
Why this score? — see what drove the B- grade
The composite is a weighted blend of 9 inputs, each scored 0–100. Each bar is that input's sub-score; the figure is the points it added to the 100-point composite (weight × sub-score).
- Cash flow +30.0/30.0
- DSCR +10.0/10.0
- 1% rule +9.8/10.0
- ARV discount +7.5/15.0
- Rent growth +3.6/5.0
- Livability +3.6/5.0
- Condition / age +2.5/5.0
- Schools +2.3/10.0
- Appreciation +0.0/10.0
$110,000
🖨 Deal sheet (PDF) 📄 Offer letter ✓ Due diligence
Listing remarks MLS
Super cute 4 bed cape cod w/ 3 finished levels, 1-car garage & spacious yard! Nice kitchen w/ granite counters & SS appliances. Hardwood floors, updated bathroom, family room addition on the back of the house w/ brand new carpet. Finished rec room in the basement and plenty of room for storage. Well maintained property!
Key facts
- 7,935 sq ft lot
- Garage
Neighborhood map
What this means for you Summary
Snapshot
- This is a 3-bed/1.5-bath single-family listed at $110k.
Deal economics
- At list price, monthly cash flow is $454 ($5k/yr) — positive.
- The deal already cash-flows at list — no discount required.
- Meets the 1% rule at list price ($2k rent vs $110k).
- Cap rate 11.2% vs local median 3.8% in Erlanger — top-decile yield for the area; either an underpriced asset or a hidden risk that comps aren't pricing in. Stress-test before assuming the spread holds.
Location & tenants
- Location reads 72/100 on livability (#126 in KY) — a middle-class / working-renter tenant base. Strengths: crime A+, cost of living A+, housing A+; Watch: amenities F, commute F, health & safety F.
- Erlanger-Elsmere Independent (suburban): math 21% / reading 32% proficiency, ranked #128 of 165 in KY (top 78%) — low school quality limits family demand, transient renter base, plan for 1-2y turnover.
- Zoned schools: Miles Elementary School (math 27% / reading 22%, grade F, #489 of 676 statewide, top 76%, 230 students, 50% FRL); Tichenor Middle School (math 19% / reading 38%, grade F, #161 of 217 statewide, top 75%, 539 students, 54% FRL); Lloyd High School (math 22% / reading 32%, grade F, #158 of 254 statewide, top 68%, 697 students, 57% FRL) — zoned schools at 53% FRL track the district average.
- Market conditions: Rents rising fast (+4.2%/yr); 124 active listings in the ZIP; 19 comparable units currently listed for rent nearby; rentals at typical pace (median 16d on market — plan ~3-4 weeks tenant-placement turnaround); 699 units permitted in Kenton County in 2024 (287 in 5+ unit buildings).
Forward outlook
- Local home prices are declining (-3.0%/yr); year-one equity from $761 of loan paydown is wiped out by about $3k of value loss. Plan a longer hold.
- Kenton County population projected at +5% by 2050 — modest demand growth; plan on rents tracking national, not racing it.
- At projected returns (-3.0% appreciation + 4.2% rent growth), your $31k cash investment doubles in ~7 years — after that, you're playing with house money.
Negotiation context
- Only 1 days on market — expect competitive offers; lowballing is unlikely to land.
- 3 sale attempts since 5y ago with the ask held roughly flat each time — persistent listings suggest the price (not the market) is what's stuck; bring a comps-based counter.
Risks & watch-outs
- Watch-outs: built in 1959 — expect roof / HVAC / electrical / plumbing capex.
Questions for the listing agent
- Built in 1959 — when were the roof, HVAC, electrical panel, plumbing, and water heater last replaced?
- Is there a deadline driving the sale (1031 exchange, divorce, estate, relocation)? That informs how much negotiation room exists.
- Schools are F-rated, which usually means shorter tenancies and higher turnover. Who's the typical renter profile here, and what's been the actual vacancy rate?
- What's the average days-on-market for RENTAL listings here right now (not sales)? A rising rental-DOM trend means longer vacancies and softer asking-rent achievability than the comps imply.
- What's the recent tenant-quality profile in this submarket — average credit score on applications, eviction rate, late-payment / NSF rate, and stable-employment percentage? A property-management company in the area should have these aggregated.
- How much new for-sale + rental construction is in the pipeline within 1–3 miles? Heavy new supply typically softens prices + rents 12–24 months out; constrained supply supports both.
Investment metrics
- 1% rule
- 1.48% ✓
- Cap rate
- 11.25%
- Cash-on-cash
- 17.69%
- DSCR
- 1.79
- GRM
- 5.6
CMA / ARV
- ARV (on-the-fly)
- $260,142
- Comps found
- 12
Show comp detail 12 sales within ~0.75 mi
| Address | Dist | Beds/Ba | Sqft | Sold | Price | $/sf | Match |
|---|---|---|---|---|---|---|---|
| 328 Sunset Ave | 0.00mi | 3/1.5 | 1,362 (0%) | 0mo | $147,000 | $108 | 100 |
| 4112 Lloyd Ave | 0.23mi | 3/1.5 | 1,315 (-4%) | 2mo | $270,000 | $205 | 82 |
| 101 Lexington Ave | 0.57mi | 3/2.0 | 1,368 (+0%) | 4mo | $220,000 | $161 | 67 |
| 3917 Rankin Dr | 0.33mi | 3/2.0 | 1,242 (-9%) | 6mo | $237,000 | $191 | 63 |
| 41 Linwood Ave | 0.23mi | 3/1.5 | 1,188 (-13%) | 6mo | $272,000 | $229 | 63 |
| 20 Drexel Ave | 0.50mi | 4/2.0 (+1) | 1,428 (+5%) | 2mo | $250,000 | $175 | 59 |
| 404 Mcalpin Ave | 0.33mi | 3/1.0 | 1,176 (-14%) | 3mo | $242,500 | $206 | 57 |
| 411 Swan Cir | 0.72mi | 4/2.5 (+1) | 1,368 (+0%) | 1mo | $262,500 | $192 | 56 |
| 409 Lytle Ave | 0.59mi | 3/2.0 | 1,225 (-10%) | 1mo | $199,500 | $163 | 53 |
| 9 Park Ave | 0.58mi | 4/2.0 (+1) | 1,263 (-7%) | 2mo | $257,500 | $204 | 52 |
| 403 Locust St | 0.74mi | 4/1.5 (+1) | 1,286 (-6%) | 6mo | $225,000 | $175 | 46 |
| 712 Bedinger St | 0.61mi | 2/1.0 (-1) | 1,197 (-12%) | 2mo | $227,000 | $190 | 43 |
Match score weights: distance 35% · size 25% · config 20% · recency 20%. Top-matched comps best support the ARV.
Projected returns pro-forma
-3.0% appreciation · 4.22% rent growth · sell at horizon
- IRR
- 10.6%
- Equity multiple
- 1.43×
- Total profit
- $13,174
- Equity at exit
- $16,401
- IRR
- 20.8%
- Equity multiple
- 2.87×
- Total profit
- $57,462
- Equity at exit
- $9,511
Cash invested: $30,800 (down + closing). Projections, not guarantees.
Landlord ↔ Tenant lean methodology
- Overall (STATE)
- 83 Strongly Landlord-Friendly
- State Kentucky
- 83 Strongly Landlord-Friendly · R+16
- County
- — inherits STATE
- City
- — inherits STATE
ZIP-level market 41018
- Rents YoY
- 4.2%
- Active inventory
- 124
- Price-to-rent
- 5.6×
Monthly cashflow live
- Estimated rent
- $1,624 high interval (Pro) →
- Mortgage (P&I)
- −$577
- Tax from tax record
- −$206 /mo · $2,474/yr
- Insurance
- −$46
- HOA
- −$0
- Vacancy / Maint / Mgmt
- −$341
- Net cashflow
- $454
Break-even live
Sensitivity live
| Price | -10% $516 | -5% $485 | +0% $454 | +5% $423 | +10% $392 |
|---|---|---|---|---|---|
| Rent | -10% $326 | -5% $390 | +0% $454 | +5% $518 | +10% $582 |
| Rate | -1.0pp $509 | -0.5pp $482 | base $454 | +0.5pp $425 | +1.0pp $396 |
UW: 25.0% down · 7.5% · 30yr · 1.5% tax · 5.0% vac · 8.0% maint · 8.0% mgmt
Financing live
Cash to close
- Down payment
- $27,500
- Closing costs
- $3,300
- Reserves months
- —
- Total cash needed
- —
Loan-product check · same deal, 3 products live
Conventional
25% down · 7.5% · 30yr
- Down + closing
- —
- Monthly P&I
- —
- Monthly cashflow
- —
- DSCR
- —
- Eligible?
- —
Personal DTI + credit; lowest rate.
DSCR
20% down · 8.5% · 30yr
- Down + closing
- —
- Monthly P&I
- —
- Monthly cashflow
- —
- DSCR
- —
- Eligible?
- —
No personal income docs; deal must DSCR.
Hard money
10% down · 12.0% · 12mo
- Down + closing
- —
- Monthly P&I
- —
- Monthly cashflow
- —
- DSCR
- —
- Eligible?
- —
Short-term bridge; refi at stabilization.
Rent comps 19 comps
| Address | Beds | Baths | Sqft | Rent | $/sqft | DOM | Units | Dist |
|---|---|---|---|---|---|---|---|---|
| 159 Green River Dr Erlanger, KY | 2.0 | 2.0 | 1278 | $1,595 | $1.25 | 3d | 1 | 0.19mi |
| 3904 Lori Dr Erlanger, KY | 1.0–2.0 | 1.0–1.5 | 722 | $1,335 | $1.85 | 3d | 12 | 0.41mi |
| 121 Carlisle St Elsmere, KY | 3.0 | 2.0 | 1650 | $2,000 | $1.21 | 16d | 1 | 0.48mi |
| 7222 Isaac Ln Florence, KY | 3.0 | 2.0 | 1400 | $1,795 | $1.28 | 17d | 1 | 0.53mi |
| 6805 Sebree Dr Florence, KY | 1.0–3.0 | 1.0–1.5 | 901 | $1,718 | $1.91 | 3d | 14 | 0.87mi |
| 868 Virginiabradford Ct Elsmere, KY | 3.0 | 2.5 | 974 | $3,500 | $3.59 | 3d | 1 | 0.98mi |
| 4787 Houston Rd Florence, KY | 1.0–3.0 | 1.0–2.0 | 1025 | $2,316 | $2.26 | 3d | 25 | 0.98mi |
| 580 Erlanger Rd Unit 580-5 Erlanger, KY | 2.0 | 1.5 | 883 | $1,475 | $1.67 | 45d | 1 | 1.00mi |
| 3235 N Talbot Ave Unit 3235-2 Erlanger, KY | 3.0 | 1.5 | 1032 | $1,675 | $1.62 | 17d | 1 | 1.00mi |
| 3231 N Talbot Ave Unit 3231-5 Erlanger, KY | 2.0 | 1.5 | 883 | $1,475 | $1.67 | 24d | 1 | 1.04mi |
| 3234 N Talbot Ave Unit 3234-5 Erlanger, KY | 2.0 | 1.5 | 883 | $1,475 | $1.67 | 16d | 1 | 1.05mi |
| 9 Eagle Dr Elsmere, KY | 3.0 | 2.0 | 960 | $1,328 | $1.38 | 24d | 1 | 1.10mi |
| 3223 N Talbot Ave Unit 3223-7 Erlanger, KY | 2.0 | 1.5 | 883 | $1,475 | $1.67 | 22d | 1 | 1.12mi |
| 43 Banklick St Florence, KY | 2.0 | 2.0 | 1265 | $1,355 | $1.07 | 4d | 3 | 1.12mi |
| 109 Dove Dr Elsmere, KY | 3.0 | 2.0 | 960 | $1,328 | $1.38 | 3d | 1 | 1.15mi |
| 3219 N Talbot Ave Unit 3219-4 Erlanger, KY | 2.0 | 1.5 | 883 | $1,475 | $1.67 | 45d | 1 | 1.16mi |
| 64 Eagle Dr Elsmere, KY | 3.0 | 2.0 | 960 | $1,328 | $1.38 | 8d | 1 | 1.24mi |
| 104 Dove Dr Elsmere, KY | 3.0 | 2.0 | 924 | $1,295 | $1.40 | 16d | 1 | 1.26mi |
| 682 Mimosa Ct Erlanger, KY | 3.0 | 2.0 | 1600 | $2,136 | $1.33 | 8d | 1 | 1.37mi |
Listing history 8 events
-
2026-01-20status Pending
-
2026-01-19$110,000 Active
-
2021-09-24soldstatus $186,000 Closed 329-char remark
Show marketing remark (329 chars)
Super cute 4 bed cape cod w/ 3 finished levels, 1-car garage & spacious yard! Nice kitchen w/ granite counters & SS appliances. Hardwood floors, updated bathroom, family room addition on the back of the house w/ brand new carpet. Finished rec room in the basement and plenty of room for storage. Well maintained property!
-
2021-08-14status Pending 329-char remark
Show marketing remark (329 chars)
Super cute 4 bed cape cod w/ 3 finished levels, 1-car garage & spacious yard! Nice kitchen w/ granite counters & SS appliances. Hardwood floors, updated bathroom, family room addition on the back of the house w/ brand new carpet. Finished rec room in the basement and plenty of room for storage. Well maintained property!
-
2021-08-07historical
-
2021-08-06$184,900 Active 329-char remark
Show marketing remark (329 chars)
Super cute 4 bed cape cod w/ 3 finished levels, 1-car garage & spacious yard! Nice kitchen w/ granite counters & SS appliances. Hardwood floors, updated bathroom, family room addition on the back of the house w/ brand new carpet. Finished rec room in the basement and plenty of room for storage. Well maintained property!
-
2021-07-22$194,900 Active
-
2015-03-02soldstatus $75,000
ⓘ Source: listings_history table (triggers on properties + properties_extension) + one-shot
backfill from property_details.listing_events for pre-trigger history.
Tax reassessment forecast KY · Resets to sale price
- Current annual tax
- $2,474 · $206/mo
- Projected year-2 tax
- $2,474 · $206/mo
- Expected delta
- $0/yr ($0/mo · 0.0%)
ⓘ Screening estimate from a state-policy table — verify with the county assessor before closing.
Climate risk First Street
- Flood 1/10 Low FEMA zone X (unshaded) · 0% chance over 30 yrs
- Wildfire 1/10 Low
- Heat 4/10 Moderate 7 d/yr ≥101°F today · 19 d/yr by 30 yrs out
- Wind 2/10 Low 100% chance of damaging wind over 30 yrs
- Air quality 2/10 Low 1 unhealthy d/yr today · 3 by 30 yrs out
Nearby sold comps map
Loading sold comps map…
Walkable amenities ~0.75 mi
Loading nearby amenities…
Taxation est. · year 1
- Rental income
- $19,486
- − Mortgage interest
- −$6,162
- − Property taxes
- −$2,474
- − Insurance
- −$550
- − Repairs & maintenance
- −$1,559
- − Management
- −$1,559
- − Depreciation
- −$3,200
- Taxable income
- $3,983
- Est. tax owed @ 24.0%
- −$956
- After-tax cash flow
- $4,492/yr
For passive investors: Depreciation is non-cash, so a rental often shows a tax loss while cash-flowing — sheltering income. Rental losses are passive: they offset passive income freely, and up to $25,000/yr can offset ordinary (W-2) income if you actively participate and your MAGI is under $100k (phasing out to $0 by $150k); unused losses carry forward. On sale, claimed depreciation is recaptured at up to 25%, and gains may owe capital-gains tax (a 1031 exchange can defer both). Figures are a year-1 estimate at your 24.0% rate — not tax advice; consult a CPA.
Schools (NCES district)
- District
- Erlanger-Elsmere Independent
- NCES district ID
- 2101740
- Math proficiency
- 21% ▼ -10.00%
- Reading proficiency
- 32% ▼ -11.00%
- Median HH income
- $47,377
- Composite
- 23.01/100
- National rank
- #7975
- State rank
- #128 of 165 in KY
Livability — Erlanger
- Score
- 72/100
- State rank
- #126
- US rank
- #5933
Category grades
Schools grade is shown separately in the Schools card above.
Census & demographics
- Census place
- Erlanger, KY
- County
- Kenton County · 142,881 people
- City population
- 28,940
- Metro
- Cincinnati, OH-KY-IN
- Population (ZIP)
- 28,940
- Household income
- $68,605
- Rent vs Own
- Severe rent burden
- 678.0
Population outlook (Kenton County) Hauer SSP2
- Today (2025)
- 174,205 people
- By 2030
- 177,897 · +2.1%
- By 2040
- 182,671 · +4.9%
- By 2050
- 183,543 · +5.4%
- By 2075
- 178,977 · +2.7%
- By 2100
- 159,920 · -8.2%
Race, ethnicity, and origin ACS 2023
- Neighborhood character
- Predominantly White (83%)
- Race & ethnicity
- White 83% Two or more races 7% Hispanic / Latino 5% Black 5% Asian 1%
- Hispanic origin (detail)
- Mexican 3%
- Common ancestry
- Slovak 3% Italian 2% Lithuanian 1%
- Foreign-born
- 4% · Canada, Vietnam
- Languages at home
- 94% English-only · Spanish 4%
Political lean MEDSL · Kenton
- 2024 margin
- Strong R (+21.7) · D 38.2% · R 59.9% · Other 1.9%
- 2008→2024 swing
- -0.9pp no change · 2008: -20.9pp · 2024: -21.7pp
- All cycles
- 2024: R+21.7 2020: R+19.3 2016: R+26.1 2012: R+24.3 2008: R+20.9
Not yet ingested
- Civics
- —
Market trends
- HPI YoY
- ▼ -211.57%
- Current HPI
- 215.9599
- Rent YoY
- ▲ 4.22%
- Metro
- Cincinnati, OH-KY-IN
- State GDP YoY
- ▲ 1.81%
- F500 in state
- 4
Industry mix (Fortune 500 HQ in KY)
| Industry | F500 HQs | Revenue |
|---|---|---|
| Healthcare | 1 | $118B |
|
||
| Food / Beverage | 1 | $7B |
|
||
Price history
+46.7% since first listed8 events — show timeline
- 2026-01-20 Pending — NKMLS
- 2026-01-19 Listed $110,000 NKMLS
- 2021-09-24 Sold (MLS) $186,000 NKMLS
- 2021-08-14 Pending — NKMLS
- 2021-08-07 Listing Removed — NKMLS
- 2021-08-06 Listed $184,900 NKMLS
- 2021-07-22 Listed $194,900 NKMLS
- 2015-03-02 Sold (Public Records) $75,000 Public Records
Property tax history
+10.5%/yrLatest (2025): $2,474 · -1.2% YoY. Source: county tax records.
Cash-flow waterfall
monthlySold comps — $/sqft
last 12 mo · ≤1 miLoading sold comps…