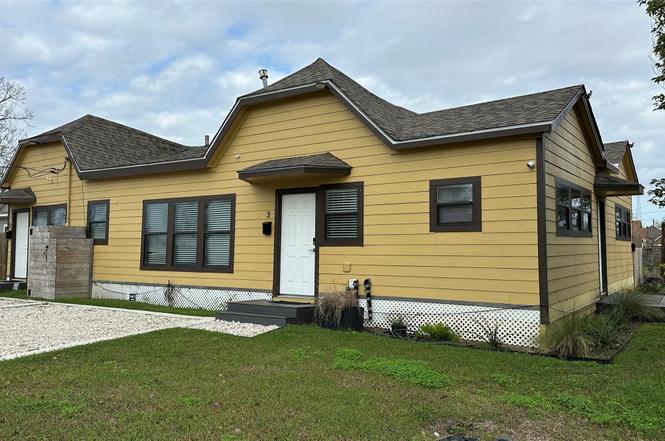
 Triplex
2527 Sumpter St · Houston, TX
Flood risk 6/10 · Moderate
- FEMA flood zone
- X (unshaded)
- Chance of flooding over 30 yrs
- 0.73%
- Est. flood insurance / yr
- $507 – $1,088
Fire risk 1/10 · Minimal
- Est. fire insurance / yr
- $1,222 – $2,270
Heat risk 9/10 · Severe
- Hot days now (above 109°F)
- 7 days/yr
- Hot days in 30 yrs
- 24 days/yr
Wind risk 9/10 · Severe
- Chance of severe wind over 30 yrs
- 99.0%
Air-quality risk 3/10 · Minor
- Unhealthy air days now
- 2 days/yr
- Unhealthy air days in 30 yrs
- 3 days/yr
Risk factors via First Street. Map © Google.
Why this score? — see what drove the F grade
The composite is a weighted blend of 9 inputs, each scored 0–100. Each bar is that input's sub-score; the figure is the points it added to the 100-point composite (weight × sub-score).
- Cash flow +7.3/30.0
- Appreciation +6.9/10.0
- Livability +3.7/5.0
- Rent growth +3.3/5.0
- Schools +2.7/10.0
- Condition / age +2.5/5.0
- 1% rule +1.6/10.0
- DSCR +1.5/10.0
- ARV discount +0.0/15.0
$489,900
🖨 Deal sheet (PDF) 📄 Offer letter ✓ Due diligence
Multi-family units
County records classify this as Multi-Family (2-4 Unit). Listing-text estimate: 3 units. confirmed
Listing remarks MLS
3 Unit Apartment building consisting of One 2 Bedroom Unit, One 1 Bedroom Unit and One Efficiency apartment. Grab ahold of your piece of this Houston Real Estate investment and take advantage of the opportunity to Fix and Flip or Buy and Hold.
Key facts
- Short term rentals
- Historic charm
- Modernized systems
Tags
Property features AI
Finance
- Other: Owner is the listing agent
Exterior
- Utilities: Electricity available; Water available; Cable available
- Home design: Residential income property built in 1935; Total building area about 1,768
- Construction: Built in 1935
- Exterior features: 3500 square foot lot; Composition roof
Interior
- Bedrooms: One unit with 1 bedroom; One unit with 2 bedrooms (two identical units)
- Bathrooms: 5 full bathrooms in the building
- Heating & cooling: Central heating (electric); Central air conditioning (electric)
- Interior features: Three dwelling units in the building (total of 3 units)
Neighborhood map
What this means for you Summary
Snapshot
- This is a 2×2bd/2.0ba + 1×1bd/1.0ba units multifamily listed at $490k.
Deal economics
- At list price, monthly cash flow is $-650 ($-8k/yr) — negative. Per door: $-217/mo.
- To cash-flow at today's rent, offer at most $375k (23.4% below list).
- To meet the 1% rule (rent ≥ 1% of price), the offer needs to be $325k (33.6% below list).
- Recommended offer: $325k (33.6% below list) — sets the bar for 1% rule.
- Cap rate 4.7% vs local median 3.2% in Houston — top-decile yield for the area; either an underpriced asset or a hidden risk that comps aren't pricing in. Stress-test before assuming the spread holds.
Location & tenants
- Location reads 74/100 on livability (#184 in TX, #4,771 nationally) — a middle-class / working-renter tenant base. Strengths: amenities A+, cost of living A+, housing A+; Watch: crime F.
- Houston ISD (urban): math 27% / reading 35% proficiency, ranked #593 of 826 in TX (top 72%) — families likely to look elsewhere, expect single-tenant / working-renter base with shorter leases; 71% free/reduced lunch — lower-income household profile, screen leases tightly.
- Zoned schools: Sherman El (math 22% / reading 22%, grade F, #3,333 of 4,322 statewide, top 80%, 528 students, 99% FRL); Fleming Middle (math 10% / reading 15%, grade F, #1,616 of 1,662 statewide, top 97%, 384 students, 97% FRL); Northside H S (math 15% / reading 26%, grade F, #1,389 of 1,632 statewide, top 86%, 1,168 students, 94% FRL) — zoned schools average 97% FRL vs 71% district-wide (26 pts higher); higher-poverty schools than district average — tighter screening recommended.
- Zoned-school proficiency averages 18% at this address vs 31% district-wide (-13 pts) — the specific schools serving this property underperform the Houston ISD average; the district grade overstates school quality for this exact location.
- Market conditions: Rents rising (+3.1%/yr); 448 active listings in the ZIP; 37 comparable units currently listed for rent nearby; rentals at typical pace (median 23d on market — plan ~3-4 weeks tenant-placement turnaround); 46% of comp listings sitting > 30 days — soft ceiling on asking rent; lower-income renter base — watch delinquency; 29,883 units permitted in Harris County in 2024 (8,621 in 5+ unit buildings).
Forward outlook
- In year one you build about $22k of equity ($3k loan paydown + $19k appreciation (3.9% local appreciation)).
- Harris County population projected at +47% by 2050 — long-run rental-demand tailwind backs the buy-and-hold thesis.
- By year 2, paydown + projected appreciation supports a ~$36k cash-out refi (75% LTV) — recoverable capital for the next deal without selling this one.
Negotiation context
- Only 7 days on market — expect competitive offers; lowballing is unlikely to land.
- 3 sale attempts since 8y ago with the ask held roughly flat each time — persistent listings suggest the price (not the market) is what's stuck; bring a comps-based counter.
Risks & watch-outs
- Watch-outs: built in 1935 — expect roof / HVAC / electrical / plumbing capex.
- Climate carrying-cost: major flood risk; severe wind risk, 99% chance of damaging wind over 30y; extreme-heat days projected 7→24/yr by 2055 (HVAC capex compounding) — expect insurance premiums to compound above CPI over the hold.
Questions for the listing agent
- What do current leases actually rent for vs. the listed asking? Can we see a recent rent roll and the last 12 months of T-12 income?
- Can we see the unit-by-unit rent roll, current vacancy, and any below-market leases? What's the average tenancy length?
- What capital expenditures (roof, boiler, parking lot, exteriors) have been made in the last 5 years, and what's planned in the next 2?
- Built in 1935 — when were the roof, HVAC, electrical panel, plumbing, and water heater last replaced?
- Is there a deadline driving the sale (1031 exchange, divorce, estate, relocation)? That informs how much negotiation room exists.
- Schools are D-rated, which usually means shorter tenancies and higher turnover. Who's the typical renter profile here, and what's been the actual vacancy rate?
- Crime grade is F in this area — have there been break-ins, vandalism, or insurance claims at this property in the last 3 years? What carrier currently insures it and at what premium?
- The area grade is low — what's the realistic commute time and amenity access for the typical tenant pool here? Any planned neighborhood developments (good or bad) we should know about?
- What's the average days-on-market for RENTAL listings here right now (not sales)? A rising rental-DOM trend means longer vacancies and softer asking-rent achievability than the comps imply.
- What's the recent tenant-quality profile in this submarket — average credit score on applications, eviction rate, late-payment / NSF rate, and stable-employment percentage? A property-management company in the area should have these aggregated.
- How much new apartment / multifamily construction is in the pipeline within 1–3 miles? Heavy new supply (>2% of stock underway) typically softens rents 12–24 months out; light construction supports rent growth.
Investment metrics
- 1% rule
- 0.66% ✗
- Cap rate
- 4.70%
- Cash-on-cash
- -5.68%
- DSCR
- 0.75
- GRM
- 12.5
CMA / ARV
- ARV (on-the-fly)
- $367,744
- Comps found
- 1
Show comp detail 1 sale within ~0.75 mi
| Address | Dist | Beds/Ba | Sqft | Sold | Price | $/sf | Match |
|---|---|---|---|---|---|---|---|
| 3114 Market St | 0.62mi | 2/1.0 (-1) | 1,872 (+6%) | 9mo | $390,000 | $208 | 40 |
Match score weights: distance 35% · size 25% · config 20% · recency 20%. Top-matched comps best support the ARV.
Projected returns pro-forma
3.89% appreciation · 3.08% rent growth · sell at horizon
- IRR
- 5.0%
- Equity multiple
- 1.30×
- Total profit
- $41,382
- Equity at exit
- $245,322
- IRR
- 7.8%
- Equity multiple
- 2.30×
- Total profit
- $177,671
- Equity at exit
- $398,818
Cash invested: $137,172 (down + closing). Projections, not guarantees.
Landlord ↔ Tenant lean methodology
- Overall (STATE)
- 87 Strongly Landlord-Friendly
- State Texas
- 87 Strongly Landlord-Friendly · R+5
- County
- — inherits STATE
- City
- — inherits STATE
ZIP-level market 77026
- Home prices YoY
- 1.5%
- Rents YoY
- 3.1%
- Active inventory
- 448
- Price-to-rent
- 36.9×
Monthly cashflow live
- Estimated rent
- $3,253 high interval (Pro) →
- Mortgage (P&I)
- −$2,569
- Tax from tax record
- −$446 /mo · $5,357/yr
- Insurance
- −$204
- HOA
- −$0
- Vacancy / Maint / Mgmt
- −$683
- Net cashflow
- $-650
Break-even live
Sensitivity live
| Price | -10% $-372 | -5% $-511 | +0% $-650 | +5% $-788 | +10% $-927 |
|---|---|---|---|---|---|
| Rent | -10% $-907 | -5% $-778 | +0% $-650 | +5% $-521 | +10% $-393 |
| Rate | -1.0pp $-403 | -0.5pp $-525 | base $-650 | +0.5pp $-777 | +1.0pp $-906 |
3-unit breakdown (identical units grouped — click to expand)
| Units | Beds | Baths | Est. rent |
|---|---|---|---|
| 2× units | 2 | 2 | $2,214 |
| #1 | 2 | 2 | $1,107 |
| #2 | 2 | 2 | $1,107 |
| 1× unit | 1 | 1 | $1,040 |
| Total (3 units) | $3,253 | ||
UW: 25.0% down · 7.5% · 30yr · 1.5% tax · 5.0% vac · 8.0% maint · 8.0% mgmt
Financing live
Cash to close
- Down payment
- $122,475
- Closing costs
- $14,697
- Reserves months
- —
- Total cash needed
- —
Loan-product check · same deal, 3 products live
Conventional
25% down · 7.5% · 30yr
- Down + closing
- —
- Monthly P&I
- —
- Monthly cashflow
- —
- DSCR
- —
- Eligible?
- —
Personal DTI + credit; lowest rate.
DSCR
20% down · 8.5% · 30yr
- Down + closing
- —
- Monthly P&I
- —
- Monthly cashflow
- —
- DSCR
- —
- Eligible?
- —
No personal income docs; deal must DSCR.
Hard money
10% down · 12.0% · 12mo
- Down + closing
- —
- Monthly P&I
- —
- Monthly cashflow
- —
- DSCR
- —
- Eligible?
- —
Short-term bridge; refi at stabilization.
Rent comps 37 comps
| Address | Beds | Baths | Sqft | Rent | $/sqft | DOM | Units | Dist |
|---|---|---|---|---|---|---|---|---|
| 3300 Lyons Ave Unit 304 Houston, TX | 4.0 | 2.0 | 1393 | $1,460 | $1.05 | 45d | 1 | 0.53mi |
| 1307 Bayou St Unit B Houston, TX | 3.0 | 3.0 | 1814 | $2,400 | $1.32 | 9d | 1 | 0.61mi |
| 1303 Bayou St Unit C Houston, TX | 3.0 | 3.0 | 1869 | $3,200 | $1.71 | 45d | 1 | 0.62mi |
| 1513 Cage St Houston, TX | 3.0 | 2.0 | 1467 | $1,550 | $1.06 | 45d | 1 | 0.63mi |
| 1250 Leona St Houston, TX | 2.0 | 1.0–2.0 | 885 | $1,990 | $2.25 | 0d | 15 | 0.82mi |
| 2706 Cochran St Houston, TX | 3.0 | 3.5 | 1791 | $2,700 | $1.51 | 21d | 1 | 0.83mi |
| 2905 Baer St Unit 1047953P Houston, TX | 3.0 | 2.5 | 1991 | $2,922 | $1.47 | 1d | 1 | 0.85mi |
| 611 Sydnor St Houston, TX | 3.0 | 4.0 | 2157 | $2,400 | $1.11 | 45d | 1 | 0.91mi |
| 3410 Baer St Houston, TX | 3.0 | 4.0 | 2040 | $3,500 | $1.72 | 45d | 1 | 0.99mi |
| 3419 Gillespie St Houston, TX | 3.0 | 3.5 | 2168 | $2,300 | $1.06 | 45d | 1 | 1.02mi |
| 4300 Lyons Ave Unit 304 Houston, TX | 4.0 | 2.0 | 1393 | $1,460 | $1.05 | 45d | 1 | 1.06mi |
| 308 Grove St Houston, TX | 3.0 | 3.0 | 1701 | $2,350 | $1.38 | 9d | 1 | 1.08mi |
| 1625 N Main St Houston, TX | 3.0 | 1.0–3.0 | 994 | $2,354 | $2.37 | 1d | 41 | 1.09mi |
| 4109 Hare St Unit A Houston, TX | 4.0 | 2.5 | 1913 | $6,950 | $3.63 | 45d | 1 | 1.12mi |
| 4109 Hare St Unit 1019559P Houston, TX | 4.0 | 2.5 | 1905 | $6,852 | $3.60 | 9d | 1 | 1.12mi |
| 91 Jensen Dr Houston, TX | 3.0 | 1.0–2.5 | 970 | $3,420 | $3.52 | 0d | 67 | 1.16mi |
| 2403 Everett St Unit A Houston, TX | 3.0 | 3.5 | 2093 | $2,800 | $1.34 | 45d | 1 | 1.17mi |
| 410 James St Unit 1031793P Houston, TX | 3.0 | 2.0 | 1593 | $5,668 | $3.56 | 1d | 1 | 1.18mi |
| 410 James St Houston, TX | 3.0 | 2.0 | 1602 | $6,750 | $4.21 | 45d | 1 | 1.18mi |
| 1222 Upton St Houston, TX | 3.0 | 4.0 | 2055 | $2,600 | $1.27 | 45d | 1 | 1.26mi |
| 4509 Courtney St Houston, TX | 4.0 | 1.0 | 1456 | $1,150 | $0.79 | 24d | 1 | 1.27mi |
| 914 Bunton St Houston, TX | 3.0 | 2.0 | 1389 | $1,950 | $1.40 | 45d | 1 | 1.28mi |
| 4706 Hershe St Houston, TX | 3.0 | 2.5 | 2283 | $3,300 | $1.45 | 45d | 1 | 1.30mi |
| 4712 Rawley St Unit B Houston, TX | 3.0 | 2.5 | 1501 | $2,045 | $1.36 | 22d | 1 | 1.31mi |
| 4712 Rawley St Unit a Houston, TX | 3.0 | 2.0 | 1501 | $2,070 | $1.38 | 22d | 1 | 1.31mi |
| 6 N Main St Houston, TX | 2.0 | 2.0 | 1248 | $2,453 | $1.97 | 45d | 1 | 1.31mi |
| 6 N Main St Houston, TX | 2.0 | 2.0 | 1248 | $2,453 | $1.97 | 22d | 1 | 1.31mi |
| 2115 Runnels St Unit 3174 Houston, TX | 3.0 | 2.0 | 1839 | $3,056 | $1.66 | 1d | 1 | 1.33mi |
| 2115 Runnels St Unit 3174 Houston, TX | 3.0 | 2.0 | 1839 | $3,056 | $1.66 | 14d | 1 | 1.33mi |
| 2115 Runnels St Unit 2148 Houston, TX | 3.0 | 2.0 | 1839 | $3,045 | $1.66 | 13d | 1 | 1.33mi |
| 2115 Runnels St Unit 3187 Houston, TX | 3.0 | 2.0 | 1839 | $3,005 | $1.63 | 1d | 1 | 1.33mi |
| 800 Middle St Houston, TX | 1.0–4.0 | 1.0–2.0 | 1003 | $1,593 | $1.59 | 7d | 1 | 1.40mi |
| 207 Carl St Houston, TX | 2.0 | 2.0 | 1230 | $2,250 | $1.83 | 45d | 1 | 1.41mi |
| 2315 Navigation Blvd Houston, TX | 1.0–2.0 | 1.0–2.5 | 943 | $3,500 | $3.71 | 0d | 62 | 1.43mi |
| 15 N Chenevert St Houston, TX | 2.0 | 1.0–2.0 | 1351 | $4,000 | $2.96 | 0d | 16 | 1.45mi |
| 915 Franklin St Unit 312202 Houston, TX | 2.0 | 2.0 | 1398 | $1,987 | $1.42 | 45d | 1 | 1.49mi |
| 915 Franklin St Unit ID51118 Houston, TX | 2.0 | 2.0 | 1342 | $2,000 | $1.49 | 45d | 1 | 1.49mi |
Listing history 6 events
-
2026-06-21days on market $489,900 Active 7 DOM
-
2026-06-18days on market $489,900 Active 4 DOM
-
2026-06-17days on market $489,900 Active 3 DOM
-
2026-06-16days on market $489,900 Active 2 DOM
-
2026-06-15remarks 699-char remark
-
2026-06-15$489,900 Active 1 DOM
ⓘ Source: listings_history table (triggers on properties + properties_extension) + one-shot
backfill from property_details.listing_events for pre-trigger history.
Tax reassessment forecast TX · Resets to sale price
- Current annual tax
- $5,357 · $446/mo
- Projected year-2 tax
- $8,965 · $747/mo
- Expected delta
- +$3,609/yr (+$301/mo · 67.4%)
ⓘ Screening estimate from a state-policy table — verify with the county assessor before closing.
Climate risk First Street
- Flood 6/10 Major FEMA zone X (unshaded) · 73% chance over 30 yrs
- Wildfire 1/10 Low
- Heat 9/10 Extreme 7 d/yr ≥109°F today · 24 d/yr by 30 yrs out
- Wind 9/10 Extreme 99% chance of damaging wind over 30 yrs
- Air quality 3/10 Moderate 2 unhealthy d/yr today · 3 by 30 yrs out
Nearby sold comps map
Loading sold comps map…
Walkable amenities ~0.75 mi
Loading nearby amenities…
Taxation est. · year 1
- Rental income
- $39,036
- − Mortgage interest
- −$27,442
- − Property taxes
- −$5,357
- − Insurance
- −$2,450
- − Repairs & maintenance
- −$3,123
- − Management
- −$3,123
- − Depreciation
- −$14,252
- Taxable loss
- −$16,710
- Est. tax savings @ 24.0%
- +$4,010
- After-tax cash flow
- $-3,786/yr
For passive investors: Depreciation is non-cash, so a rental often shows a tax loss while cash-flowing — sheltering income. Rental losses are passive: they offset passive income freely, and up to $25,000/yr can offset ordinary (W-2) income if you actively participate and your MAGI is under $100k (phasing out to $0 by $150k); unused losses carry forward. On sale, claimed depreciation is recaptured at up to 25%, and gains may owe capital-gains tax (a 1031 exchange can defer both). Figures are a year-1 estimate at your 24.0% rate — not tax advice; consult a CPA.
Schools (NCES district)
- District
- Houston ISD
- NCES district ID
- 4823640
- Math proficiency
- 27% ▼ -18.00%
- Reading proficiency
- 35% ▼ -6.00%
- Median HH income
- $46,054
- Composite
- 26.63/100
- National rank
- #7173
- State rank
- #593 of 826 in TX
Livability — Houston
- Score
- 74/100
- State rank
- #184
- US rank
- #4771
Category grades
Schools grade is shown separately in the Schools card above.
Census & demographics
- Census place
- Houston, TX
- County
- Harris County · 4,702,590 people
- City population
- 3,226,434
- Metro
- Houston-The Woodlands-Sugar Land, TX
- Population (ZIP)
- 21,981
- Household income
- $39,211
- Rent vs Own
- Severe rent burden
- 1531.0
Population outlook (Harris County) Hauer SSP2
- Today (2025)
- 5,571,493 people
- By 2030
- 6,089,821 · +9.3%
- By 2040
- 7,142,806 · +28.2%
- By 2050
- 8,185,864 · +46.9%
- By 2075
- 10,574,329 · +89.8%
- By 2100
- 12,109,958 · +117.4%
Race, ethnicity, and origin ACS 2023
- Neighborhood character
- Diverse neighborhood (Simpson 0.56)
- Race & ethnicity
- Black 49% Hispanic / Latino 44% Two or more races 18% White 5% Native American 1%
- Hispanic origin (detail)
- Mexican 34%
- Common ancestry
- Lithuanian 1%
- Foreign-born
- 15% · Canada
- Languages at home
- 61% English-only · Spanish 39%
Political lean MEDSL · Harris
- 2024 margin
- Lean D (+5.5) · D 52.0% · R 46.4% · Other 1.6%
- 2008→2024 swing
- +3.9pp toward D · 2008: 1.6pp · 2024: 5.5pp
- All cycles
- 2024: D+5.5 2020: D+13.3 2016: D+12.4 2012: D+0.1 2008: D+1.6
Not yet ingested
- Civics
- —
Market trends
- HPI YoY
- ▲ 3.89%
- Current HPI
- 267.5995
- Rent YoY
- ▲ 3.08%
- Metro
- Houston-The Woodlands-Sugar Land, TX
- State GDP YoY
- ▲ 3.95%
- F500 in state
- 110
Industry mix (Fortune 500 HQ in TX)
| Industry | F500 HQs | Revenue |
|---|---|---|
| Energy | 16 | $1,198B |
|
||
| Technology | 5 | $198B |
|
||
| Engineering / Construction | 4 | $72B |
|
||
| Energy Services | 3 | $60B |
|
||
| Utilities | 3 | $41B |
|
||
| Healthcare | 2 | $330B |
|
||
Price history
+291.9% since first listed13 events — show timeline
- 2026-06-14 Listed $489,900 HARMLS
- 2023-04-06 Sold (Public Records) — Public Records
- 2022-12-31 Listing Removed — HARMLS
- 2022-07-05 Price Changed $430,000 HARMLS
- 2022-06-15 Listed $465,000 HARMLS
- 2022-02-01 Sold (Public Records) — Public Records
- 2018-10-29 Sold (Public Records) — Public Records
- 2018-10-26 Sold (MLS) — HARMLS
- 2018-10-15 Pending — HARMLS
- 2018-09-18 Price Changed $119,000 HARMLS
- 2018-07-28 Listed $125,000 HARMLS
- 2017-06-16 Sold (Public Records) — Public Records
- 2000-03-27 Sold (Public Records) — Public Records
Property tax history
+10.4%/yrLatest (2025): $5,357 · +21.9% YoY. Source: county tax records.
Cash-flow waterfall
monthlySold comps — $/sqft
last 12 mo · ≤1 miLoading sold comps…