556 Greenway Dr · Saginaw, TX
Flood risk 1/10 · Minimal
- FEMA flood zone
- X (unshaded)
- Chance of flooding over 30 yrs
- 0.0%
- Est. flood insurance / yr
- $507 – $1,088
Fire risk 4/10 · Minor
- Est. fire insurance / yr
- $1,222 – $2,270
Heat risk 7/10 · Major
- Hot days now (above 109°F)
- 7 days/yr
- Hot days in 30 yrs
- 24 days/yr
Wind risk 4/10 · Minor
- Chance of severe wind over 30 yrs
- 18.0%
Air-quality risk 2/10 · Minimal
- Unhealthy air days now
- 1 days/yr
- Unhealthy air days in 30 yrs
- 2 days/yr
Risk factors via First Street. Map © Google.
Why this score? — see what drove the C- grade
The composite is a weighted blend of 9 inputs, each scored 0–100. Each bar is that input's sub-score; the figure is the points it added to the 100-point composite (weight × sub-score).
- ARV discount +15.0/15.0
- Cash flow +14.0/30.0
- 1% rule +5.0/10.0
- DSCR +4.3/10.0
- Livability +3.8/5.0
- Schools +3.5/10.0
- Rent growth +2.9/5.0
- Condition / age +2.5/5.0
- Appreciation +0.0/10.0
$225,000
🖨 Deal sheet (PDF) 📄 Offer letter ✓ Due diligence
Listing remarks MLS
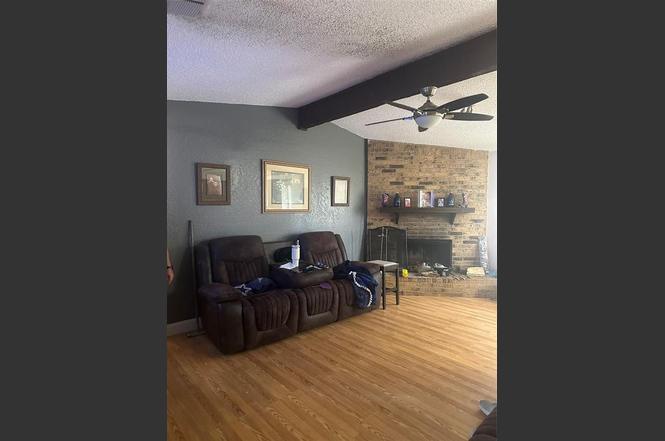
Here's a great opportunity! Make cosmetic repairs to match your personal taste. Living room with pretty brick wood-burning fireplace, kitchen features good wood cabinets and a convenient pantry, walk-in closet in master, master located in back of house for privacy, large backyard, major appliances included, convenient location close to schools and stores.
Key facts
- Detached shed
- 7,275 sq ft lot
- 2 garage spots
Tags
Property features AI
Finance
- Other: Property type: Residential single family; Subdivision: Saginaw North Add
- HOA & community: No homeowners association
Exterior
- Parking: Attached 2-car garage; Garage faces front; Covered parking for 2 vehicles; No carport spaces
- Security: Smoke detector(s)
- Utilities: City water; City sewer; Sidewalk
- Home design: Single family residence; One level; Residential property in a subdivision
- Construction: Brick construction; Composition roof; Slab foundation; Built in 1982
- Exterior features: Gutters; Storage; Front porch; Patio; Wood fenced backyard; Fenced yard
Interior
- Kitchen: Dishwasher; Disposal; Electric range; Microwave; Built-in cabinets; Corian/Corian-type countertops in primary bath (countertops noted)
- Bedrooms: Primary bedroom with walk-in closet; Two additional bedrooms
- Bathrooms: Two full bathrooms; Primary ensuite bathroom with built-in cabinets and Corian-type countertop
- Heating & cooling: Central heating (electric); Central electric air conditioning
- Interior features: Cable TV available; Walk-in closet(s); Fireplace in living room; Built-in cabinets; Separate utility room
- Laundry & utility: Full-size washer/dryer area; Washer hookup; Utility room / separate utility room
Neighborhood map
What this means for you Summary
Snapshot
- This is a 3-bed/2.0-bath single-family listed at $225k.
Deal economics
- At list price, monthly cash flow is $30 ($362/yr) — positive.
- The deal already cash-flows at list — no discount required.
- To meet the 1% rule (rent ≥ 1% of price), the offer needs to be $224k (0.4% below list).
- Recommended offer: $224k (0.4% below list) — sets the bar for 1% rule.
- Cap rate 6.5% vs local median 4.2% in Saginaw — top-decile yield for the area; either an underpriced asset or a hidden risk that comps aren't pricing in. Stress-test before assuming the spread holds.
Location & tenants
- Location reads 76/100 on livability (#112 in TX, #3,623 nationally) — a middle-class / working-renter tenant base. Strengths: employment A+, cost of living A+, housing A+; Watch: amenities F, commute F.
- Eagle Mt-Saginaw ISD (urban): math 35% / reading 42% proficiency, ranked #361 of 826 in TX (top 44%) — families likely to look elsewhere, expect single-tenant / working-renter base with shorter leases.
- Zoned schools: Bryson El (math 23% / reading 27%, grade F, #3,013 of 4,322 statewide, top 70%, 547 students, 63% FRL); Wayside Middle (math 42% / reading 42%, grade D-, #572 of 1,662 statewide, top 36%, 1,077 students, 39% FRL); Boswell H S (math 49% / reading 62%, grade C, #364 of 1,632 statewide, top 23%, 2,547 students, 37% FRL).
- Market conditions: Rents rising (+1.5%/yr); 1074 active listings in the ZIP; 40 comparable units currently listed for rent nearby; rentals at typical pace (median 27d on market — plan ~3-4 weeks tenant-placement turnaround); solid renter incomes; 18,938 units permitted in Tarrant County in 2024 (8,336 in 5+ unit buildings).
Forward outlook
- Local home prices are declining (-3.0%/yr); year-one equity from $2k of loan paydown is wiped out by about $7k of value loss. Plan a longer hold.
- Tarrant County population projected at +41% by 2050 — long-run rental-demand tailwind backs the buy-and-hold thesis.
Negotiation context
- Only 5 days on market — expect competitive offers; lowballing is unlikely to land.
- 2 sale attempts since 16y ago with the ask held roughly flat each time — persistent listings suggest the price (not the market) is what's stuck; bring a comps-based counter.
Risks & watch-outs
- Climate carrying-cost: extreme-heat days projected 7→24/yr by 2055 (HVAC capex compounding) — expect insurance premiums to compound above CPI over the hold.
Questions for the listing agent
- Is there a deadline driving the sale (1031 exchange, divorce, estate, relocation)? That informs how much negotiation room exists.
- Schools are D-rated, which usually means shorter tenancies and higher turnover. Who's the typical renter profile here, and what's been the actual vacancy rate?
- What's the average days-on-market for RENTAL listings here right now (not sales)? A rising rental-DOM trend means longer vacancies and softer asking-rent achievability than the comps imply.
- What's the recent tenant-quality profile in this submarket — average credit score on applications, eviction rate, late-payment / NSF rate, and stable-employment percentage? A property-management company in the area should have these aggregated.
- How much new for-sale + rental construction is in the pipeline within 1–3 miles? Heavy new supply typically softens prices + rents 12–24 months out; constrained supply supports both.
Investment metrics
- 1% rule
- 1.00% ✗
- Cap rate
- 6.45%
- Cash-on-cash
- 0.58%
- DSCR
- 1.03
- GRM
- 8.4
CMA / ARV
- ARV (on-the-fly)
- $275,184
- Comps found
- 12
Show comp detail 12 sales within ~0.75 mi
| Address | Dist | Beds/Ba | Sqft | Sold | Price | $/sf | Match |
|---|---|---|---|---|---|---|---|
| 525 Cole Ave | 0.11mi | 3/2.0 | 1,489 (-9%) | 2mo | $249,900 | $168 | 78 |
| 524 Cole Ave | 0.09mi | 3/2.0 | 1,451 (-11%) | 3mo | $245,000 | $169 | 74 |
| 501 Fox Dr | 0.19mi | 4/3.0 (+1) | 1,745 (+6%) | 2mo | $279,900 | $160 | 70 |
| 1133 Park Center Ct | 0.30mi | 3/2.0 | 1,782 (+9%) | 3mo | $260,500 | $146 | 69 |
| 1300 N Creek Dr | 0.16mi | 3/2.0 | 1,414 (-14%) | 2mo | $249,000 | $176 | 68 |
| 512 Meadow St | 0.33mi | 4/2.0 (+1) | 1,752 (+7%) | 2mo | $274,900 | $157 | 66 |
| 824 Bridle Trl | 0.68mi | 4/2.0 (+1) | 1,660 (+1%) | 2mo | $289,000 | $174 | 59 |
| 400 Candlestick Trl | 0.67mi | 3/2.0 | 1,538 (-6%) | 2mo | $250,000 | $163 | 57 |
| 8220 Buck Mountain Pass | 0.62mi | 4/2.0 (+1) | 1,724 (+5%) | 1mo | $279,900 | $162 | 56 |
| 4553 High Cotton Trl | 0.69mi | 3/2.0 | 1,535 (-6%) | 1mo | $265,000 | $173 | 56 |
| 8805 Highland Orchard Dr | 0.64mi | 3/2.0 | 1,426 (-13%) | 0mo | $240,000 | $168 | 49 |
| 632 Crestview Ct | 0.73mi | 3/2.0 | 1,800 (+10%) | 1mo | $318,000 | $177 | 48 |
Match score weights: distance 35% · size 25% · config 20% · recency 20%. Top-matched comps best support the ARV.
Projected returns pro-forma
-3.0% appreciation · 1.51% rent growth · sell at horizon
- IRR
- -17.2%
- Equity multiple
- 0.40×
- Total profit
- $-37,700
- Equity at exit
- $33,548
- IRR
- -12.4%
- Equity multiple
- 0.32×
- Total profit
- $-42,935
- Equity at exit
- $19,454
Cash invested: $63,000 (down + closing). Projections, not guarantees.
Landlord ↔ Tenant lean methodology
- Overall (STATE)
- 87 Strongly Landlord-Friendly
- State Texas
- 87 Strongly Landlord-Friendly · R+5
- County
- — inherits STATE
- City
- — inherits STATE
ZIP-level market 76179
- Rents YoY
- 1.5%
- Active inventory
- 1074
- Price-to-rent
- 8.4×
Monthly cashflow live
- Estimated rent
- $2,241 high interval (Pro) →
- Mortgage (P&I)
- −$1,180
- Tax from tax record
- −$466 /mo · $5,597/yr
- Insurance
- −$94
- HOA
- −$0
- Vacancy / Maint / Mgmt
- −$471
- Net cashflow
- $30
Break-even live
Sensitivity live
| Price | -10% $158 | -5% $94 | +0% $30 | +5% $-33 | +10% $-97 |
|---|---|---|---|---|---|
| Rent | -10% $-147 | -5% $-58 | +0% $30 | +5% $119 | +10% $207 |
| Rate | -1.0pp $144 | -0.5pp $87 | base $30 | +0.5pp $-28 | +1.0pp $-87 |
UW: 25.0% down · 7.5% · 30yr · 1.5% tax · 5.0% vac · 8.0% maint · 8.0% mgmt
Financing live
Cash to close
- Down payment
- $56,250
- Closing costs
- $6,750
- Reserves months
- —
- Total cash needed
- —
Loan-product check · same deal, 3 products live
Conventional
25% down · 7.5% · 30yr
- Down + closing
- —
- Monthly P&I
- —
- Monthly cashflow
- —
- DSCR
- —
- Eligible?
- —
Personal DTI + credit; lowest rate.
DSCR
20% down · 8.5% · 30yr
- Down + closing
- —
- Monthly P&I
- —
- Monthly cashflow
- —
- DSCR
- —
- Eligible?
- —
No personal income docs; deal must DSCR.
Hard money
10% down · 12.0% · 12mo
- Down + closing
- —
- Monthly P&I
- —
- Monthly cashflow
- —
- DSCR
- —
- Eligible?
- —
Short-term bridge; refi at stabilization.
Rent comps 40 comps
| Address | Beds | Baths | Sqft | Rent | $/sqft | DOM | Units | Dist |
|---|---|---|---|---|---|---|---|---|
| 544 Fox Dr Saginaw, TX | 3.0 | 2.0 | 1320 | $1,845 | $1.40 | 0d | 1 | 0.10mi |
| 425 Park Center Blvd Saginaw, TX | 3.0 | 2.0 | 1752 | $2,045 | $1.17 | 7d | 1 | 0.32mi |
| 701 Saginaw Square Blvd Unit 9128 Saginaw, TX | 2.0 | 2.0 | 1150 | $1,599 | $1.39 | 26d | 1 | 0.45mi |
| 701 Saginaw Square Blvd Fort Worth, TX | 2.0 | 2.0 | 1140 | $1,629 | $1.43 | 6d | 1 | 0.45mi |
| 701 Saginaw Square Blvd Unit 222 Saginaw, TX | 2.0 | 2.0 | 1139 | $1,419 | $1.25 | 26d | 1 | 0.45mi |
| 4536 Skipador Dr Fort Worth, TX | 3.0 | 2.0 | 1236 | $2,000 | $1.62 | 5d | 1 | 0.45mi |
| 725 Gray Wash Dr Unit Labs Fort Worth, TX | 3.0 | 2.0 | 1888 | $2,100 | $1.11 | 26d | 1 | 0.48mi |
| 751 N Saginaw Blvd Unit 2102 Saginaw, TX | 2.0 | 2.0 | 1139 | $1,435 | $1.26 | 14d | 1 | 0.49mi |
| 8408 Buck Mountain Pass Fort Worth, TX | 4.0 | 2.5 | 2131 | $2,375 | $1.11 | 26d | 1 | 0.50mi |
| 8660 Boswell Meadows Dr Fort Worth, TX | 3.0 | 2.0 | 1298 | $1,845 | $1.42 | 3d | 1 | 0.51mi |
| 948 Fenway Ln Saginaw, TX | 3.0 | 2.0 | 1563 | $2,025 | $1.30 | 26d | 1 | 0.53mi |
| 8320 Buck Mountain Pass Fort Worth, TX | 3.0 | 2.0 | 1316 | $1,999 | $1.52 | 0d | 1 | 0.53mi |
| 1451 Beltmill Pkwy Fort Worth, TX | 2.0 | 1.0–2.0 | 865 | $1,831 | $2.12 | 0d | 19 | 0.56mi |
| 8348 Hawkview Dr Fort Worth, TX | 4.0 | 2.5 | 2121 | $3,000 | $1.41 | 14d | 1 | 0.60mi |
| 912 Fenway Ln Saginaw, TX | 3.0 | 2.0 | 1627 | $2,000 | $1.23 | 19d | 1 | 0.61mi |
| 912 Fenway Ln Saginaw, TX | 3.0 | 2.0 | 1627 | $2,000 | $1.23 | 26d | 1 | 0.61mi |
| 136 Cranz Farm Dr Fort Worth, TX | 4.0 | 2.5 | 1940 | $2,600 | $1.34 | 26d | 1 | 0.62mi |
| 8204 Buck Mountain Pass Fort Worth, TX | 3.0 | 2.0 | 1638 | $2,100 | $1.28 | 4d | 1 | 0.63mi |
| 140 Cranz Farm Dr Fort Worth, TX | 4.0 | 2.5 | 2013 | $2,700 | $1.34 | 26d | 1 | 0.63mi |
| 152 Cranz Farm Dr Fort Worth, TX | 4.0 | 2.5 | 1940 | $2,600 | $1.34 | 26d | 1 | 0.64mi |
| 8205 Buck Mountain Pass Fort Worth, TX | 3.0 | 2.0 | 1316 | $1,995 | $1.52 | 14d | 1 | 0.64mi |
| 4749 Swan Neck Dr Fort Worth, TX | 4.0 | 2.0 | 1802 | $2,200 | $1.22 | 0d | 1 | 0.65mi |
| 8453 Shallow Creek Dr Fort Worth, TX | 3.0 | 3.0 | 1947 | $2,195 | $1.13 | 26d | 1 | 0.66mi |
| 8453 Shallow Creek Dr Fort Worth, TX | 3.0 | 2.5 | 1947 | $2,195 | $1.13 | 9d | 1 | 0.66mi |
| 1505 Sutter Mill Rd Fort Worth, TX | 4.0 | 2.5 | 2013 | $2,700 | $1.34 | 26d | 1 | 0.66mi |
| 8633 Star Thistle Dr Fort Worth, TX | 3.0 | 2.0 | 1777 | $2,000 | $1.13 | 18d | 1 | 0.68mi |
| 219 Cranz Farm Dr Fort Worth, TX | 4.0 | 2.5 | 2013 | $2,700 | $1.34 | 26d | 1 | 0.71mi |
| 225 Sutter Mill Rd Fort Worth, TX | 4.0 | 2.5 | 1940 | $2,600 | $1.34 | 26d | 1 | 0.72mi |
| 4817 Cedar Springs Dr Fort Worth, TX | 3.0 | 2.0 | 1388 | $1,809 | $1.30 | 18d | 1 | 0.72mi |
| 8916 Highland Orchard Dr Fort Worth, TX | 3.0 | 2.5 | 1776 | $2,135 | $1.20 | 0d | 1 | 0.73mi |
| 228 Sutter Mill Rd Fort Worth, TX | 4.0 | 2.5 | 2013 | $2,700 | $1.34 | 26d | 1 | 0.74mi |
| 232 Sutter Mill Rd Fort Worth, TX | 4.0 | 2.5 | 1940 | $2,600 | $1.34 | 26d | 1 | 0.74mi |
| 229 Cranz Farm Dr Fort Worth, TX | 4.0 | 2.5 | 1940 | $2,600 | $1.34 | 26d | 1 | 0.74mi |
| 1421 Twin Forks Dr Fort Worth, TX | 3.0–4.0 | 2.0–2.5 | 1790 | $2,395 | $1.34 | 3d | 1 | 0.74mi |
| 236 Sutter Mill Rd Fort Worth, TX | 3.0 | 2.0 | 1567 | $2,395 | $1.53 | 26d | 1 | 0.75mi |
| 4705 Harlequin Dr Fort Worth, TX | 4.0 | 2.0 | 1721 | $2,300 | $1.34 | 26d | 1 | 0.75mi |
| 235 Cranz Farm Dr Fort Worth, TX | 4.0 | 2.5 | 2013 | $2,700 | $1.34 | 26d | 1 | 0.76mi |
| 244 Sutter Mill Rd Fort Worth, TX | 4.0 | 2.5 | 2013 | $2,700 | $1.34 | 26d | 1 | 0.76mi |
| 248 Sutter Mill Rd Fort Worth, TX | 4.0 | 2.5 | 1940 | $2,600 | $1.34 | 26d | 1 | 0.77mi |
| 261 Sutter Mill Rd Fort Worth, TX | 4.0 | 2.5 | 1940 | $2,600 | $1.34 | 26d | 1 | 0.77mi |
Listing history 4 events
-
2026-06-21days on market $225,000 Active 5 DOM
-
2026-06-18days on market $225,000 Active 2 DOM
-
2026-06-17remarks 687-char remark
-
2026-06-17$225,000 Active 1 DOM
ⓘ Source: listings_history table (triggers on properties + properties_extension) + one-shot
backfill from property_details.listing_events for pre-trigger history.
Tax reassessment forecast TX · Resets to sale price
- Current annual tax
- $5,597 · $466/mo
- Projected year-2 tax
- $5,597 · $466/mo
- Expected delta
- $0/yr ($0/mo · 0.0%)
ⓘ Screening estimate from a state-policy table — verify with the county assessor before closing.
Climate risk First Street
- Flood 1/10 Low FEMA zone X (unshaded) · 0% chance over 30 yrs
- Wildfire 4/10 Moderate
- Heat 7/10 Severe 7 d/yr ≥109°F today · 24 d/yr by 30 yrs out
- Wind 4/10 Moderate 18% chance of damaging wind over 30 yrs
- Air quality 2/10 Low 1 unhealthy d/yr today · 2 by 30 yrs out
Nearby sold comps map
Loading sold comps map…
Walkable amenities ~0.75 mi
Loading nearby amenities…
Taxation est. · year 1
- Rental income
- $26,890
- − Mortgage interest
- −$12,603
- − Property taxes
- −$5,597
- − Insurance
- −$1,125
- − Repairs & maintenance
- −$2,151
- − Management
- −$2,151
- − Depreciation
- −$6,545
- Taxable loss
- −$3,283
- Est. tax savings @ 24.0%
- +$788
- After-tax cash flow
- $1,150/yr
For passive investors: Depreciation is non-cash, so a rental often shows a tax loss while cash-flowing — sheltering income. Rental losses are passive: they offset passive income freely, and up to $25,000/yr can offset ordinary (W-2) income if you actively participate and your MAGI is under $100k (phasing out to $0 by $150k); unused losses carry forward. On sale, claimed depreciation is recaptured at up to 25%, and gains may owe capital-gains tax (a 1031 exchange can defer both). Figures are a year-1 estimate at your 24.0% rate — not tax advice; consult a CPA.
Schools (NCES district)
- District
- Eagle Mt-Saginaw ISD
- NCES district ID
- 4817700
- Math proficiency
- 35% ▼ -16.00%
- Reading proficiency
- 42% ▼ -9.00%
- Median HH income
- $72,781
- Composite
- 35.41/100
- National rank
- #4945
- State rank
- #361 of 826 in TX
Livability — Saginaw
- Score
- 76/100
- State rank
- #112
- US rank
- #3623
Category grades
Schools grade is shown separately in the Schools card above.
Census & demographics
- Census place
- Saginaw, TX
- County
- Tarrant County · 2,033,669 people
- City population
- 56,322
- Metro
- Dallas-Fort Worth-Arlington, TX
- Population (ZIP)
- 80,090
- Household income
- $107,428
- Rent vs Own
- Severe rent burden
- 1494.0
Population outlook (Tarrant County) Hauer SSP2
- Today (2025)
- 2,380,417 people
- By 2030
- 2,578,900 · +8.3%
- By 2040
- 2,974,995 · +25.0%
- By 2050
- 3,350,489 · +40.8%
- By 2075
- 4,216,909 · +77.2%
- By 2100
- 4,741,527 · +99.2%
Race, ethnicity, and origin ACS 2023
- Neighborhood character
- Diverse neighborhood (Simpson 0.63)
- Race & ethnicity
- White 53% Hispanic / Latino 28% Two or more races 14% Black 12% Asian 4%
- Hispanic origin (detail)
- Mexican 22% Puerto Rican 2%
- Common ancestry
- Slovak 2% Lithuanian 2% Italian 1%
- Foreign-born
- 8% · Canada, Jamaica
- Languages at home
- 81% English-only · Spanish 15% Other Asian/Pacific 2% Other Indo-European 1%
Political lean MEDSL · Tarrant
- 2024 margin
- Lean R (+5.1) · D 46.7% · R 51.9% · Other 1.4%
- 2008→2024 swing
- +6.6pp toward D · 2008: -11.7pp · 2024: -5.1pp
- All cycles
- 2024: R+5.1 2020: D+0.2 2016: R+8.7 2012: R+15.7 2008: R+11.7
Not yet ingested
- Civics
- —
Market trends
- HPI YoY
- ▼ -137.12%
- Current HPI
- 237.6676
- Rent YoY
- ▲ 1.51%
- Metro
- Dallas-Fort Worth-Arlington, TX
- State GDP YoY
- ▲ 3.95%
- F500 in state
- 110
Industry mix (Fortune 500 HQ in TX)
| Industry | F500 HQs | Revenue |
|---|---|---|
| Energy | 16 | $1,198B |
|
||
| Technology | 5 | $198B |
|
||
| Engineering / Construction | 4 | $72B |
|
||
| Energy Services | 3 | $60B |
|
||
| Utilities | 3 | $41B |
|
||
| Healthcare | 2 | $330B |
|
||
Price history
+181.6% since first listed7 events — show timeline
- 2026-06-16 Listed $225,000 NTREIS
- 2010-05-06 Sold (Public Records) — Public Records
- 2010-04-26 Sold (MLS) — NTREIS
- 2010-03-30 Listing Removed — NTREIS
- 2010-03-15 Listed $79,900 NTREIS
- 1997-06-16 Sold (Public Records) — Public Records
- 1996-01-04 Sold (Public Records) — Public Records
Property tax history
+6.1%/yrLatest (2025): $5,597 · +10.8% YoY. Source: county tax records.
Cash-flow waterfall
monthlySold comps — $/sqft
last 12 mo · ≤1 miLoading sold comps…