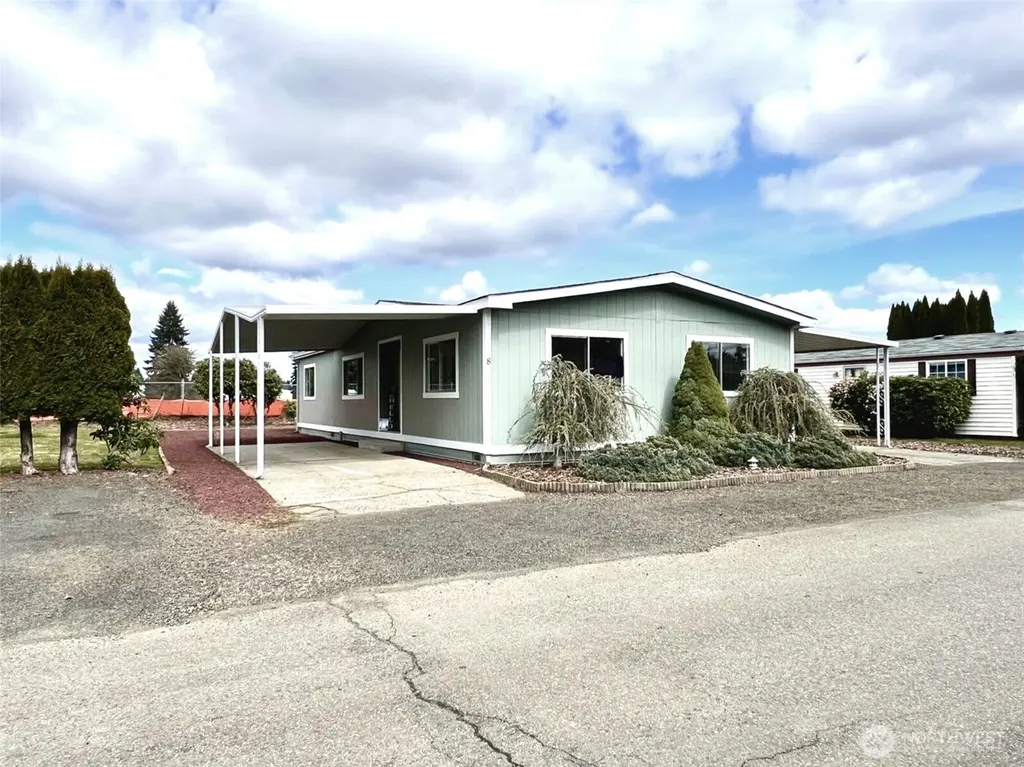
9900 Blomberg St SW #8 · Tumwater, WA
Flood risk 1/10 · Minimal
- FEMA flood zone
- X (unshaded)
- Chance of flooding over 30 yrs
- 0.0%
- Est. flood insurance / yr
- $507 – $1,088
Fire risk 3/10 · Minor
- Est. fire insurance / yr
- $604 – $1,122
Heat risk 3/10 · Minor
- Hot days now (above 88°F)
- 7 days/yr
- Hot days in 30 yrs
- 14 days/yr
Wind risk 1/10 · Minimal
- Chance of severe wind over 30 yrs
- —
Air-quality risk 6/10 · Moderate
- Unhealthy air days now
- 7 days/yr
- Unhealthy air days in 30 yrs
- 7 days/yr
Risk factors via First Street. Map © Google.
Why this score? — see what drove the B grade
The composite is a weighted blend of 9 inputs, each scored 0–100. Each bar is that input's sub-score; the figure is the points it added to the 100-point composite (weight × sub-score).
- Cash flow +30.0/30.0
- 1% rule +10.0/10.0
- DSCR +10.0/10.0
- Schools +5.6/10.0
- ARV discount +5.1/15.0
- Livability +4.2/5.0
- Rent growth +3.1/5.0
- Condition / age +2.5/5.0
- Appreciation +0.0/10.0
$100,000
🖨 Deal sheet (PDF) 📄 Offer letter ✓ Due diligence
Listing remarks
Your First Home Starts Here – Updated 2 Bed with Bonus Storage Welcome to this move-in ready 2-bedroom, 2-bath manufactured home located in a well-maintained community park. Offering a comfortable and functional layout, this home features upgraded appliances, abundant natural light, and a warm, inviting feel throughout. Step inside to a bright and airy living space filled with natural light from windows. The kitchen comes equipped with upgraded appliances, providing both style and convenience from day one. The layout flows easily, with well-sized bedrooms and a full bathroom plus 3/4 bath in master bedroom that offer flexibility for everyday living. A standout feature is the large de
Key facts
- 3 parking spots
- Built 1981
- Listed 16 days
Tags
Neighborhood map
What this means for you Summary
Snapshot
- This is a 2-bed/2.0-bath manufactured listed at $100k.
Deal economics
- At list price, monthly cash flow is $845 ($10k/yr) — positive.
- The deal already cash-flows at list — no discount required.
- Meets the 1% rule at list price ($2k rent vs $100k).
- Recommended offer: $98k (1.5% below list) — sets the bar for market timing.
- Cap rate 16.4% vs local median 2.7% in Tumwater — top-decile yield for the area; either an underpriced asset or a hidden risk that comps aren't pricing in. Stress-test before assuming the spread holds.
Location & tenants
- Location reads 84/100 on livability (#39 in WA, #700 nationally) — a professional / high-income tenant draw. Strengths: commute A+, housing A+, health & safety A+; Watch: amenities D, cost of living D-.
- Tumwater School District (urban): math 57% / reading 69% proficiency, ranked #37 of 291 in WA (top 13%) — acceptable for families but not a draw, mixed tenant base, ~2y average lease.
- Zoned schools: Michael T Simmons Elementary (479 students, 40% FRL); Tumwater Middle School (616 students, 32% FRL); A G West Black Hills High School (833 students, 32% FRL).
- Market conditions: Rents rising (+2.3%/yr); 236 active listings in the ZIP; 1 comparable units currently listed for rent nearby; solid renter incomes; 1,222 units permitted in Thurston County in 2024 (508 in 5+ unit buildings).
Forward outlook
- Local home prices are declining (-3.0%/yr); year-one equity from $691 of loan paydown is wiped out by about $3k of value loss. Plan a longer hold.
- Thurston County population projected at +27% by 2050 — long-run rental-demand tailwind backs the buy-and-hold thesis.
- At projected returns (-3.0% appreciation + 2.3% rent growth), your $28k cash investment doubles in ~4 years — after that, you're playing with house money.
Negotiation context
- It's been on market 16 days — a 2% lower offer ($98k) is reasonable based on typical stale-listing flexibility.
- 4 sale attempts since 24y ago with the ask held roughly flat each time — persistent listings suggest the price (not the market) is what's stuck; bring a comps-based counter.
- Current owner paid $16k; list at $100k implies a 525% gain — meaningful room to come down on a strong offer.
Questions for the listing agent
- Is there a deadline driving the sale (1031 exchange, divorce, estate, relocation)? That informs how much negotiation room exists.
- Schools are A-rated — typically a magnet for longer-tenancy family renters. What's the average tenant stay here, and is there a school-zone premium baked into asking?
- What's the average days-on-market for RENTAL listings here right now (not sales)? A rising rental-DOM trend means longer vacancies and softer asking-rent achievability than the comps imply.
- What's the recent tenant-quality profile in this submarket — average credit score on applications, eviction rate, late-payment / NSF rate, and stable-employment percentage? A property-management company in the area should have these aggregated.
- How much new for-sale + rental construction is in the pipeline within 1–3 miles? Heavy new supply typically softens prices + rents 12–24 months out; constrained supply supports both.
Investment metrics
- 1% rule
- 1.88% ✓
- Cap rate
- 16.43%
- Cash-on-cash
- 36.21%
- DSCR
- 2.61
- GRM
- 4.4
CMA / ARV
- ARV (on-the-fly)
- $94,848
- Comps found
- 2
Show comp detail 2 sales within ~0.75 mi
| Address | Dist | Beds/Ba | Sqft | Sold | Price | $/sf | Match |
|---|---|---|---|---|---|---|---|
| 9900 Blomberg St SW #8 | 0.00mi | 2/2.0 | 1,248 (0%) | 1mo | $95,000 | $76 | 99 |
| 9900 Blomberg St SW #15 | 0.04mi | 3/2.0 (+1) | 1,152 (-8%) | 21mo | $60,000 | $52 | 63 |
Match score weights: distance 35% · size 25% · config 20% · recency 20%. Top-matched comps best support the ARV.
Projected returns pro-forma
-3.0% appreciation · 2.26% rent growth · sell at horizon
- IRR
- 31.1%
- Equity multiple
- 2.29×
- Total profit
- $36,209
- Equity at exit
- $14,910
- IRR
- 37.9%
- Equity multiple
- 4.40×
- Total profit
- $95,187
- Equity at exit
- $8,646
Cash invested: $28,000 (down + closing). Projections, not guarantees.
Landlord ↔ Tenant lean methodology
- Overall (STATE)
- 28 Tenant-Leaning
- State Washington
- 28 Tenant-Leaning · D+8
- County
- — inherits STATE
- City
- — inherits STATE
ZIP-level market 98512
- Rents YoY
- 2.3%
- Active inventory
- 236
- Price-to-rent
- 4.4×
Monthly cashflow live
- Estimated rent
- $1,876 medium interval (Pro) →
- Mortgage (P&I)
- −$524
- Tax from tax record
- −$71 /mo · $855/yr
- Insurance
- −$42
- HOA
- −$0
- Vacancy / Maint / Mgmt
- −$394
- Net cashflow
- $845
Break-even live
Sensitivity live
| Price | -10% $901 | -5% $873 | +0% $845 | +5% $816 | +10% $788 |
|---|---|---|---|---|---|
| Rent | -10% $697 | -5% $771 | +0% $845 | +5% $919 | +10% $993 |
| Rate | -1.0pp $895 | -0.5pp $870 | base $845 | +0.5pp $819 | +1.0pp $793 |
UW: 25.0% down · 7.5% · 30yr · 1.5% tax · 5.0% vac · 8.0% maint · 8.0% mgmt
Financing live
Cash to close
- Down payment
- $25,000
- Closing costs
- $3,000
- Reserves months
- —
- Total cash needed
- —
Loan-product check · same deal, 3 products live
Conventional
25% down · 7.5% · 30yr
- Down + closing
- —
- Monthly P&I
- —
- Monthly cashflow
- —
- DSCR
- —
- Eligible?
- —
Personal DTI + credit; lowest rate.
DSCR
20% down · 8.5% · 30yr
- Down + closing
- —
- Monthly P&I
- —
- Monthly cashflow
- —
- DSCR
- —
- Eligible?
- —
No personal income docs; deal must DSCR.
Hard money
10% down · 12.0% · 12mo
- Down + closing
- —
- Monthly P&I
- —
- Monthly cashflow
- —
- DSCR
- —
- Eligible?
- —
Short-term bridge; refi at stabilization.
Rent comps 1 comps
| Address | Beds | Baths | Sqft | Rent | $/sqft | DOM | Units | Dist |
|---|---|---|---|---|---|---|---|---|
| 3900 93rd Ave SW Unit B Olympia, WA | 2.0 | 1.0 | 900 | $1,295 | $1.44 | 46d | 1 | 0.99mi |
Listing history 13 events
-
2026-04-19status Pending
-
2026-04-03$100,000 Active
-
2015-10-27soldstatus $16,000 Sold
-
2015-10-18historical Expired
-
2015-09-10price $16,000
-
2015-02-04price $18,000
-
2014-12-01price $19,500
-
2014-11-21price $22,000
-
2014-10-20$25,000 Active
-
2006-10-30soldstatus $40,000
-
2006-09-08$42,500
-
2003-03-26soldstatus $25,000
-
2002-06-17$26,500
ⓘ Source: listings_history table (triggers on properties + properties_extension) + one-shot
backfill from property_details.listing_events for pre-trigger history.
Tax reassessment forecast WA · Resets to sale price
- Current annual tax
- $855 · $71/mo
- Projected year-2 tax
- $980 · $82/mo
- Expected delta
- +$125/yr (+$10/mo · 14.6%)
ⓘ Screening estimate from a state-policy table — verify with the county assessor before closing.
Climate risk First Street
- Flood 1/10 Low FEMA zone X (unshaded) · 0% chance over 30 yrs
- Wildfire 3/10 Moderate
- Heat 3/10 Moderate 7 d/yr ≥88°F today · 14 d/yr by 30 yrs out
- Wind 1/10 Low
- Air quality 6/10 Major 7 unhealthy d/yr today · 7 by 30 yrs out
Nearby sold comps map
Loading sold comps map…
Walkable amenities ~0.75 mi
Loading nearby amenities…
Taxation est. · year 1
- Rental income
- $22,514
- − Mortgage interest
- −$5,602
- − Property taxes
- −$855
- − Insurance
- −$500
- − Repairs & maintenance
- −$1,801
- − Management
- −$1,801
- − Depreciation
- −$2,909
- Taxable income
- $9,045
- Est. tax owed @ 24.0%
- −$2,171
- After-tax cash flow
- $7,967/yr
For passive investors: Depreciation is non-cash, so a rental often shows a tax loss while cash-flowing — sheltering income. Rental losses are passive: they offset passive income freely, and up to $25,000/yr can offset ordinary (W-2) income if you actively participate and your MAGI is under $100k (phasing out to $0 by $150k); unused losses carry forward. On sale, claimed depreciation is recaptured at up to 25%, and gains may owe capital-gains tax (a 1031 exchange can defer both). Figures are a year-1 estimate at your 24.0% rate — not tax advice; consult a CPA.
Schools (NCES district)
- District
- Tumwater School District
- NCES district ID
- 5309100
- Math proficiency
- 57% ▬ 0.00%
- Reading proficiency
- 69% ▼ -1.00%
- Median HH income
- $64,209
- Composite
- 56.38/100
- National rank
- #2477
- State rank
- #37 of 291 in WA
Livability — Tumwater
- Score
- 84/100
- State rank
- #39
- US rank
- #700
Category grades
Schools grade is shown separately in the Schools card above.
Census & demographics
- County
- Thurston County · 269,345 people
- City population
- 46,937
- Metro
- Olympia-Lacey-Tumwater, WA
- Population (ZIP)
- 31,864
- Household income
- $101,530
- Rent vs Own
- Severe rent burden
- 784.0
Population outlook (Thurston County) Hauer SSP2
- Today (2025)
- 308,239 people
- By 2030
- 326,483 · +5.9%
- By 2040
- 359,890 · +16.8%
- By 2050
- 391,800 · +27.1%
- By 2075
- 468,024 · +51.8%
- By 2100
- 519,890 · +68.7%
Race, ethnicity, and origin ACS 2023
- Neighborhood character
- Predominantly White (72%)
- Race & ethnicity
- White 72% Two or more races 13% Hispanic / Latino 9% Asian 4% Black 3% Native American 1%
- Hispanic origin (detail)
- Mexican 5%
- Common ancestry
- Portuguese 4% Italian 4% Slovak 4%
- Foreign-born
- 6% · Canada, Vietnam, China
- Languages at home
- 92% English-only · Spanish 3% Vietnamese 1% German/W. Germanic 1%
Political lean MEDSL · Thurston
- 2024 margin
- Strong D (+20.4) · D 58.5% · R 38.1% · Other 3.5%
- 2008→2024 swing
- -1.3pp toward R · 2008: 21.7pp · 2024: 20.4pp
- All cycles
- 2024: D+20.4 2020: D+18.6 2016: D+15.4 2012: D+19.0 2008: D+21.7
Not yet ingested
- Civics
- —
Market trends
- HPI YoY
- ▼ -348.18%
- Current HPI
- 347.121
- Rent YoY
- ▲ 2.26%
- Metro
- Olympia-Lacey-Tumwater, WA
- State GDP YoY
- ▲ 4.65%
- F500 in state
- 22
Industry mix (Fortune 500 HQ in WA)
| Industry | F500 HQs | Revenue |
|---|---|---|
| Retail | 2 | $269B |
|
||
| Technology / Retail | 1 | $638B |
|
||
| Technology | 1 | $245B |
|
||
| Telecommunications | 1 | $38B |
|
||
| Food / Beverage | 1 | $36B |
|
||
| Automotive / Trucks | 1 | $34B |
|
||
Price history
+277.4% since first listed13 events — show timeline
- 2026-04-19 Pending — NWMLS as Distributed by MLS Grid
- 2026-04-03 Listed $100,000 NWMLS as Distributed by MLS Grid
- 2015-10-27 Sold (MLS) $16,000 NWMLS as Distributed by MLS Grid
- 2015-10-18 Delisted — NWMLS as Distributed by MLS Grid
- 2015-09-10 Price Changed $16,000 NWMLS as Distributed by MLS Grid
- 2015-02-04 Price Changed $18,000 NWMLS as Distributed by MLS Grid
- 2014-12-01 Price Changed $19,500 NWMLS as Distributed by MLS Grid
- 2014-11-21 Price Changed $22,000 NWMLS as Distributed by MLS Grid
- 2014-10-20 Listed $25,000 NWMLS as Distributed by MLS Grid
- 2006-10-30 Sold (MLS) $40,000 NWMLS as Distributed by MLS Grid
- 2006-09-08 Listed $42,500 NWMLS as Distributed by MLS Grid
- 2003-03-26 Sold (MLS) $25,000 NWMLS as Distributed by MLS Grid
- 2002-06-17 Listed $26,500 NWMLS as Distributed by MLS Grid
Property tax history
+6.0%/yrLatest (2026): $855 · +18.1% YoY. Source: county tax records.
Cash-flow waterfall
monthlySold comps — $/sqft
last 12 mo · ≤1 miLoading sold comps…