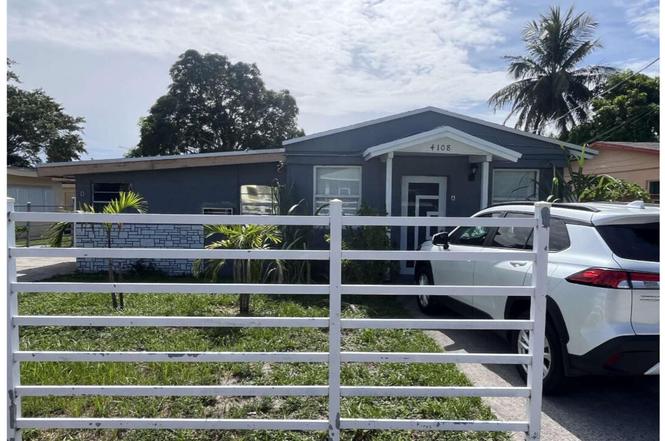
 Duplex
4108 Greenwood Ave · West Palm Beach, FL
Flood risk 1/10 · Minimal
- FEMA flood zone
- X (unshaded)
- Chance of flooding over 30 yrs
- 0.0%
- Est. flood insurance / yr
- $507 – $1,088
Fire risk 1/10 · Minimal
- Est. fire insurance / yr
- $947 – $1,759
Heat risk 10/10 · Severe
- Hot days now (above 105°F)
- 7 days/yr
- Hot days in 30 yrs
- 25 days/yr
Wind risk 10/10 · Severe
- Chance of severe wind over 30 yrs
- 99.0%
Air-quality risk 2/10 · Minimal
- Unhealthy air days now
- 1 days/yr
- Unhealthy air days in 30 yrs
- 1 days/yr
Risk factors via First Street. Map © Google.
Why this score? — see what drove the B grade
The composite is a weighted blend of 9 inputs, each scored 0–100. Each bar is that input's sub-score; the figure is the points it added to the 100-point composite (weight × sub-score).
- Cash flow +30.0/30.0
- 1% rule +10.0/10.0
- DSCR +10.0/10.0
- ARV discount +7.5/15.0
- Schools +4.3/10.0
- Livability +4.1/5.0
- Rent growth +3.3/5.0
- Condition / age +2.5/5.0
- Appreciation +0.0/10.0
$398,900
🖨 Deal sheet 📄 Offer letter ✓ Due diligence
Multi-family units
County records classify this as Multi-Family (2-4 Unit). Listing-text estimate: 2 units. confirmed
Listing remarks MLS
Welcome to this fantastic investment opportunity under normal market prices! This property boasts two separate units, each with their own electric meter, providing a great investment opportunity for investors. Currently, the property is rented out to long-term tenants at under market value, which means there is a significant opportunity for an increase in rental income. With the potential to revamp the space, this property provides a unique opportunity for those looking for properties with a high chance to increase their income. Don't miss out on this incredible investment opportunity. Call us today to schedule a viewing and take the first step towards having an investment.
Key facts
- Own electric meter
- Two separate units
- Built 1947
Tags
Property features AI
Finance
- Financial info: 2 total units; Gross income reported as $3,100; Net operating income reported as $37,200
- HOA & community: No association amenities
Exterior
- Utilities: Utilities: none listed; Tenants pay cable TV and electricity (multi-family)
- Home design: Duplex; Resale property
- Construction: Stucco construction; Composition roof; Building area reported as 4,953; Living area reported as 1,548
- Exterior features: Fenced yard; Not waterfront
Interior
- Flooring: Tile
- Bathrooms: 2 bathrooms total
- Heating & cooling: Electric heating; Other heating; Electric cooling; Wall/Window AC units
- Interior features: Tile flooring; 2 total bathrooms
Neighborhood map
What this means for you Summary
Snapshot
- This is a 2 × 2.0-bed/1.0-bath units multifamily listed at $399k.
Deal economics
- At list price, monthly cash flow is $3k ($35k/yr) — positive. Per door: $1k/mo.
- The deal already cash-flows at list — no discount required.
- Meets the 1% rule at list price ($7k rent vs $399k).
- Recommended offer: $351k (12.0% below list) — sets the bar for market timing.
- Cap rate 15.0% vs local median 3.8% in West Palm Beach — top-decile yield for the area; either an underpriced asset or a hidden risk that comps aren't pricing in. Stress-test before assuming the spread holds.
Location & tenants
- Location reads 82/100 on livability (#75 in FL, #1,255 nationally) — a professional / high-income tenant draw. Strengths: commute A+, housing A+, health & safety A+; Watch: employment C-, crime F.
- Palm Beach (suburban): math 46% / reading 53% proficiency, ranked #34 of 73 in FL (top 47%) — families likely to look elsewhere, expect single-tenant / working-renter base with shorter leases.
- Market conditions: Rents rising (+3.1%/yr); 305 active listings in the ZIP; 40 comparable units currently listed for rent nearby; rentals at typical pace (median 25d on market — plan ~3-4 weeks tenant-placement turnaround); 3,974 units permitted in Palm Beach County in 2024 (1,012 in 5+ unit buildings).
- At $7,230/mo this rent would consume 145% of the median local household income ($60k/yr) (locally 2157% of renters already pay >50% of income on rent) — very limited rent-growth headroom before tenants either downsize or default.
Forward outlook
- Local home prices are declining (-3.0%/yr); year-one equity from $3k of loan paydown is wiped out by about $12k of value loss. Plan a longer hold.
- Palm Beach County population projected at +30% by 2050 — long-run rental-demand tailwind backs the buy-and-hold thesis.
- At projected returns (-3.0% appreciation + 3.1% rent growth), your $112k cash investment doubles in ~4 years — after that, you're playing with house money.
Negotiation context
- It's been on market 301 days — a 12% lower offer ($351k) is reasonable based on typical stale-listing flexibility.
- 8 sale attempts since 24y ago; this cycle's ask has dropped $51k (11%) from the opening price — seller is motivated, your offer sets the floor, not the list.
- Current owner paid $339k; 18% above their basis — modest negotiation headroom, anchor on the comps not their cost.
Risks & watch-outs
- Watch-outs: built in 1947 — expect roof / HVAC / electrical / plumbing capex.
- Climate carrying-cost: severe wind risk, 99% chance of damaging wind over 30y; extreme-heat days projected 7→25/yr by 2055 (HVAC capex compounding) — expect insurance premiums to compound above CPI over the hold.
Questions for the listing agent
- It's been on market 301 days. Have you received any prior offers? Is the seller open to a 12% concession, seller financing, or rate buy-down credit?
- Can we see the unit-by-unit rent roll, current vacancy, and any below-market leases? What's the average tenancy length?
- What capital expenditures (roof, boiler, parking lot, exteriors) have been made in the last 5 years, and what's planned in the next 2?
- Built in 1947 — when were the roof, HVAC, electrical panel, plumbing, and water heater last replaced?
- Why hasn't it sold? Are there any deal-killer items the seller is aware of (foundation, flood, title, zoning, code violations)?
- Is there a deadline driving the sale (1031 exchange, divorce, estate, relocation)? That informs how much negotiation room exists.
- Crime grade is F in this area — have there been break-ins, vandalism, or insurance claims at this property in the last 3 years? What carrier currently insures it and at what premium?
- What's the average days-on-market for RENTAL listings here right now (not sales)? A rising rental-DOM trend means longer vacancies and softer asking-rent achievability than the comps imply.
- What's the recent tenant-quality profile in this submarket — average credit score on applications, eviction rate, late-payment / NSF rate, and stable-employment percentage? A property-management company in the area should have these aggregated.
- How much new apartment / multifamily construction is in the pipeline within 1–3 miles? Heavy new supply (>2% of stock underway) typically softens rents 12–24 months out; light construction supports rent growth.
Investment metrics
- 1% rule
- 1.81% ✓
- Cap rate
- 15.05%
- Cash-on-cash
- 31.26%
- DSCR
- 2.39
- GRM
- 4.6
CMA / ARV
No comps found within radius.
Projected returns pro-forma
-3.0% appreciation · 3.08% rent growth · sell at horizon
- IRR
- 26.2%
- Equity multiple
- 2.09×
- Total profit
- $121,421
- Equity at exit
- $59,477
- IRR
- 33.9%
- Equity multiple
- 4.11×
- Total profit
- $347,337
- Equity at exit
- $34,490
Cash invested: $111,692 (down + closing). Projections, not guarantees.
Landlord ↔ Tenant lean methodology
- Overall (STATE)
- 87 Strongly Landlord-Friendly
- State Florida
- 87 Strongly Landlord-Friendly · R+3
- County
- — inherits STATE
- City
- — inherits STATE
ZIP-level market 33407
- Rents YoY
- 3.1%
- Active inventory
- 305
- Price-to-rent
- 9.2×
Monthly cashflow live
- Estimated rent
- $7,230 high interval (Pro) →
- Mortgage (P&I)
- −$2,092
- Tax from tax record
- −$544 /mo · $6,523/yr
- Insurance
- −$166
- HOA
- −$0
- Vacancy / Maint / Mgmt
- −$1,518
- Net cashflow
- $2,910
Break-even live
2-unit breakdown (identical units grouped — click to expand)
| Units | Beds | Baths | Est. rent |
|---|---|---|---|
| 2× units | 2.0 | 1 | $7,230 |
| #1 | 2.0 | 1 | $3,615 |
| #2 | 2.0 | 1 | $3,615 |
| Total (2 units) | $7,230 | ||
UW: 25.0% down · 7.5% · 30yr · 1.5% tax · 5.0% vac · 8.0% maint · 8.0% mgmt
Financing live
Cash to close
- Down payment
- $99,725
- Closing costs
- $11,967
- Reserves months
- —
- Total cash needed
- —
Loan-product check · same deal, 3 products live
Conventional
25% down · 7.5% · 30yr
- Down + closing
- —
- Monthly P&I
- —
- Monthly cashflow
- —
- DSCR
- —
- Eligible?
- —
Personal DTI + credit; lowest rate.
DSCR
20% down · 8.5% · 30yr
- Down + closing
- —
- Monthly P&I
- —
- Monthly cashflow
- —
- DSCR
- —
- Eligible?
- —
No personal income docs; deal must DSCR.
Hard money
10% down · 12.0% · 12mo
- Down + closing
- —
- Monthly P&I
- —
- Monthly cashflow
- —
- DSCR
- —
- Eligible?
- —
Short-term bridge; refi at stabilization.
Rent comps 40 comps
| Address | Beds | Baths | Sqft | Rent | $/sqft | DOM | Units | Dist |
|---|---|---|---|---|---|---|---|---|
| 3808 Westview Ave West Palm Beach, FL | 4.0 | 3.0 | 1617 | $3,100 | $1.92 | 24d | 1 | 0.22mi |
| 701 37th St West Palm Beach, FL | 3.0 | 2.0 | 1426 | $3,600 | $2.52 | 24d | 1 | 0.26mi |
| 619 37th St West Palm Beach, FL | 3.0 | 2.0 | 1414 | $3,350 | $2.37 | 24d | 1 | 0.30mi |
| 636 35th St West Palm Beach, FL | 3.0 | 2.0 | 1133 | $3,500 | $3.09 | 24d | 1 | 0.40mi |
| 436 38th St West Palm Beach, FL | 4.0 | 3.0 | 1479 | $6,500 | $4.39 | 24d | 1 | 0.48mi |
| 401 42nd St West Palm Beach, FL | 3.0 | 1.0 | 1400 | $4,950 | $3.54 | 15d | 1 | 0.49mi |
| 401 42nd St West Palm Beach, FL | 3.0 | 1.0 | 1100 | $4,950 | $4.50 | 24d | 1 | 0.49mi |
| 4444 N Flagler Dr West Palm Beach, FL | 2.0 | 2.0 | 1300 | $4,579 | $3.52 | 24d | 1 | 0.56mi |
| 933 30th Ct West Palm Beach, FL | 3.0 | 1.5 | 1085 | $3,100 | $2.86 | 24d | 1 | 0.57mi |
| 406 35th St West Palm Beach, FL | 3.0 | 2.0 | 1835 | $8,000 | $4.36 | 24d | 1 | 0.60mi |
| 511 32nd St West Palm Beach, FL | 4.0 | 3.5 | 2052 | $18,500 | $9.02 | 5d | 1 | 0.62mi |
| 5101 Spruce Ave West Palm Beach, FL | 3.0 | 3.0 | 1151 | $3,100 | $2.69 | 24d | 1 | 0.63mi |
| 424 51st St Unit 426 West Palm Beach, FL | 3.0 | 2.0 | 1230 | $3,500 | $2.85 | 11d | 1 | 0.66mi |
| 517 31st St West Palm Beach, FL | 2.0 | 1.5 | 1406 | $3,150 | $2.24 | 24d | 1 | 0.67mi |
| 3410 Poinsettia Ave West Palm Beach, FL | 2.0 | 1.0 | 1257 | $3,350 | $2.67 | 12d | 1 | 0.69mi |
| 306 34th St West Palm Beach, FL | 2.0 | 1.0 | 1443 | $4,650 | $3.22 | 24d | 1 | 0.70mi |
| 5203 N Flagler Dr West Palm Beach, FL | 3.0 | 1.5 | 1458 | $6,000 | $4.12 | 24d | 1 | 0.72mi |
| 5301 N Flagler Dr West Palm Beach, FL | 4.0 | 3.0 | 1616 | $6,000 | $3.71 | 24d | 1 | 0.76mi |
| 5200 N Flagler Dr West Palm Beach, FL | 2.0 | 2.0 | 1233 | $3,375 | $2.74 | 24d | 2 | 0.77mi |
| 5200 N Flagler Dr #2004 West Palm Beach, FL | 2.0 | 2.0 | 1235 | $3,800 | $3.08 | 8d | 1 | 0.77mi |
| 419 30th St West Palm Beach, FL | 3.0 | 2.5 | 2104 | $7,700 | $3.66 | 24d | 1 | 0.77mi |
| 3415 N Flagler Dr West Palm Beach, FL | 2.0 | 2.0 | 1174 | $9,950 | $8.48 | 8d | 1 | 0.80mi |
| 517 55th St West Palm Beach, FL | 2.0 | 2.0 | 1238 | $4,550 | $3.68 | 24d | 1 | 0.82mi |
| 629 56th St West Palm Beach, FL | 4.0 | 2.0 | 1689 | $3,100 | $1.84 | 15d | 1 | 0.82mi |
| 510 56th St West Palm Beach, FL | 2.0 | 1.0 | 1152 | $3,800 | $3.30 | 22d | 1 | 0.84mi |
| 1563 40th St West Palm Beach, FL | 4.0 | 2.0 | 1680 | $3,600 | $2.14 | 4d | 1 | 0.85mi |
| 245 30th St West Palm Beach, FL | 2.0 | 2.0 | 1271 | $9,000 | $7.08 | 24d | 1 | 0.86mi |
| 216 32nd St West Palm Beach, FL | 3.0 | 3.0 | 1846 | $6,200 | $3.36 | 24d | 1 | 0.87mi |
| 202 32nd St West Palm Beach, FL | 3.0 | 2.0 | 1636 | $5,995 | $3.66 | 24d | 1 | 0.89mi |
| 5600 N Flagler Dr West Palm Beach, FL | 1.0–3.0 | 2.0 | 1192 | $6,000 | $5.03 | 21d | 8 | 0.92mi |
| 411 26th St West Palm Beach, FL | 3.0 | 3.5 | 1847 | $6,900 | $3.74 | 8d | 1 | 0.99mi |
| 411 26th St West Palm Beach, FL | 4.0 | 3.5 | 1847 | $6,900 | $3.74 | 24d | 1 | 0.99mi |
| 5820 N Flagler Dr West Palm Beach, FL | 2.0 | 2.0 | 2100 | $4,750 | $2.26 | 24d | 1 | 1.00mi |
| 2585 Spruce Ave West Palm Beach, FL | 1.0–2.0 | 1.0–2.0 | 841 | $3,225 | $3.83 | 1d | 122 | 1.04mi |
| 2800 N Flagler Dr #404 West Palm Beach, FL | 3.0 | 3.0 | 2063 | $7,200 | $3.49 | 24d | 1 | 1.10mi |
| 716 21st St West Palm Beach, FL | 4.0 | 2.0 | 1560 | $3,800 | $2.44 | 5d | 1 | 1.17mi |
| 716 21st St West Palm Beach, FL | 4.0 | 2.0 | 1560 | $3,800 | $2.44 | 18d | 1 | 1.17mi |
| 735 20th St West Palm Beach, FL | 4.0 | 3.0 | 1767 | $3,800 | $2.15 | 24d | 1 | 1.19mi |
| 735 20th St West Palm Beach, FL | 4.0 | 3.0 | 1767 | $3,600 | $2.04 | 8d | 1 | 1.19mi |
| 1101 Grant St West Palm Beach, FL | 4.0 | 2.0 | 1726 | $2,995 | $1.74 | 16d | 1 | 1.28mi |
Listing history 45 events
-
2026-06-18days on market $398,900 Active 301 DOM
-
2026-06-17days on market $398,900 Active 300 DOM
-
2026-06-16days on market $398,900 Active 299 DOM
-
2026-06-15days on market $398,900 Active 298 DOM
-
2026-06-13days on market $398,900 Active 296 DOM
-
2026-06-09days on market $398,900 Active 292 DOM
-
2026-06-07pricedays on market $398,900 Active 290 DOM
-
2026-06-04days on market $409,900 Active 287 DOM
-
2026-06-03days on market $409,900 Active 286 DOM
-
2026-06-01days on market $409,900 Active 284 DOM
-
2026-05-31days on market $409,900 Active 283 DOM
-
2026-04-09price $409,900
-
2025-11-04price $419,900
-
2025-09-29price $429,900
-
2025-09-16price $434,900
-
2025-08-21$449,900 Active
-
2023-11-06soldstatus $339,000
-
2023-10-25soldstatus $339,000 Closed 682-char remark
Show marketing remark (682 chars)
Welcome to this fantastic investment opportunity under normal market prices! This property boasts two separate units, each with their own electric meter, providing a great investment opportunity for investors. Currently, the property is rented out to long-term tenants at under market value, which means there is a significant opportunity for an increase in rental income. With the potential to revamp the space, this property provides a unique opportunity for those looking for properties with a high chance to increase their income. Don't miss out on this incredible investment opportunity. Call us today to schedule a viewing and take the first step towards having an investment.
-
2023-10-10historical Active Under Contract 682-char remark
Show marketing remark (682 chars)
Welcome to this fantastic investment opportunity under normal market prices! This property boasts two separate units, each with their own electric meter, providing a great investment opportunity for investors. Currently, the property is rented out to long-term tenants at under market value, which means there is a significant opportunity for an increase in rental income. With the potential to revamp the space, this property provides a unique opportunity for those looking for properties with a high chance to increase their income. Don't miss out on this incredible investment opportunity. Call us today to schedule a viewing and take the first step towards having an investment.
-
2023-05-02$339,000 Active 682-char remark
Show marketing remark (682 chars)
Welcome to this fantastic investment opportunity under normal market prices! This property boasts two separate units, each with their own electric meter, providing a great investment opportunity for investors. Currently, the property is rented out to long-term tenants at under market value, which means there is a significant opportunity for an increase in rental income. With the potential to revamp the space, this property provides a unique opportunity for those looking for properties with a high chance to increase their income. Don't miss out on this incredible investment opportunity. Call us today to schedule a viewing and take the first step towards having an investment.
-
2023-04-27historical $339,000 682-char remark
Show marketing remark (682 chars)
Welcome to this fantastic investment opportunity under normal market prices! This property boasts two separate units, each with their own electric meter, providing a great investment opportunity for investors. Currently, the property is rented out to long-term tenants at under market value, which means there is a significant opportunity for an increase in rental income. With the potential to revamp the space, this property provides a unique opportunity for those looking for properties with a high chance to increase their income. Don't miss out on this incredible investment opportunity. Call us today to schedule a viewing and take the first step towards having an investment.
-
2022-07-19status Pending
-
2022-07-19status Pending
-
2022-07-18historical
-
2022-07-18historical
-
2022-06-09$320,000 Active
-
2022-05-24$320,000 Active
-
2018-06-26historical
-
2016-01-18soldstatus $68,000
-
2015-03-16price $79,900
-
2015-03-16historical
-
2015-03-05price $85,900
-
2015-01-28price $89,900
-
2015-01-08$95,000 Active
-
2014-10-23historical
-
2006-05-12soldstatus $176,000
-
2006-05-09soldstatus $176,000
-
2006-04-29historical
-
2006-03-02$184,000
-
2004-08-18soldstatus $123,000
-
2004-06-14$123,800
-
2002-10-18soldstatus $102,000
-
2002-08-20soldstatus $43,000
-
2002-07-31$105,900
-
1974-01-01soldstatus $23,000
ⓘ Source: listings_history table (triggers on properties + properties_extension) + one-shot
backfill from property_details.listing_events for pre-trigger history.
Tax reassessment forecast FL · Resets to sale price
- Current annual tax
- $6,523 · $544/mo
- Projected year-2 tax
- $6,523 · $544/mo
- Expected delta
- $0/yr ($0/mo · 0.0%)
ⓘ Screening estimate from a state-policy table — verify with the county assessor before closing.
Climate risk First Street
- Flood 1/10 Low FEMA zone X (unshaded) · 0% chance over 30 yrs
- Wildfire 1/10 Low
- Heat 10/10 Extreme 7 d/yr ≥105°F today · 25 d/yr by 30 yrs out
- Wind 10/10 Extreme 99% chance of damaging wind over 30 yrs
- Air quality 2/10 Low 1 unhealthy d/yr today · 1 by 30 yrs out
Nearby sold comps map
Loading sold comps map…
Walkable amenities ~0.75 mi
Loading nearby amenities…
Taxation est. · year 1
- Rental income
- $86,760
- − Mortgage interest
- −$22,345
- − Property taxes
- −$6,523
- − Insurance
- −$1,994
- − Repairs & maintenance
- −$6,941
- − Management
- −$6,941
- − Depreciation
- −$11,604
- Taxable income
- $30,412
- Est. tax owed @ 24.0%
- −$7,299
- After-tax cash flow
- $27,621/yr
For passive investors: Depreciation is non-cash, so a rental often shows a tax loss while cash-flowing — sheltering income. Rental losses are passive: they offset passive income freely, and up to $25,000/yr can offset ordinary (W-2) income if you actively participate and your MAGI is under $100k (phasing out to $0 by $150k); unused losses carry forward. On sale, claimed depreciation is recaptured at up to 25%, and gains may owe capital-gains tax (a 1031 exchange can defer both). Figures are a year-1 estimate at your 24.0% rate — not tax advice; consult a CPA.
Schools (NCES district)
- District
- Palm Beach
- NCES district ID
- 1201500
- Math proficiency
- 46% ▼ -16.00%
- Reading proficiency
- 53% ▼ -4.00%
- Median HH income
- $53,943
- Composite
- 42.72/100
- National rank
- #3160
- State rank
- #34 of 73 in FL
Livability — West Palm Beach
- Score
- 82/100
- State rank
- #75
- US rank
- #1255
Category grades
Schools grade is shown separately in the Schools card above.
Census & demographics
- Census place
- West Palm Beach, FL
- County
- Palm Beach County · 1,438,312 people
- City population
- 222,012
- Metro
- Miami-Fort Lauderdale-Pompano Beach, FL
- Population (ZIP)
- 34,851
- Household income
- $59,993
- Rent vs Own
- Severe rent burden
- 2157.0
Population outlook (Palm Beach County) Hauer SSP2
- Today (2025)
- 1,637,487 people
- By 2030
- 1,743,255 · +6.5%
- By 2040
- 1,948,712 · +19.0%
- By 2050
- 2,132,979 · +30.3%
- By 2075
- 2,530,027 · +54.5%
- By 2100
- 2,706,979 · +65.3%
Race, ethnicity, and origin ACS 2023
- Neighborhood character
- Diverse neighborhood (Simpson 0.62)
- Race & ethnicity
- Black 54% White 21% Hispanic / Latino 20% Two or more races 13% Asian 2%
- Hispanic origin (detail)
- Mexican 2% Puerto Rican 2% Cuban 2%
- Common ancestry
- Hispanic 8% Lithuanian 1% Romanian 1%
- Foreign-born
- 26% · Canada, Vietnam, Jamaica
- Languages at home
- 72% English-only · Spanish 17% French/Haitian/Cajun 8% Other Indo-European 1%
Political lean MEDSL · Palm Beach
- 2024 margin
- Toss-up / Even · D 50.0% · R 49.2%
- 2008→2024 swing
- -22.1pp toward R · 2008: 22.9pp · 2024: 0.8pp
- All cycles
- 2024: D+0.8 2020: D+12.8 2016: D+15.3 2012: D+17.0 2008: D+22.9
Not yet ingested
- Civics
- —
Market trends
- HPI YoY
- ▼ -299.26%
- Current HPI
- 363.3995
- Rent YoY
- ▲ 3.08%
- Metro
- Miami-Fort Lauderdale-Pompano Beach, FL
- State GDP YoY
- ▲ 3.28%
- F500 in state
- 36
Industry mix (Fortune 500 HQ in FL)
| Industry | F500 HQs | Revenue |
|---|---|---|
| Industrial Technology | 2 | $29B |
|
||
| Insurance | 2 | $17B |
|
||
| Retail | 1 | $60B |
|
||
| Technology Distribution | 1 | $58B |
|
||
| Homebuilding | 1 | $35B |
|
||
| Technology Manufacturing | 1 | $35B |
|
||
Price history
+1682.2% since first listed34 events — show timeline
- 2026-04-09 Price Changed $409,900 Beaches MLS
- 2025-11-04 Price Changed $419,900 Beaches MLS
- 2025-09-29 Price Changed $429,900 Beaches MLS
- 2025-09-16 Price Changed $434,900 Beaches MLS
- 2025-08-21 Listed $449,900 Beaches MLS
- 2023-11-06 Sold (Public Records) $339,000 Public Records
- 2023-10-25 Sold (MLS) $339,000 Beaches MLS
- 2023-10-10 Contingent — Beaches MLS
- 2023-05-02 Listed $339,000 Beaches MLS
- 2023-04-27 Coming Soon $339,000 Beaches MLS
- 2022-07-19 Pending — Beaches MLS
- 2022-07-19 Pending — Beaches MLS
- 2022-07-18 Listing Removed — Beaches MLS
- 2022-07-18 Listing Removed — Beaches MLS
- 2022-06-09 Listed $320,000 Beaches MLS
- 2022-05-24 Listed $320,000 Beaches MLS
- 2018-06-26 Listing Removed — Beaches MLS
- 2016-01-18 Sold (Public Records) $68,000 Public Records
- 2015-03-16 Price Changed $79,900 Beaches MLS
- 2015-03-16 Listing Removed — Beaches MLS
- 2015-03-05 Price Changed $85,900 Beaches MLS
- 2015-01-28 Price Changed $89,900 Beaches MLS
- 2015-01-08 Listed $95,000 Beaches MLS
- 2014-10-23 Listing Removed — Beaches MLS
- 2006-05-12 Sold (Public Records) $176,000 Public Records
- 2006-05-09 Sold (MLS) $176,000 Beaches MLS
- 2006-04-29 Listing Removed — Beaches MLS
- 2006-03-02 Listed $184,000 Beaches MLS
- 2004-08-18 Sold (Public Records) $123,000 Public Records
- 2004-06-14 Listed $123,800 Beaches MLS
- 2002-10-18 Sold (Public Records) $102,000 Public Records
- 2002-08-20 Sold (Public Records) $43,000 Public Records
- 2002-07-31 Listed $105,900 Beaches MLS
- 1974-01-01 Sold (Public Records) $23,000 Public Records
Property tax history
+12.3%/yrLatest (2025): $6,523 · +9.8% YoY. Source: county tax records.
Cash-flow waterfall
monthlySold comps — $/sqft
last 12 mo · ≤1 miLoading sold comps…