 Multi-family
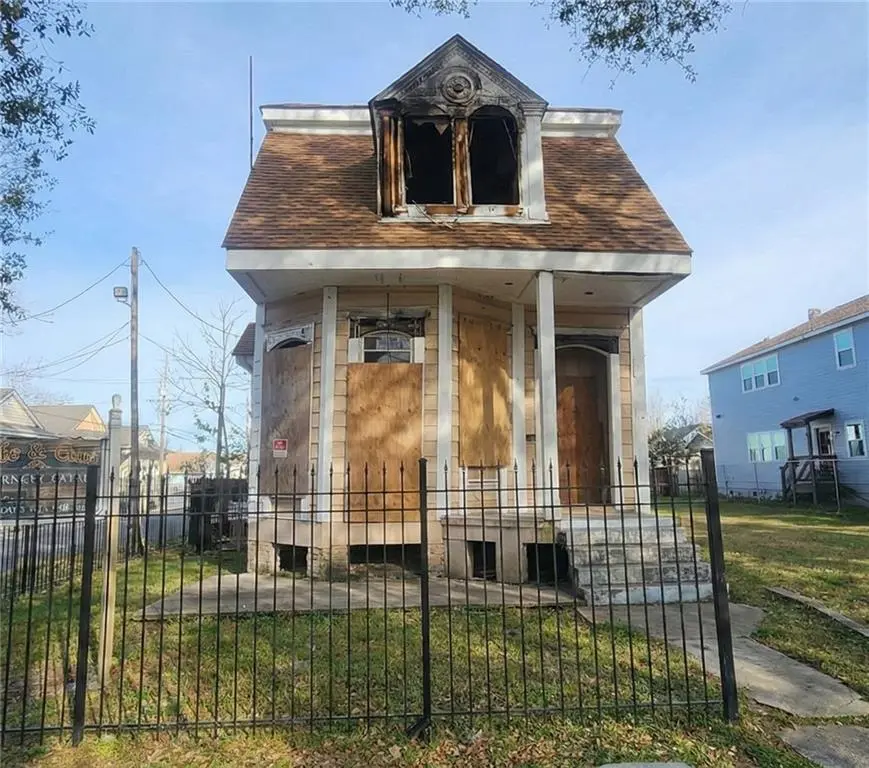
2139 Elysian Fields Ave · New Orleans, LA
Flood risk 8/10 · Major
- FEMA flood zone
- X (shaded)
- Chance of flooding over 30 yrs
- 0.6%
- Est. flood insurance / yr
- $507 – $1,088
Fire risk 1/10 · Minimal
- Est. fire insurance / yr
- $1,269 – $2,357
Heat risk 10/10 · Severe
- Hot days now (above 108°F)
- 7 days/yr
- Hot days in 30 yrs
- 21 days/yr
Wind risk 10/10 · Severe
- Chance of severe wind over 30 yrs
- 99.0%
Air-quality risk 4/10 · Minor
- Unhealthy air days now
- 4 days/yr
- Unhealthy air days in 30 yrs
- 4 days/yr
Risk factors via First Street. Map © Google.
Why this score? — see what drove the B- grade
The composite is a weighted blend of 9 inputs, each scored 0–100. Each bar is that input's sub-score; the figure is the points it added to the 100-point composite (weight × sub-score).
- Cash flow +30.0/30.0
- 1% rule +10.0/10.0
- DSCR +10.0/10.0
- ARV discount +7.5/15.0
- Livability +4.0/5.0
- Rent growth +3.1/5.0
- Condition / age +2.5/5.0
- Schools +1.6/10.0
- Appreciation +0.0/10.0
$78,000
🖨 Deal sheet 📄 Offer letter ✓ Due diligence
Multi-family units
County records classify this as Multi-Family (2-4 Unit). Listing-text estimate: 1 unit. estimate disagrees with records
Listing remarks MLS
Excellent redevelopment opportunity on Elysian Fields Avenue. Formerly used as a law office, this property has remained unused since Hurricane Katrina and is being sold strictly for lot value. The existing structure will require a full TEARDOWN or substantial redevelopment and is not being marketed for occupancy. The property has been rezoned to residential, making it well-suited for new construction or a custom residential project. The listing price is based on recent comparable lot sales along Elysian Fields, providing a solid entry point for investors and builders looking to capitalize on the area's continued growth and redevelopment activity. A true blank slate in a high-visibility corridor with strong redevelopment momentum nearby. Buyer to perform all due diligence regarding zoning, permitted uses, and building requirements.
Key facts
- Parking
- Built 1940
- Listed 130 days
Tags
Neighborhood map
What this means for you Summary
Snapshot
- This is a 5-bed/3.0-bath multifamily listed at $78k.
Deal economics
- At list price, monthly cash flow is $1k ($13k/yr) — positive.
- The deal already cash-flows at list — no discount required.
- Meets the 1% rule at list price ($2k rent vs $78k).
- Recommended offer: $69k (12.0% below list) — sets the bar for market timing.
- Cap rate 24.1% vs local median 4.4% in New Orleans — top-decile yield for the area; either an underpriced asset or a hidden risk that comps aren't pricing in. Stress-test before assuming the spread holds.
Location & tenants
- Location reads 81/100 on livability (#3 in LA, #1,383 nationally) — a professional / high-income tenant draw. Strengths: amenities A+, commute A+, health & safety A+; Watch: crime C-, employment D.
- Orleans Parish (urban): math 11% / reading 27% proficiency, ranked #69 of 98 in LA (top 70%) — low school quality limits family demand, transient renter base, plan for 1-2y turnover; 68% free/reduced lunch — lower-income household profile, screen leases tightly.
- Market conditions: Rents rising (+2.5%/yr); 581 active listings in the ZIP; 7 comparable units currently listed for rent nearby; rentals at typical pace (median 24d on market — plan ~3-4 weeks tenant-placement turnaround); 710 units permitted in Orleans Parish in 2024 (244 in 5+ unit buildings).
- At $2,195/mo this rent would consume 58% of the median local household income ($46k/yr) (locally 1988% of renters already pay >50% of income on rent) — very limited rent-growth headroom before tenants either downsize or default.
Forward outlook
- Local home prices are declining (-3.0%/yr); year-one equity from $539 of loan paydown is wiped out by about $2k of value loss. Plan a longer hold.
- Orleans County population projected at +61% by 2050 — long-run rental-demand tailwind backs the buy-and-hold thesis.
- At projected returns (-3.0% appreciation + 2.5% rent growth), your $22k cash investment doubles in ~2 years — after that, you're playing with house money.
Negotiation context
- It's been on market 130 days — a 12% lower offer ($69k) is reasonable based on typical stale-listing flexibility.
- 2 sale attempts; this cycle's ask has dropped $30k (28%) from the opening price — seller is motivated, your offer sets the floor, not the list.
- Current owner paid $15k; list at $78k implies a 420% gain — meaningful room to come down on a strong offer.
Risks & watch-outs
- Watch-outs: flood insurance adds $66/mo; built in 1940 — expect roof / HVAC / electrical / plumbing capex.
- Climate carrying-cost: severe flood risk; severe wind risk, 99% chance of damaging wind over 30y; extreme-heat days projected 7→21/yr by 2055 (HVAC capex compounding) — expect insurance premiums to compound above CPI over the hold.
Questions for the listing agent
- It's been on market 130 days. Have you received any prior offers? Is the seller open to a 12% concession, seller financing, or rate buy-down credit?
- Built in 1940 — when were the roof, HVAC, electrical panel, plumbing, and water heater last replaced?
- What's the actual annual flood-insurance premium (NFIP or private), and is the property in a SFHA with mandatory coverage?
- Why hasn't it sold? Are there any deal-killer items the seller is aware of (foundation, flood, title, zoning, code violations)?
- Is there a deadline driving the sale (1031 exchange, divorce, estate, relocation)? That informs how much negotiation room exists.
- What's the average days-on-market for RENTAL listings here right now (not sales)? A rising rental-DOM trend means longer vacancies and softer asking-rent achievability than the comps imply.
- What's the recent tenant-quality profile in this submarket — average credit score on applications, eviction rate, late-payment / NSF rate, and stable-employment percentage? A property-management company in the area should have these aggregated.
- How much new apartment / multifamily construction is in the pipeline within 1–3 miles? Heavy new supply (>2% of stock underway) typically softens rents 12–24 months out; light construction supports rent growth.
Investment metrics
- 1% rule
- 2.81% ✓
- Cap rate
- 24.11%
- Cash-on-cash
- 63.64%
- DSCR
- 3.83
- GRM
- 3.0
CMA / ARV
- ARV (median comp)
- $330,547
- List price
- $78,000
- Delta
- -76.40%
- Verdict
- UNDERPRICED
- Comps
- 20 within 1.0 mi
Show comp detail 12 sales within ~0.75 mi
| Address | Dist | Beds/Ba | Sqft | Sold | Price | $/sf | Match |
|---|---|---|---|---|---|---|---|
| 2530 32 N Galvez St | 0.45mi | 5/3.0 | 2,402 (+2%) | 8mo | $214,900 | $89 | 69 |
| 2024 26 St Anthony St | 0.33mi | 6/4.0 (+1) | 2,482 (+6%) | 6mo | $350,000 | $141 | 61 |
| 1810 Allen St | 0.53mi | 4/4.0 (-1) | 2,390 (+2%) | 4mo | $265,000 | $111 | 61 |
| 3033 35 Pauger St | 0.27mi | 6/4.0 (+1) | 2,057 (-12%) | 1mo | $295,000 | $143 | 57 |
| 1966 N Prieur St | 0.35mi | 6/4.0 (+1) | 2,166 (-8%) | 6mo | $308,000 | $142 | 56 |
| 2329-2331 Saint Anthony St | 0.33mi | 6/2.0 (+1) | 2,156 (-8%) | 8mo | $130,000 | $60 | 55 |
| 2825-27 Spain St | 0.57mi | 6/4.0 (+1) | 2,496 (+6%) | 7mo | $385,000 | $154 | 48 |
| 1902 04 Agriculture St | 0.71mi | 6/3.0 (+1) | 2,524 (+7%) | 5mo | $102,000 | $40 | 45 |
| 1612 14 Saint Roch Ave | 0.45mi | 6/4.0 (+1) | 2,660 (+13%) | 6mo | $500,000 | $188 | 43 |
| 1946 Hope St | 0.66mi | 6/4.0 (+1) | 2,132 (-9%) | 4mo | $289,000 | $136 | 42 |
| 1636-.5 N Miro St | 0.70mi | 6/5.0 (+1) | 2,459 (+4%) | 9mo | $300,000 | $122 | 39 |
| 2117 19 Marais St | 0.69mi | 4/2.0 (-1) | 2,084 (-11%) | 5mo | $295,000 | $142 | 36 |
Match score weights: distance 35% · size 25% · config 20% · recency 20%. Top-matched comps best support the ARV.
Projected returns pro-forma
-3.0% appreciation · 2.49% rent growth · sell at horizon
- IRR
- 58.1%
- Equity multiple
- 3.56×
- Total profit
- $55,874
- Equity at exit
- $11,630
- IRR
- 62.8%
- Equity multiple
- 7.14×
- Total profit
- $134,036
- Equity at exit
- $6,744
Cash invested: $21,840 (down + closing). Projections, not guarantees.
Landlord ↔ Tenant lean methodology
- Overall (STATE)
- 90 Strongly Landlord-Friendly
- State Louisiana
- 90 Strongly Landlord-Friendly · R+12
- County
- — inherits STATE
- City
- — inherits STATE
ZIP-level market 70117
- Rents YoY
- 2.5%
- Active inventory
- 581
- Price-to-rent
- 3.0×
Monthly cashflow live
- Estimated rent
- $2,195 high interval (Pro) →
- Mortgage (P&I)
- −$409
- Tax from tax record
- −$134 /mo · $1,611/yr
- Insurance
- −$32
- Flood insurance flood zone
- −$66 /mo · $798/yr
- HOA
- −$0
- Vacancy / Maint / Mgmt
- −$461
- Net cashflow
- $1,092
Break-even live
Sensitivity live
| Price | -10% $1,136 | -5% $1,114 | +0% $1,092 | +5% $1,070 | +10% $1,048 |
|---|---|---|---|---|---|
| Rent | -10% $918 | -5% $1,005 | +0% $1,092 | +5% $1,179 | +10% $1,265 |
| Rate | -1.0pp $1,131 | -0.5pp $1,112 | base $1,092 | +0.5pp $1,072 | +1.0pp $1,051 |
UW: 25.0% down · 7.5% · 30yr · 1.5% tax · 5.0% vac · 8.0% maint · 8.0% mgmt
Financing live
Cash to close
- Down payment
- $19,500
- Closing costs
- $2,340
- Reserves months
- —
- Total cash needed
- —
Loan-product check · same deal, 3 products live
Conventional
25% down · 7.5% · 30yr
- Down + closing
- —
- Monthly P&I
- —
- Monthly cashflow
- —
- DSCR
- —
- Eligible?
- —
Personal DTI + credit; lowest rate.
DSCR
20% down · 8.5% · 30yr
- Down + closing
- —
- Monthly P&I
- —
- Monthly cashflow
- —
- DSCR
- —
- Eligible?
- —
No personal income docs; deal must DSCR.
Hard money
10% down · 12.0% · 12mo
- Down + closing
- —
- Monthly P&I
- —
- Monthly cashflow
- —
- DSCR
- —
- Eligible?
- —
Short-term bridge; refi at stabilization.
Rent comps 7 comps
| Address | Beds | Baths | Sqft | Rent | $/sqft | DOM | Units | Dist |
|---|---|---|---|---|---|---|---|---|
| 2107 Elysian Fields Ave New Orleans, LA | 4.0 | 2.0 | 1794 | $1,650 | $0.92 | 3d | 1 | 0.08mi |
| 2920 Pauger St New Orleans, LA | 4.0 | 2.0 | 1882 | $1,995 | $1.06 | 24d | 1 | 0.28mi |
| 3228 Pauger St New Orleans, LA | 5.0 | 2.0 | 1600 | $2,100 | $1.31 | 24d | 1 | 0.36mi |
| 2317 N Rampart St Unit 1272378P New Orleans, LA | 3.0–6.0 | 2.0–4.0 | 1581 | $6,144 | $3.88 | 3d | 2 | 0.85mi |
| 1860 Burgundy St New Orleans, LA | 4.0 | 4.0 | 3000 | $3,500 | $1.17 | 24d | 1 | 0.97mi |
| 811 Burgundy St New Orleans, LA | 4.0 | 2.5 | 2059 | $5,000 | $2.43 | 44d | 1 | 1.43mi |
| 3302 Metropolitan St New Orleans, LA | 4.0 | 2.5 | 1700 | $2,200 | $1.29 | 17d | 1 | 1.47mi |
Listing history 19 events
-
2026-06-18days on market $78,000 Active 130 DOM
-
2026-06-17days on market $78,000 Active 129 DOM
-
2026-06-16days on market $78,000 Active 128 DOM
-
2026-06-15days on market $78,000 Active 127 DOM
-
2026-06-13days on market $78,000 Active 125 DOM
-
2026-06-10days on market $78,000 Active 122 DOM
-
2026-06-09days on market $78,000 Active 121 DOM
-
2026-06-08days on market $78,000 Active 120 DOM
-
2026-06-07days on market $78,000 Active 119 DOM
-
2026-06-05days on market $78,000 Active 116 DOM
-
2026-06-03days on market $78,000 Active 115 DOM
-
2026-06-02days on market $78,000 Active 114 DOM
-
2026-06-01days on market $78,000 Active 113 DOM
-
2026-05-31days on market $78,000 Active 112 DOM
-
2026-03-15price $78,000 842-char remark
Show marketing remark (848 chars)
Excellent redevelopment opportunity on Elysian Fields Avenue. Formerly used as a law office, this property has remained unused since Hurricane Katrina and is being sold strictly for lot value. The existing structure will require a full TEARDOWN or substantial redevelopment and is not being marketed for occupancy. The property has been rezoned to residential, making it well-suited for new construction or a custom residential project. The listing price is based on recent comparable lot sales along Elysian Fields, providing a solid entry point for investors and builders looking to capitalize on the area’s continued growth and redevelopment activity. A true blank slate in a high-visibility corridor with strong redevelopment momentum nearby. Buyer to perform all due diligence regarding zoning, permitted uses, and building requirements.
-
2026-03-15price $78,000 848-char remark
Show marketing remark (848 chars)
Excellent redevelopment opportunity on Elysian Fields Avenue. Formerly used as a law office, this property has remained unused since Hurricane Katrina and is being sold strictly for lot value. The existing structure will require a full TEARDOWN or substantial redevelopment and is not being marketed for occupancy. The property has been rezoned to residential, making it well-suited for new construction or a custom residential project. The listing price is based on recent comparable lot sales along Elysian Fields, providing a solid entry point for investors and builders looking to capitalize on the area’s continued growth and redevelopment activity. A true blank slate in a high-visibility corridor with strong redevelopment momentum nearby. Buyer to perform all due diligence regarding zoning, permitted uses, and building requirements.
-
2026-02-08$108,000 Active 842-char remark
Show marketing remark (848 chars)
Excellent redevelopment opportunity on Elysian Fields Avenue. Formerly used as a law office, this property has remained unused since Hurricane Katrina and is being sold strictly for lot value. The existing structure will require a full TEARDOWN or substantial redevelopment and is not being marketed for occupancy. The property has been rezoned to residential, making it well-suited for new construction or a custom residential project. The listing price is based on recent comparable lot sales along Elysian Fields, providing a solid entry point for investors and builders looking to capitalize on the area’s continued growth and redevelopment activity. A true blank slate in a high-visibility corridor with strong redevelopment momentum nearby. Buyer to perform all due diligence regarding zoning, permitted uses, and building requirements.
-
2026-02-08$108,000 Active 848-char remark
Show marketing remark (848 chars)
Excellent redevelopment opportunity on Elysian Fields Avenue. Formerly used as a law office, this property has remained unused since Hurricane Katrina and is being sold strictly for lot value. The existing structure will require a full TEARDOWN or substantial redevelopment and is not being marketed for occupancy. The property has been rezoned to residential, making it well-suited for new construction or a custom residential project. The listing price is based on recent comparable lot sales along Elysian Fields, providing a solid entry point for investors and builders looking to capitalize on the area’s continued growth and redevelopment activity. A true blank slate in a high-visibility corridor with strong redevelopment momentum nearby. Buyer to perform all due diligence regarding zoning, permitted uses, and building requirements.
-
1981-02-04soldstatus $15,000
ⓘ Source: listings_history table (triggers on properties + properties_extension) + one-shot
backfill from property_details.listing_events for pre-trigger history.
Tax reassessment forecast LA · Resets to sale price
- Current annual tax
- $1,611 · $134/mo
- Projected year-2 tax
- $1,611 · $134/mo
- Expected delta
- $0/yr ($0/mo · 0.0%)
ⓘ Screening estimate from a state-policy table — verify with the county assessor before closing.
Climate risk First Street
- Flood 8/10 Severe FEMA zone X (shaded) · 60% chance over 30 yrs
- Wildfire 1/10 Low
- Heat 10/10 Extreme 7 d/yr ≥108°F today · 21 d/yr by 30 yrs out
- Wind 10/10 Extreme 99% chance of damaging wind over 30 yrs
- Air quality 4/10 Moderate 4 unhealthy d/yr today · 4 by 30 yrs out
Nearby sold comps map
Loading sold comps map…
Walkable amenities ~0.75 mi
Loading nearby amenities…
Taxation est. · year 1
- Rental income
- $26,340
- − Mortgage interest
- −$4,369
- − Property taxes
- −$1,611
- − Insurance
- −$1,188
- − Repairs & maintenance
- −$2,107
- − Management
- −$2,107
- − Depreciation
- −$2,269
- Taxable income
- $12,689
- Est. tax owed @ 24.0%
- −$3,045
- After-tax cash flow
- $10,056/yr
For passive investors: Depreciation is non-cash, so a rental often shows a tax loss while cash-flowing — sheltering income. Rental losses are passive: they offset passive income freely, and up to $25,000/yr can offset ordinary (W-2) income if you actively participate and your MAGI is under $100k (phasing out to $0 by $150k); unused losses carry forward. On sale, claimed depreciation is recaptured at up to 25%, and gains may owe capital-gains tax (a 1031 exchange can defer both). Figures are a year-1 estimate at your 24.0% rate — not tax advice; consult a CPA.
Schools (NCES district)
- District
- Orleans Parish
- NCES district ID
- 2201170
- Math proficiency
- 11% ▼ -52.00%
- Reading proficiency
- 27% ▼ -46.00%
- Median HH income
- $37,011
- Composite
- 15.78/100
- National rank
- #9271
- State rank
- #69 of 98 in LA
Livability — New Orleans
- Score
- 81/100
- State rank
- #3
- US rank
- #1383
Category grades
Schools grade is shown separately in the Schools card above.
Census & demographics
- Census place
- New Orleans, LA
- County
- Orleans Parish · 338,817 people
- City population
- 338,817
- Metro
- New Orleans-Metairie, LA
- Population (ZIP)
- 25,652
- Household income
- $45,764
- Rent vs Own
- Severe rent burden
- 1988.0
Population outlook (Orleans County) Hauer SSP2
- Today (2025)
- 513,025 people
- By 2030
- 575,781 · +12.2%
- By 2040
- 700,174 · +36.5%
- By 2050
- 826,541 · +61.1%
- By 2075
- 1,123,374 · +119.0%
- By 2100
- 1,355,609 · +164.2%
Race, ethnicity, and origin ACS 2023
- Neighborhood character
- Majority Black (60%)
- Race & ethnicity
- Black 60% White 30% Two or more races 6% Hispanic / Latino 5%
- Common ancestry
- Lithuanian 5% Italian 1% Romanian 1%
- Foreign-born
- 5% · Canada, South Korea
- Languages at home
- 93% English-only · Spanish 3% Other Indo-European 1% French/Haitian/Cajun 1%
Political lean MEDSL · Orleans
- 2024 margin
- Solid D (+67.0) · D 82.2% · R 15.2% · Other 2.7%
- 2008→2024 swing
- +6.7pp toward D · 2008: 60.3pp · 2024: 67.0pp
- All cycles
- 2024: D+67.0 2020: D+68.2 2016: D+66.2 2012: D+62.5 2008: D+60.3
Not yet ingested
- Civics
- —
Market trends
- HPI YoY
- ▼ -177.22%
- Current HPI
- 184.6061
- Rent YoY
- ▲ 2.49%
- Metro
- New Orleans-Metairie, LA
- State GDP YoY
- ▲ 3.29%
- F500 in state
- 10
Industry mix (Fortune 500 HQ in LA)
| Industry | F500 HQs | Revenue |
|---|---|---|
| Telecommunications | 2 | $23B |
|
||
| Utilities | 1 | $12B |
|
||
| Wholesale / Distribution | 1 | $5B |
|
||
| Advertising | 1 | $2B |
|
||
Price history
+420.0% since first listed5 events — show timeline
- 2026-03-15 Price Changed $78,000 AcadianaMLS
- 2026-03-15 Price Changed $78,000 GSREIN
- 2026-02-08 Listed $108,000 GSREIN
- 2026-02-08 Listed $108,000 AcadianaMLS
- 1981-02-04 Sold (Public Records) $15,000 Public Records
Property tax history
+13.1%/yrLatest (2026): $1,611 · +1.1% YoY. Source: county tax records.
Cash-flow waterfall
monthlySold comps — $/sqft
last 12 mo · ≤1 miLoading sold comps…