 Duplex
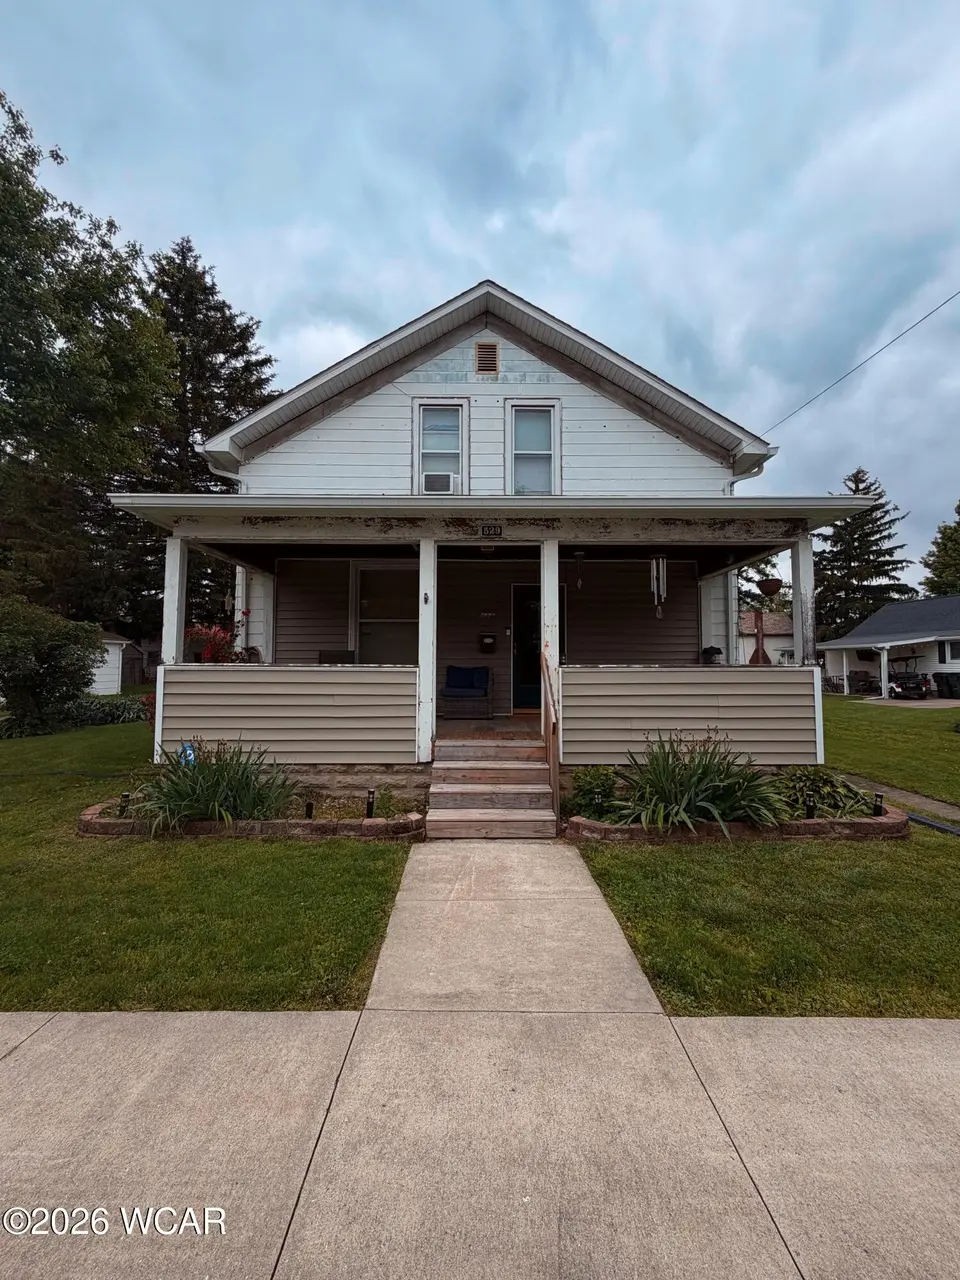
529 N Moening St · Delphos, OH
Flood risk 3/10 · Minor
- FEMA flood zone
- X (unshaded)
- Chance of flooding over 30 yrs
- 0.1%
- Est. flood insurance / yr
- $473 – $860
Fire risk 1/10 · Minimal
- Est. fire insurance / yr
- $713 – $1,323
Heat risk 3/10 · Minor
- Hot days now (above 101°F)
- 7 days/yr
- Hot days in 30 yrs
- 17 days/yr
Wind risk 2/10 · Minimal
- Chance of severe wind over 30 yrs
- —
Air-quality risk 2/10 · Minimal
- Unhealthy air days now
- 1 days/yr
- Unhealthy air days in 30 yrs
- 2 days/yr
Risk factors via First Street. Map © Google.
Why this score? — see what drove the B+ grade
The composite is a weighted blend of 9 inputs, each scored 0–100. Each bar is that input's sub-score; the figure is the points it added to the 100-point composite (weight × sub-score).
- Cash flow +30.0/30.0
- ARV discount +11.9/15.0
- DSCR +10.0/10.0
- 1% rule +9.2/10.0
- Schools +6.4/10.0
- Livability +3.6/5.0
- Rent growth +2.5/5.0
- Condition / age +2.5/5.0
- Appreciation +0.0/10.0
$125,000
🖨 Deal sheet (PDF) 📄 Offer letter ✓ Due diligence
Multi-family units
County records classify this as Multi-Family (2-4 Unit). Listing-text estimate: 2 units. confirmed
Listing remarks
This well-maintained duplex offers flexibility, updates, and investment potential all in one property! The first-floor unit features 2 bedrooms, 1 full bath, convenient first-floor laundry, and newer flooring. The upper unit, accessible by exterior stairs and deck area, also includes 2 bedrooms and 1 full bath with numerous updates including an updated kitchen, flooring, plumbing, and drop ceiling. Major improvements provide peace of mind, including a new roof (2023), central air (2023), and water heater (2023). Each unit has separate utilities with individual water heaters and separate meters, making management simple for owner-occupants or investors alike. Outside, you'll find a garage bu
Key facts
- Separate utilities
- First floor laundry
- Water heater
Tags
Property features AI
Exterior
- Parking: Off-street parking; 1-car garage
- Utilities: Public water; Public sewer
- Home design: Multi-family residential income property; Approximately 1,872 square feet
- Construction: Block foundation; Asphalt roof
- Exterior features: Porch; Residential zoning
Interior
- Bathrooms: 2 full bathrooms
- Heating & cooling: Forced air heating; Central air conditioning
- Interior features: Basement with block construction and a sump pump
Neighborhood map
What this means for you Summary
Snapshot
- This is a 2 × 2-bed/1.0-bath units multifamily listed at $125k.
Deal economics
- At list price, monthly cash flow is $631 ($8k/yr) — positive. Per door: $315/mo.
- The deal already cash-flows at list — no discount required.
- Meets the 1% rule at list price ($2k rent vs $125k).
- Cap rate 12.4% vs local median 3.9% in Delphos — top-decile yield for the area; either an underpriced asset or a hidden risk that comps aren't pricing in. Stress-test before assuming the spread holds.
Location & tenants
- Location reads 72/100 on livability (#378 in OH) — a middle-class / working-renter tenant base. Strengths: crime A+, cost of living A+, housing A+; Watch: employment D, amenities F, commute F.
- Delphos City (town): math 77% / reading 75% proficiency, ranked #91 of 656 in OH (top 14%) — strong family-tenant draw, lease renewals of 3-5y typical.
- Zoned schools: Franklin Elementary School (math 87% / reading 77%, grade A+, #116 of 1,584 statewide, top 9%, 339 students, 46% FRL); Jefferson Middle School (math 79% / reading 73%, grade A, #74 of 654 statewide, top 12%, 244 students, 46% FRL); Jefferson High School (math 57% / reading 82%, grade B, #106 of 781 statewide, top 16%, 272 students, 36% FRL).
- Market conditions: 17 active listings in the ZIP; 88 units permitted in Allen County in 2024 (0 in 5+ unit buildings).
- This rent runs 32% of the median local income ($67k/yr) — at the standard rent-burdened threshold; future hikes will face affordability resistance.
Forward outlook
- Local home prices are declining (-3.0%/yr); year-one equity from $864 of loan paydown is wiped out by about $4k of value loss. Plan a longer hold.
- Allen County population projected at -14% by 2050 — secular population decline; favor cash flow + early exit over multi-decade hold.
- At projected returns (-3.0% appreciation + 3.0% rent growth), your $35k cash investment doubles in ~6 years — after that, you're playing with house money.
Negotiation context
- Only 8 days on market — expect competitive offers; lowballing is unlikely to land.
- 2 sale attempts since 14y ago with the ask held roughly flat each time — persistent listings suggest the price (not the market) is what's stuck; bring a comps-based counter.
- Current owner paid $40k; list at $125k implies a 212% gain — meaningful room to come down on a strong offer.
Risks & watch-outs
- Watch-outs: built in 1910 — expect roof / HVAC / electrical / plumbing capex.
Questions for the listing agent
- Can we see the unit-by-unit rent roll, current vacancy, and any below-market leases? What's the average tenancy length?
- What capital expenditures (roof, boiler, parking lot, exteriors) have been made in the last 5 years, and what's planned in the next 2?
- Built in 1910 — when were the roof, HVAC, electrical panel, plumbing, and water heater last replaced?
- Is there a deadline driving the sale (1031 exchange, divorce, estate, relocation)? That informs how much negotiation room exists.
- Schools are A-rated — typically a magnet for longer-tenancy family renters. What's the average tenant stay here, and is there a school-zone premium baked into asking?
- What's the average days-on-market for RENTAL listings here right now (not sales)? A rising rental-DOM trend means longer vacancies and softer asking-rent achievability than the comps imply.
- What's the recent tenant-quality profile in this submarket — average credit score on applications, eviction rate, late-payment / NSF rate, and stable-employment percentage? A property-management company in the area should have these aggregated.
- How much new apartment / multifamily construction is in the pipeline within 1–3 miles? Heavy new supply (>2% of stock underway) typically softens rents 12–24 months out; light construction supports rent growth.
Investment metrics
- 1% rule
- 1.42% ✓
- Cap rate
- 12.35%
- Cash-on-cash
- 21.63%
- DSCR
- 1.96
- GRM
- 5.9
CMA / ARV
- ARV (on-the-fly)
- $138,528
- Comps found
- 1
Show comp detail 1 sale within ~0.75 mi
| Address | Dist | Beds/Ba | Sqft | Sold | Price | $/sf | Match |
|---|---|---|---|---|---|---|---|
| 638-640 E 6th St | 0.09mi | 5/2.0 (+1) | 2,040 (+9%) | 10mo | $150,000 | $74 | 68 |
Match score weights: distance 35% · size 25% · config 20% · recency 20%. Top-matched comps best support the ARV.
Projected returns pro-forma
-3.0% appreciation · 3.0% rent growth · sell at horizon
- IRR
- 14.2%
- Equity multiple
- 1.57×
- Total profit
- $19,901
- Equity at exit
- $18,638
- IRR
- 23.0%
- Equity multiple
- 2.97×
- Total profit
- $68,950
- Equity at exit
- $10,808
Cash invested: $35,000 (down + closing). Projections, not guarantees.
Landlord ↔ Tenant lean methodology
- Overall (STATE)
- 73 Landlord-Friendly
- State Ohio
- 73 Landlord-Friendly · R+6
- County
- — inherits STATE
- City
- — inherits STATE
ZIP-level market 45833
- Home prices YoY
- -15.4%
- Active inventory
- 17
- Price-to-rent
- 11.7×
Monthly cashflow live
- Estimated rent
- $1,773 medium interval (Pro) →
- Mortgage (P&I)
- −$656
- Tax from tax record
- −$62 /mo · $745/yr
- Insurance
- −$52
- HOA
- −$0
- Vacancy / Maint / Mgmt
- −$372
- Net cashflow
- $631
Break-even live
Sensitivity live
| Price | -10% $702 | -5% $666 | +0% $631 | +5% $596 | +10% $560 |
|---|---|---|---|---|---|
| Rent | -10% $491 | -5% $561 | +0% $631 | +5% $701 | +10% $771 |
| Rate | -1.0pp $694 | -0.5pp $663 | base $631 | +0.5pp $599 | +1.0pp $566 |
2-unit breakdown (identical units grouped — click to expand)
| Units | Beds | Baths | Est. rent |
|---|---|---|---|
| 2× units | 2 | 1 | $1,774 |
| #1 | 2 | 1 | $887 |
| #2 | 2 | 1 | $887 |
| Total (2 units) | $1,773 | ||
UW: 25.0% down · 7.5% · 30yr · 1.5% tax · 5.0% vac · 8.0% maint · 8.0% mgmt
Financing live
Cash to close
- Down payment
- $31,250
- Closing costs
- $3,750
- Reserves months
- —
- Total cash needed
- —
Loan-product check · same deal, 3 products live
Conventional
25% down · 7.5% · 30yr
- Down + closing
- —
- Monthly P&I
- —
- Monthly cashflow
- —
- DSCR
- —
- Eligible?
- —
Personal DTI + credit; lowest rate.
DSCR
20% down · 8.5% · 30yr
- Down + closing
- —
- Monthly P&I
- —
- Monthly cashflow
- —
- DSCR
- —
- Eligible?
- —
No personal income docs; deal must DSCR.
Hard money
10% down · 12.0% · 12mo
- Down + closing
- —
- Monthly P&I
- —
- Monthly cashflow
- —
- DSCR
- —
- Eligible?
- —
Short-term bridge; refi at stabilization.
Listing history 9 events
-
2026-06-18days on market $125,000 Active 8 DOM
-
2026-06-17days on market $125,000 Active 7 DOM
-
2026-06-16days on market $125,000 Active 6 DOM
-
2026-06-15days on market $125,000 Active 5 DOM
-
2026-06-13days on market $125,000 Active 3 DOM
-
2026-06-12days on market $125,000 Active 2 DOM
-
2026-05-23$125,000 Active
-
2022-02-22soldstatus $40,000
-
2012-02-21$45,000
ⓘ Source: listings_history table (triggers on properties + properties_extension) + one-shot
backfill from property_details.listing_events for pre-trigger history.
Tax reassessment forecast OH · Partial reset (capped growth)
- Current annual tax
- $745 · $62/mo
- Projected year-2 tax
- $1,348 · $112/mo
- Expected delta
- +$602/yr (+$50/mo · 80.8%)
ⓘ Screening estimate from a state-policy table — verify with the county assessor before closing.
Climate risk First Street
- Flood 3/10 Moderate FEMA zone X (unshaded) · 10% chance over 30 yrs
- Wildfire 1/10 Low
- Heat 3/10 Moderate 7 d/yr ≥101°F today · 17 d/yr by 30 yrs out
- Wind 2/10 Low
- Air quality 2/10 Low 1 unhealthy d/yr today · 2 by 30 yrs out
Nearby sold comps map
Loading sold comps map…
Walkable amenities ~0.75 mi
Loading nearby amenities…
Taxation est. · year 1
- Rental income
- $21,276
- − Mortgage interest
- −$7,002
- − Property taxes
- −$745
- − Insurance
- −$625
- − Repairs & maintenance
- −$1,702
- − Management
- −$1,702
- − Depreciation
- −$3,636
- Taxable income
- $5,863
- Est. tax owed @ 24.0%
- −$1,407
- After-tax cash flow
- $6,164/yr
For passive investors: Depreciation is non-cash, so a rental often shows a tax loss while cash-flowing — sheltering income. Rental losses are passive: they offset passive income freely, and up to $25,000/yr can offset ordinary (W-2) income if you actively participate and your MAGI is under $100k (phasing out to $0 by $150k); unused losses carry forward. On sale, claimed depreciation is recaptured at up to 25%, and gains may owe capital-gains tax (a 1031 exchange can defer both). Figures are a year-1 estimate at your 24.0% rate — not tax advice; consult a CPA.
Schools (NCES district)
- District
- Delphos City
- NCES district ID
- 3904388
- Math proficiency
- 77% ▼ -8.00%
- Reading proficiency
- 75% ▼ -8.00%
- Median HH income
- $49,400
- Composite
- 64.3/100
- National rank
- #557
- State rank
- #91 of 656 in OH
Livability — Delphos
- Score
- 72/100
- State rank
- #378
- US rank
- #6142
Category grades
Schools grade is shown separately in the Schools card above.
Census & demographics
- Census place
- Delphos, OH
- County
- Van Wert · 34,605 people
- City population
- 10,822
- Population (ZIP)
- 10,822
- Household income
- $66,919
- Rent vs Own
- Severe rent burden
- 2.2
Population outlook (Allen County) Hauer SSP2
- Today (2025)
- 100,321 people
- By 2030
- 97,693 · -2.6%
- By 2040
- 91,802 · -8.5%
- By 2050
- 86,152 · -14.1%
- By 2075
- 73,659 · -26.6%
- By 2100
- 58,716 · -41.5%
Race, ethnicity, and origin ACS 2023
- Neighborhood character
- Predominantly White (94%)
- Race & ethnicity
- White 94% Two or more races 3% Hispanic / Latino 2% Black 2%
- Common ancestry
- Serbian 2% Lithuanian 2% Iranian 2%
- Foreign-born
- 1% · Canada
- Languages at home
- 98% English-only · German/W. Germanic 1%
Political lean MEDSL · Allen
- 2024 margin
- Solid R (+44.1) · D 27.5% · R 71.6%
- 2008→2024 swing
- -23.4pp toward R · 2008: -20.7pp · 2024: -44.1pp
- All cycles
- 2024: R+44.1 2020: R+39.5 2016: R+38.2 2012: R+25.7 2008: R+20.7
Not yet ingested
- Civics
- —
Market trends
- HPI YoY
- ▼ -39.82%
- Current HPI
- 218.1437
- Rent YoY
- —
- Metro
- —
- State GDP YoY
- ▲ 1.98%
- F500 in state
- 48
Industry mix (Fortune 500 HQ in OH)
| Industry | F500 HQs | Revenue |
|---|---|---|
| Insurance | 3 | $145B |
|
||
| Industrial Machinery | 3 | $49B |
|
||
| Financial Services | 3 | $24B |
|
||
| Consumer Goods | 2 | $93B |
|
||
| Aerospace / Defense | 2 | $47B |
|
||
| Utilities | 2 | $33B |
|
||
Price history
+177.8% since first listed3 events — show timeline
- 2026-05-23 Listed $125,000 WCARE
- 2022-02-22 Sold (Public Records) $40,000 Public Records
- 2012-02-21 Listed $45,000 WCARE
Property tax history
-1.1%/yrLatest (2025): $745 · -1.2% YoY. Source: county tax records.
Cash-flow waterfall
monthlySold comps — $/sqft
last 12 mo · ≤1 miLoading sold comps…