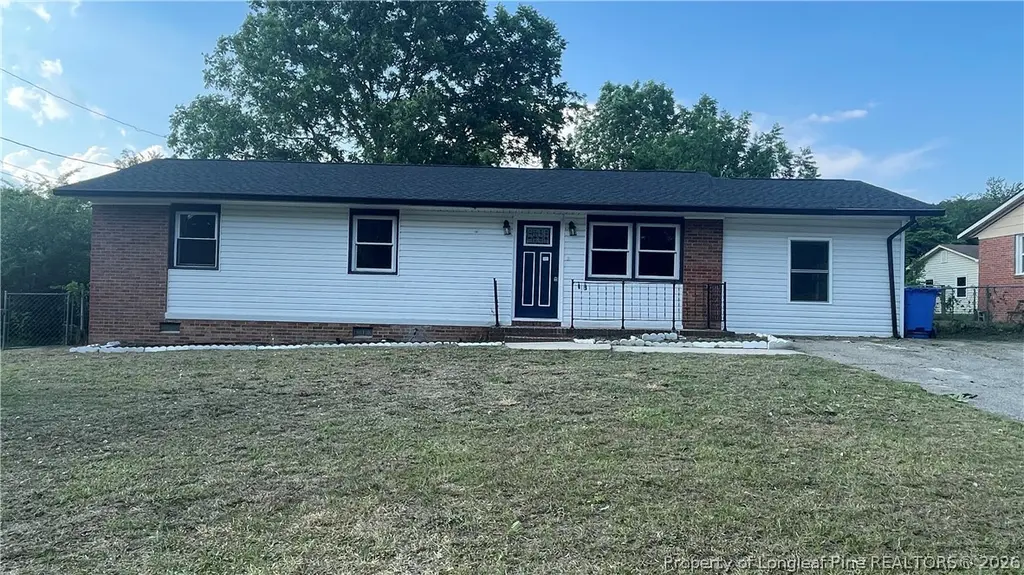
6018 Elstree Pl · Fayetteville, NC
Flood risk 1/10 · Minimal
- FEMA flood zone
- X (unshaded)
- Chance of flooding over 30 yrs
- 0.0%
- Est. flood insurance / yr
- $473 – $860
Fire risk 1/10 · Minimal
- Est. fire insurance / yr
- $906 – $1,684
Heat risk 7/10 · Major
- Hot days now (above 107°F)
- 7 days/yr
- Hot days in 30 yrs
- 16 days/yr
Wind risk 7/10 · Major
- Chance of severe wind over 30 yrs
- 75.0%
Air-quality risk 2/10 · Minimal
- Unhealthy air days now
- 0 days/yr
- Unhealthy air days in 30 yrs
- 1 days/yr
Risk factors via First Street. Map © Google.
Why this score? — see what drove the F grade
The composite is a weighted blend of 9 inputs, each scored 0–100. Each bar is that input's sub-score; the figure is the points it added to the 100-point composite (weight × sub-score).
- Cash flow +8.3/30.0
- Livability +3.8/5.0
- Rent growth +3.3/5.0
- Schools +3.1/10.0
- Condition / age +2.5/5.0
- DSCR +2.3/10.0
- 1% rule +2.1/10.0
- ARV discount +0.0/15.0
- Appreciation +0.0/10.0
$210,000
🖨 Deal sheet 📄 Offer letter ✓ Due diligence
Listing remarks
Welcome to 6018 Elstree Place! Built in 1962, this amazing ranch style home offers 4 bedrooms, 2 bathrooms and over 1600 square feet of living space. Bonus room is the fourth bedroom. Additionally, this home has a nice living room, family room, and a kitchen combo. Other features include a screened in porch, stainless steel appliances, hardwood floors, and a separate laundry room. Great investment opportunity or perfect for a first-time buyer! This beautiful retreat was fully renovated in 2024 and has amazing features. This included the roof, HVAC system, floor, quartz countertops, water heaters and so much more. With all improvements already in place, this property presents an excellent op
Key facts
- 0.26 acre lot
- Built 1962
- Listed 5 days
Property features AI
Exterior
- Parking: No garage
- Utilities: Public water; Public sewer
- Home design: Single family residence; Residential property
- Construction: Brick veneer exterior
- Exterior features: Front covered porch; Porch storage; Shed(s)
Interior
- Kitchen: Dishwasher; Range
- Flooring: Hardwood; Vinyl
- Bathrooms: 2 full bathrooms
- Heating & cooling: Heat pump; Ceiling fan(s) for cooling; Electric cooling
- Interior features: Ceiling fans; Eat-in kitchen; Crawl space basement
- Laundry & utility: Washer hookup
Neighborhood map
What this means for you Summary
Snapshot
- This is a 3-bed/1.0-bath single-family listed at $210k.
Deal economics
- At list price, monthly cash flow is $-192 ($-2k/yr) — negative.
- To cash-flow at today's rent, offer at most $176k (16.2% below list).
- To meet the 1% rule (rent ≥ 1% of price), the offer needs to be $148k (29.4% below list).
- Recommended offer: $148k (29.4% below list) — sets the bar for 1% rule.
Location & tenants
- Location reads 75/100 on livability (#45 in NC, #4,031 nationally) — a middle-class / working-renter tenant base. Strengths: commute A+, cost of living A+, housing A+; Watch: crime F, employment D-.
- Cumberland County Schools (urban): math 32% / reading 41% proficiency, ranked #126 of 178 in NC (top 71%) — families likely to look elsewhere, expect single-tenant / working-renter base with shorter leases.
- Zoned schools: Anne Chesnutt Middle (math 22% / reading 42%, grade F, #317 of 475 statewide, top 68%, 443 students, 99% FRL); Westover High (math 42% / reading 39%, grade F, #387 of 535 statewide, top 73%, 1,202 students, 100% FRL) — zoned schools average 100% FRL vs 55% district-wide (45 pts higher); higher-poverty schools than district average — tighter screening recommended.
- Market conditions: Rents rising (+3.1%/yr); 429 active listings in the ZIP; 40 comparable units currently listed for rent nearby; rentals at typical pace (median 21d on market — plan ~3-4 weeks tenant-placement turnaround); 1,125 units permitted in Cumberland County in 2024 (104 in 5+ unit buildings).
Forward outlook
- Local home prices are declining (-3.0%/yr); year-one equity from $1k of loan paydown is wiped out by about $6k of value loss. Plan a longer hold.
Negotiation context
- Only 5 days on market — expect competitive offers; lowballing is unlikely to land.
- 5 sale attempts since 2y ago with the ask held roughly flat each time — persistent listings suggest the price (not the market) is what's stuck; bring a comps-based counter.
- Current owner paid $88k; list at $210k implies a 139% gain — meaningful room to come down on a strong offer.
Risks & watch-outs
- Climate carrying-cost: major wind risk, 75% chance of damaging wind over 30y; extreme-heat days projected 7→16/yr by 2055 (HVAC capex compounding) — expect insurance premiums to compound above CPI over the hold.
Questions for the listing agent
- What do current leases actually rent for vs. the listed asking? Can we see a recent rent roll and the last 12 months of T-12 income?
- Built in 1962 — when were the roof, HVAC, electrical panel, plumbing, and water heater last replaced?
- Is there a deadline driving the sale (1031 exchange, divorce, estate, relocation)? That informs how much negotiation room exists.
- Crime grade is F in this area — have there been break-ins, vandalism, or insurance claims at this property in the last 3 years? What carrier currently insures it and at what premium?
- The area grade is low — what's the realistic commute time and amenity access for the typical tenant pool here? Any planned neighborhood developments (good or bad) we should know about?
- What's the average days-on-market for RENTAL listings here right now (not sales)? A rising rental-DOM trend means longer vacancies and softer asking-rent achievability than the comps imply.
- What's the recent tenant-quality profile in this submarket — average credit score on applications, eviction rate, late-payment / NSF rate, and stable-employment percentage? A property-management company in the area should have these aggregated.
- How much new for-sale + rental construction is in the pipeline within 1–3 miles? Heavy new supply typically softens prices + rents 12–24 months out; constrained supply supports both.
Investment metrics
- 1% rule
- 0.71% ✗
- Cap rate
- 5.19%
- Cash-on-cash
- -3.93%
- DSCR
- 0.83
- GRM
- 11.8
CMA / ARV
- ARV (on-the-fly)
- $169,260
- Comps found
- 12
Show comp detail 12 sales within ~0.75 mi
| Address | Dist | Beds/Ba | Sqft | Sold | Price | $/sf | Match |
|---|---|---|---|---|---|---|---|
| 341 Lynhurst Dr | 0.10mi | 3/2.0 | 1,044 (-4%) | 2mo | $193,000 | $185 | 83 |
| 338 Lansdowne Rd | 0.13mi | 3/1.5 | 1,145 (+5%) | 2mo | $199,500 | $174 | 82 |
| 221 Lansdowne Rd | 0.11mi | 3/2.0 | 1,145 (+5%) | 2mo | $178,000 | $155 | 81 |
| 408 Lynhurst Dr | 0.20mi | 3/2.0 | 1,117 (+2%) | 4mo | $183,500 | $164 | 79 |
| 6018 Dahlgren Ave | 0.07mi | 3/1.0 | 1,073 (-2%) | 18mo | $149,900 | $140 | 79 |
| 6034 Dahlgren Ave | 0.10mi | 3/1.0 | 1,118 (+2%) | 19mo | $100,000 | $89 | 76 |
| 6030 Amstead Ave | 0.30mi | 3/1.0 | 1,050 (-4%) | 10mo | $127,500 | $121 | 71 |
| 425 Lansdowne Rd | 0.23mi | 3/2.0 | 1,051 (-4%) | 12mo | $201,000 | $191 | 69 |
| 6034 Blairmore Pl | 0.23mi | 3/1.0 | 1,050 (-4%) | 22mo | $145,000 | $138 | 65 |
| 5615 Nix Rd | 0.33mi | 3/2.0 | 1,191 (+9%) | 16mo | $235,000 | $197 | 52 |
| 430 Lynhurst Dr | 0.27mi | 3/1.5 | 1,250 (+14%) | 18mo | $185,000 | $148 | 47 |
| 508 Singletary Pl | 0.69mi | 3/2.0 | 1,205 (+10%) | 4mo | $130,000 | $108 | 44 |
Match score weights: distance 35% · size 25% · config 20% · recency 20%. Top-matched comps best support the ARV.
Projected returns pro-forma
-3.0% appreciation · 3.11% rent growth · sell at horizon
- IRR
- -22.8%
- Equity multiple
- 0.22×
- Total profit
- $-46,156
- Equity at exit
- $31,312
- IRR
- -17.0%
- Equity multiple
- 0.06×
- Total profit
- $-55,431
- Equity at exit
- $18,157
Cash invested: $58,800 (down + closing). Projections, not guarantees.
Landlord ↔ Tenant lean methodology
- Overall (STATE)
- 85 Strongly Landlord-Friendly
- State North Carolina
- 85 Strongly Landlord-Friendly · R+3
- County
- — inherits STATE
- City
- — inherits STATE
ZIP-level market 28314
- Home prices YoY
- -15.7%
- Rents YoY
- 3.1%
- Active inventory
- 429
- Price-to-rent
- 11.8×
Monthly cashflow live
- Estimated rent
- $1,482 high interval (Pro) →
- Mortgage (P&I)
- −$1,101
- Tax from tax record
- −$174 /mo · $2,092/yr
- Insurance
- −$88
- HOA
- −$0
- Vacancy / Maint / Mgmt
- −$311
- Net cashflow
- $-192
Break-even live
UW: 25.0% down · 7.5% · 30yr · 1.5% tax · 5.0% vac · 8.0% maint · 8.0% mgmt
Financing live
Cash to close
- Down payment
- $52,500
- Closing costs
- $6,300
- Reserves months
- —
- Total cash needed
- —
Loan-product check · same deal, 3 products live
Conventional
25% down · 7.5% · 30yr
- Down + closing
- —
- Monthly P&I
- —
- Monthly cashflow
- —
- DSCR
- —
- Eligible?
- —
Personal DTI + credit; lowest rate.
DSCR
20% down · 8.5% · 30yr
- Down + closing
- —
- Monthly P&I
- —
- Monthly cashflow
- —
- DSCR
- —
- Eligible?
- —
No personal income docs; deal must DSCR.
Hard money
10% down · 12.0% · 12mo
- Down + closing
- —
- Monthly P&I
- —
- Monthly cashflow
- —
- DSCR
- —
- Eligible?
- —
Short-term bridge; refi at stabilization.
Rent comps 40 comps
| Address | Beds | Baths | Sqft | Rent | $/sqft | DOM | Units | Dist |
|---|---|---|---|---|---|---|---|---|
| 425 Windermere Dr Fayetteville, NC | 2.0 | 1.0 | 900 | $950 | $1.06 | 23d | 1 | 0.24mi |
| 5508 Faith Dr Fayetteville, NC | 1.0–3.0 | 1.5–3.0 | 1106 | $1,439 | $1.30 | 21d | 16 | 0.25mi |
| 5508 Faith Dr Fayetteville, NC | 1.0–3.0 | 1.5–3.0 | 1106 | $1,439 | $1.30 | 13d | 10 | 0.25mi |
| 5591 Bellflower St Fayetteville, NC | 3.0 | 2.0 | 1273 | $1,575 | $1.24 | 13d | 1 | 0.36mi |
| 3330 Harbour Pointe Pl #12 Fayetteville, NC | 3.0 | 2.0 | 1401 | $1,700 | $1.21 | 13d | 1 | 0.47mi |
| 425 Woodstream Trl Fayetteville, NC | 1.0–2.0 | 1.0–1.5 | 810 | $1,330 | $1.64 | 23d | 12 | 0.47mi |
| 5713 Waterwood Dr Fayetteville, NC | 3.0 | 2.0 | 1440 | $1,650 | $1.15 | 21d | 1 | 0.57mi |
| 3374 Starboard Way Fayetteville, NC | 3.0 | 2.5 | 1481 | $2,150 | $1.45 | 13d | 1 | 0.61mi |
| 5761 Waterwood Dr Fayetteville, NC | 3.0 | 2.0 | 1452 | $1,600 | $1.10 | 21d | 1 | 0.65mi |
| 812 Crescent Commons Way Fayetteville, NC | 1.0–2.0 | 1.0–2.0 | 963 | $1,385 | $1.44 | 13d | 10 | 0.67mi |
| 5725 Ivanhoe Ct Fayetteville, NC | 1.0–3.0 | 1.0–2.0 | 962 | $1,300 | $1.35 | 13d | 6 | 0.70mi |
| 349 Waterdown Dr #5 Fayetteville, NC | 3.0 | 2.0 | 1307 | $1,350 | $1.03 | 23d | 1 | 0.71mi |
| 600 Scotia Ln Fayetteville, NC | 1.0–3.0 | 1.0–2.0 | 1070 | $1,380 | $1.29 | 13d | 29 | 0.71mi |
| 3311 Woodhill Ln Fayetteville, NC | 1.0–3.0 | 1.0–2.0 | 1195 | $1,730 | $1.45 | 13d | 42 | 0.73mi |
| 420 Mangum Ct Fayetteville, NC | 3.0 | 2.0 | 1127 | $1,550 | $1.38 | 23d | 1 | 0.83mi |
| 5831 Waters Edge Dr Fayetteville, NC | 3.0 | 2.0 | 1344 | $1,545 | $1.15 | 23d | 1 | 0.84mi |
| 295 Warton Ln Fayetteville, NC | 3.0 | 2.0 | 1307 | $1,325 | $1.01 | 13d | 1 | 0.89mi |
| 3119 Wisteria Ln Unit 102 Fayetteville, NC | 3.0 | 2.0 | 1415 | $1,550 | $1.10 | 13d | 1 | 0.91mi |
| 267 Waterdown Dr Fayetteville, NC | 3.0 | 2.0 | 1307 | $1,325 | $1.01 | 23d | 1 | 0.94mi |
| 5200 Mawood St Fayetteville, NC | 3.0 | 2.0 | 1300 | $1,500 | $1.15 | 13d | 1 | 0.95mi |
| 6309 Lynette Cir Fayetteville, NC | 3.0 | 1.5 | 1014 | $1,300 | $1.28 | 23d | 1 | 0.95mi |
| 5650 Netherfield Pl Fayetteville, NC | 1.0–3.0 | 1.0–2.0 | 1025 | $1,410 | $1.37 | 13d | 38 | 1.00mi |
| 4547 Chambersburg Rd Fayetteville, NC | 3.0 | 1.5 | 1198 | $1,500 | $1.25 | 23d | 1 | 1.00mi |
| 246 Partners Way Fayetteville, NC | 2.0 | 2.0 | 1100 | $1,295 | $1.18 | 23d | 1 | 1.02mi |
| 230 Sawtooth Dr Fayetteville, NC | 1.0–3.0 | 1.0–2.0 | 1040 | $1,550 | $1.49 | 13d | 14 | 1.02mi |
| 4627 Keg Ct Fayetteville, NC | 3.0 | 1.5 | 1272 | $1,300 | $1.02 | 23d | 1 | 1.05mi |
| 6132 Dandy Loop Rd Fayetteville, NC | 3.0 | 1.0 | 1456 | $1,325 | $0.91 | 23d | 1 | 1.10mi |
| 3500 Carlson Bay Ct Fayetteville, NC | 1.0–3.0 | 1.0–2.0 | 850 | $1,350 | $1.59 | 13d | 4 | 1.17mi |
| 513 Lumberly Ln Fayetteville, NC | 2.0 | 2.0 | 1124 | $1,295 | $1.15 | 23d | 1 | 1.18mi |
| 855 King Arthur Dr Fayetteville, NC | 1.0–2.0 | 1.0–2.0 | 810 | $1,182 | $1.46 | 13d | 9 | 1.20mi |
| 609 Ashbrook Ct Fayetteville, NC | 2.0 | 1.5 | 997 | $1,049 | $1.05 | 23d | 1 | 1.22mi |
| 600 Ashbrook Ct Fayetteville, NC | 2.0–3.0 | 1.5 | 1050 | $1,299 | $1.24 | 21d | 6 | 1.23mi |
| 613 Ashbrook Ct Fayetteville, NC | 3.0 | 1.5 | 1103 | $1,299 | $1.18 | 23d | 1 | 1.25mi |
| 409 Tradewinds Dr Fayetteville, NC | 1.0–2.0 | 1.0–2.0 | 867 | $1,195 | $1.38 | 13d | 16 | 1.27mi |
| 202 Bertram Pl Fayetteville, NC | 3.0 | 2.0 | 1175 | $1,300 | $1.11 | 13d | 1 | 1.28mi |
| 7298 Ryan St Fayetteville, NC | 4.0 | 1.5 | 1315 | $1,400 | $1.06 | 23d | 1 | 1.31mi |
| 7252 Ainsley St Fayetteville, NC | 3.0 | 1.0 | 1265 | $1,299 | $1.03 | 23d | 1 | 1.34mi |
| 495 Stiles Pl Fayetteville, NC | 3.0 | 2.0 | 1300 | $1,250 | $0.96 | 13d | 1 | 1.35mi |
| 679 Bartons Landing Pl Fayetteville, NC | 2.0 | 2.0 | 1145 | $1,150 | $1.00 | 23d | 1 | 1.38mi |
| 679 Bartons Landing Pl Unit 6 Fayetteville, NC | 2.0 | 2.0 | 1145 | $1,200 | $1.05 | 23d | 1 | 1.38mi |
Listing history 6 events
-
2026-06-18days on market $210,000 Active 5 DOM
-
2026-06-17days on market $210,000 Active 4 DOM
-
2026-06-16days on market $210,000 Active 3 DOM
-
2026-06-15days on market $210,000 Active 2 DOM
-
2026-06-14remarks 699-char remark
-
2026-06-14$210,000 Active 1 DOM
ⓘ Source: listings_history table (triggers on properties + properties_extension) + one-shot
backfill from property_details.listing_events for pre-trigger history.
Tax reassessment forecast NC · Resets to sale price
- Current annual tax
- $2,092 · $174/mo
- Projected year-2 tax
- $2,092 · $174/mo
- Expected delta
- $0/yr ($0/mo · 0.0%)
ⓘ Screening estimate from a state-policy table — verify with the county assessor before closing.
Climate risk First Street
- Flood 1/10 Low FEMA zone X (unshaded) · 0% chance over 30 yrs
- Wildfire 1/10 Low
- Heat 7/10 Severe 7 d/yr ≥107°F today · 16 d/yr by 30 yrs out
- Wind 7/10 Severe 75% chance of damaging wind over 30 yrs
- Air quality 2/10 Low 0 unhealthy d/yr today · 1 by 30 yrs out
Nearby sold comps map
Loading sold comps map…
Walkable amenities ~0.75 mi
Loading nearby amenities…
Taxation est. · year 1
- Rental income
- $17,781
- − Mortgage interest
- −$11,763
- − Property taxes
- −$2,092
- − Insurance
- −$1,050
- − Repairs & maintenance
- −$1,423
- − Management
- −$1,423
- − Depreciation
- −$6,109
- Taxable loss
- −$6,078
- Est. tax savings @ 24.0%
- +$1,459
- After-tax cash flow
- $-851/yr
For passive investors: Depreciation is non-cash, so a rental often shows a tax loss while cash-flowing — sheltering income. Rental losses are passive: they offset passive income freely, and up to $25,000/yr can offset ordinary (W-2) income if you actively participate and your MAGI is under $100k (phasing out to $0 by $150k); unused losses carry forward. On sale, claimed depreciation is recaptured at up to 25%, and gains may owe capital-gains tax (a 1031 exchange can defer both). Figures are a year-1 estimate at your 24.0% rate — not tax advice; consult a CPA.
Schools (NCES district)
- District
- Cumberland County Schools
- NCES district ID
- 3700011
- Math proficiency
- 32% ▼ -2.00%
- Reading proficiency
- 41% ▼ -1.00%
- Median HH income
- $44,168
- Composite
- 31.0/100
- National rank
- #6096
- State rank
- #126 of 178 in NC
Livability — Fayetteville
- Score
- 75/100
- State rank
- #45
- US rank
- #4031
Category grades
Schools grade is shown separately in the Schools card above.
Census & demographics
- Census place
- Fayetteville, NC
- County
- Cumberland County · 265,314 people
- City population
- 226,118
- Metro
- Fayetteville, NC
- Population (ZIP)
- 55,834
- Household income
- $62,249
- Rent vs Own
- Severe rent burden
- 2511.0
Population outlook (Cumberland County) Hauer SSP2
- Today (2025)
- 330,855 people
- By 2030
- 333,523 · +0.8%
- By 2040
- 335,583 · +1.4%
- By 2050
- 335,325 · +1.4%
- By 2075
- 342,853 · +3.6%
- By 2100
- 340,698 · +3.0%
Race, ethnicity, and origin ACS 2023
- Neighborhood character
- Diverse neighborhood (Simpson 0.67)
- Race & ethnicity
- Black 49% White 25% Hispanic / Latino 16% Two or more races 11% Asian 3%
- Hispanic origin (detail)
- Mexican 5% Puerto Rican 6% Dominican 1%
- Common ancestry
- Slovak 1% Romanian 1% Lithuanian 1%
- Foreign-born
- 9% · Canada, South Korea
- Languages at home
- 84% English-only · Spanish 10% Korean 1% Other Asian/Pacific 1%
Political lean MEDSL · Cumberland
- 2024 margin
- D (+13.4) · D 56.1% · R 42.7% · Other 1.2%
- 2008→2024 swing
- -4.3pp toward R · 2008: 17.7pp · 2024: 13.4pp
- All cycles
- 2024: D+13.4 2020: D+16.6 2016: D+16.0 2012: D+19.7 2008: D+17.7
Not yet ingested
- Civics
- —
Market trends
- HPI YoY
- ▼ -43.20%
- Current HPI
- 231.873
- Rent YoY
- ▲ 3.11%
- Metro
- Fayetteville, NC
- State GDP YoY
- ▲ 3.28%
- F500 in state
- 26
Industry mix (Fortune 500 HQ in NC)
| Industry | F500 HQs | Revenue |
|---|---|---|
| Financial Services | 2 | $213B |
|
||
| Retail | 2 | $95B |
|
||
| Industrial Conglomerate | 1 | $38B |
|
||
| Metals / Steel | 1 | $35B |
|
||
| Utilities | 1 | $30B |
|
||
| Industrial Machinery | 1 | $19B |
|
||
Price history
+138.6% since first listed14 events — show timeline
- 2026-06-12 Listed $210,000 LPRMLS
- 2026-04-25 Price Changed $225,000 LPRMLS
- 2026-04-16 Price Changed $229,000 LPRMLS
- 2026-04-08 Price Changed $234,800 LPRMLS
- 2026-03-28 Listed $234,900 LPRMLS
- 2025-06-20 Price Changed $251,999 LPRMLS
- 2025-06-02 Price Changed $256,999 LPRMLS
- 2025-05-22 Listed $261,999 LPRMLS
- 2024-08-29 Rental Removed $1,650 TMLS
- 2024-08-19 Listed for Rent $1,650 TMLS
- 2024-07-10 Price Changed $257,777 LPRMLS
- 2024-06-19 Price Changed $262,777 LPRMLS
- 2024-06-16 Listed $267,777 LPRMLS
- 2012-07-13 Sold (Public Records) $88,000 Public Records
Property tax history
+5.2%/yrLatest (2025): $2,092 · +41.5% YoY. Source: county tax records.
Cash-flow waterfall
monthlySold comps — $/sqft
last 12 mo · ≤1 miLoading sold comps…