22899 Byron Rd #69 · Crestline, CA
Flood risk 4/10 · Minor
- FEMA flood zone
- A
- Chance of flooding over 30 yrs
- 0.21%
- Est. flood insurance / yr
- $1,009 – $1,996
Fire risk 8/10 · Major
- Est. fire insurance / yr
- $659 – $1,223
Heat risk 4/10 · Minor
- Hot days now (above 89°F)
- 3 days/yr
- Hot days in 30 yrs
- 8 days/yr
Wind risk 1/10 · Minimal
- Chance of severe wind over 30 yrs
- —
Air-quality risk 10/10 · Severe
- Unhealthy air days now
- 31 days/yr
- Unhealthy air days in 30 yrs
- 41 days/yr
Risk factors via First Street. Map © Google.
Why this score? — see what drove the C+ grade
The composite is a weighted blend of 9 inputs, each scored 0–100. Each bar is that input's sub-score; the figure is the points it added to the 100-point composite (weight × sub-score).
- Cash flow +27.9/30.0
- DSCR +9.9/10.0
- 1% rule +7.6/10.0
- ARV discount +7.5/15.0
- Rent growth +3.7/5.0
- Livability +2.8/5.0
- Condition / age +2.5/5.0
- Schools +2.1/10.0
- Appreciation +0.0/10.0
$168,900
🖨 Deal sheet 📄 Offer letter ✓ Due diligence
Listing remarks MLS
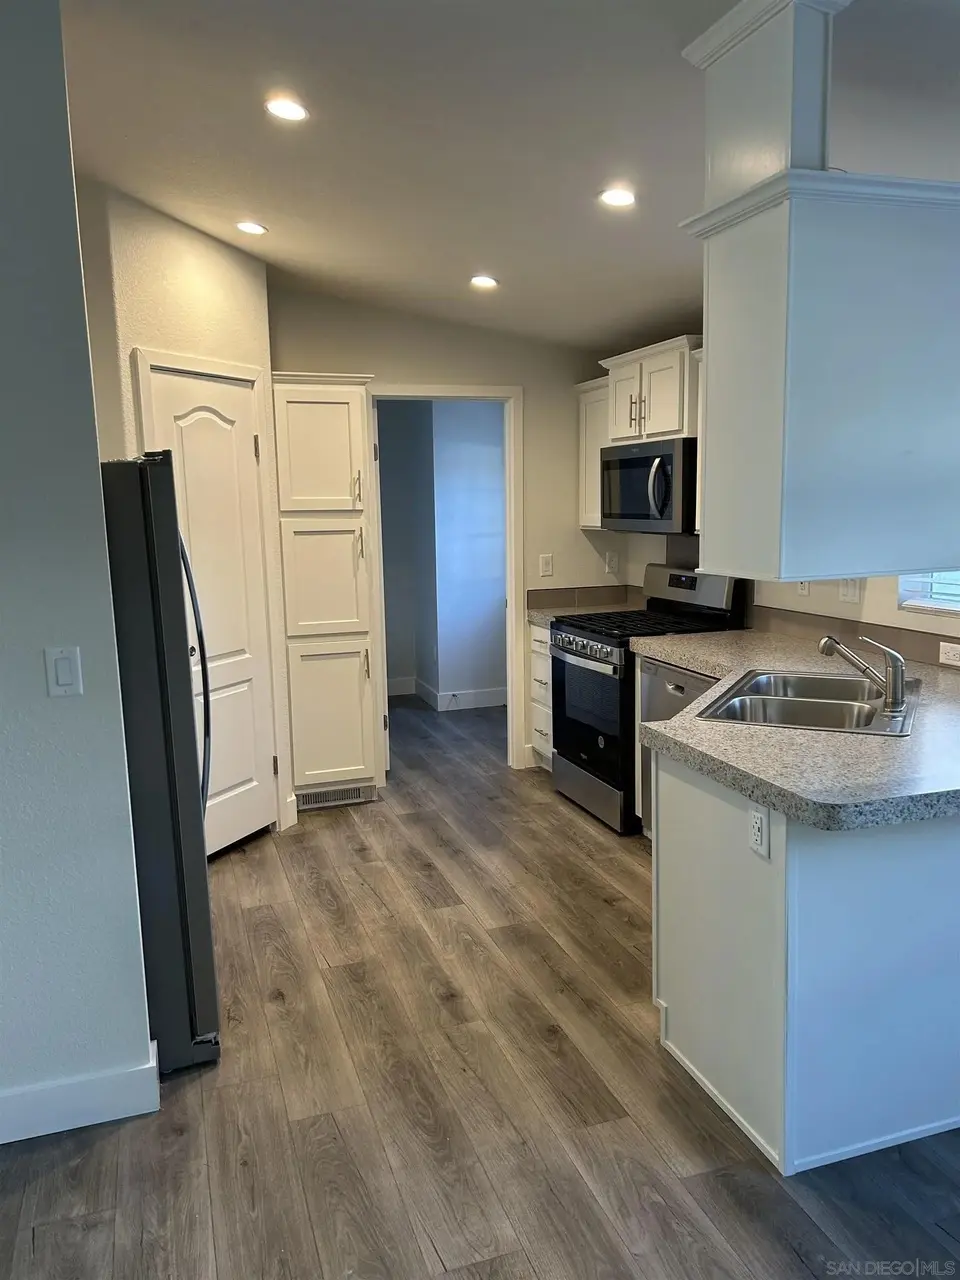
Open 3 bedroom and 2 bath home with a family room and open kitchen. Home faces the beautiful creek that runs across the park. You get to hear the sounds of peaceful crickets and frogs. Guest parking right in front of the home and a carport on the right side of the home, along with a shed for storage.
Key facts
- Durable construction
- Spacious kitchen
- Brand-new appliances
Tags
Property features AI
Finance
- Other: Located in the Valley of Enchantment community (Crestline)
Exterior
- Parking: 2 parking spaces
- Utilities: Sewer connected
- Home design: Manufactured home; Single-story
- Construction: Cement siding
- Exterior features: Composition roof; Pets allowed with breed restrictions
Interior
- Kitchen: Dishwasher; Gas Range; Refrigerator; Garbage disposal
- Bedrooms: Up to 4 possible bedrooms
- Bathrooms: 2 full bathrooms
- Interior features: Dishwasher; Disposal; Refrigerator; Gas Range; Forced air heating (natural gas)
Neighborhood map
What this means for you Summary
Snapshot
- This is a 3-bed/2.0-bath manufactured listed at $169k.
Deal economics
- At list price, monthly cash flow is $394 ($5k/yr) — positive.
- The deal already cash-flows at list — no discount required.
- Meets the 1% rule at list price ($2k rent vs $169k).
- Recommended offer: $166k (1.5% below list) — sets the bar for market timing.
- Cap rate 10.0% vs local median 3.9% in Crestline — top-decile yield for the area; either an underpriced asset or a hidden risk that comps aren't pricing in. Stress-test before assuming the spread holds.
Location & tenants
- Location reads 56/100 on livability (#805 in CA) — a working-class tenant base; expect higher turnover. Strengths: housing A+; Watch: commute D, schools D-, crime F.
- Rim Of The World Unified (town): math 13% / reading 34% proficiency, ranked #415 of 517 in CA (top 80%) — low school quality limits family demand, transient renter base, plan for 1-2y turnover.
- Market conditions: Rents rising fast (+4.7%/yr); 252 active listings in the ZIP; 6 comparable units currently listed for rent nearby; rentals at typical pace (median 18d on market — plan ~3-4 weeks tenant-placement turnaround); 5,458 units permitted in San Bernardino County in 2024 (1,500 in 5+ unit buildings).
- This rent runs 36% of the median local income ($71k/yr) — at the standard rent-burdened threshold; future hikes will face affordability resistance.
Forward outlook
- Local home prices are declining (-3.0%/yr); year-one equity from $1k of loan paydown is wiped out by about $5k of value loss. Plan a longer hold.
- San Bernardino County population projected at +15% by 2050 — modest demand growth; plan on rents tracking national, not racing it.
- At projected returns (-3.0% appreciation + 4.7% rent growth), your $47k cash investment doubles in ~9 years — after that, you're playing with house money.
Negotiation context
- It's been on market 20 days — a 2% lower offer ($166k) is reasonable based on typical stale-listing flexibility.
- 8 sale attempts since 18y ago with the ask held roughly flat each time — persistent listings suggest the price (not the market) is what's stuck; bring a comps-based counter.
- Current owner paid $13k; list at $169k implies a 1199% gain — meaningful room to come down on a strong offer.
Risks & watch-outs
- Watch-outs: flood insurance adds $125/mo.
- Climate carrying-cost: in FEMA flood zone A (mandatory federal flood insurance); severe wildfire risk — expect insurance premiums to compound above CPI over the hold.
Questions for the listing agent
- What's the actual annual flood-insurance premium (NFIP or private), and is the property in a SFHA with mandatory coverage?
- Is there a deadline driving the sale (1031 exchange, divorce, estate, relocation)? That informs how much negotiation room exists.
- Schools are D-rated, which usually means shorter tenancies and higher turnover. Who's the typical renter profile here, and what's been the actual vacancy rate?
- Crime grade is F in this area — have there been break-ins, vandalism, or insurance claims at this property in the last 3 years? What carrier currently insures it and at what premium?
- What's the average days-on-market for RENTAL listings here right now (not sales)? A rising rental-DOM trend means longer vacancies and softer asking-rent achievability than the comps imply.
- What's the recent tenant-quality profile in this submarket — average credit score on applications, eviction rate, late-payment / NSF rate, and stable-employment percentage? A property-management company in the area should have these aggregated.
- How much new for-sale + rental construction is in the pipeline within 1–3 miles? Heavy new supply typically softens prices + rents 12–24 months out; constrained supply supports both.
Investment metrics
- 1% rule
- 1.26% ✓
- Cap rate
- 9.98%
- Cash-on-cash
- 13.19%
- DSCR
- 1.59
- GRM
- 6.6
CMA / ARV
- ARV (on-the-fly)
- $94,872
- Comps found
- 3
Show comp detail 3 sales within ~0.75 mi
| Address | Dist | Beds/Ba | Sqft | Sold | Price | $/sf | Match |
|---|---|---|---|---|---|---|---|
| 22899 Byron Rd #41 | 0.00mi | 3/2.0 | 1,440 (+2%) | 2mo | $44,000 | $31 | 95 |
| 22899 BYRON Rd #58 | 0.18mi | 3/2.0 | 1,440 (+2%) | 9mo | $129,000 | $90 | 81 |
| 22899 Byron Rd #65 | 0.00mi | 2/2.0 (-1) | 1,344 (-5%) | 21mo | $90,000 | $67 | 69 |
Match score weights: distance 35% · size 25% · config 20% · recency 20%. Top-matched comps best support the ARV.
Projected returns pro-forma
-3.0% appreciation · 4.65% rent growth · sell at horizon
- IRR
- 0.8%
- Equity multiple
- 1.03×
- Total profit
- $1,464
- Equity at exit
- $25,184
- IRR
- 12.2%
- Equity multiple
- 2.04×
- Total profit
- $49,358
- Equity at exit
- $14,603
Cash invested: $47,292 (down + closing). Projections, not guarantees.
Landlord ↔ Tenant lean methodology
- Overall (STATE)
- 18 Strongly Tenant-Friendly
- State California
- 18 Strongly Tenant-Friendly · D+13
- County
- — inherits STATE
- City
- — inherits STATE
ZIP-level market 92325
- Rents YoY
- 4.7%
- Active inventory
- 252
- Price-to-rent
- 6.6×
Monthly cashflow live
- Estimated rent
- $2,135 high interval (Pro) →
- Mortgage (P&I)
- −$886
- Tax est. 1.5%
- −$211 /mo · $2,534/yr
- Insurance
- −$70
- Flood insurance flood zone
- −$125 /mo · $1,502/yr
- HOA
- −$0
- Vacancy / Maint / Mgmt
- −$448
- Net cashflow
- $394
Break-even live
UW: 25.0% down · 7.5% · 30yr · 1.5% tax · 5.0% vac · 8.0% maint · 8.0% mgmt
Financing live
Cash to close
- Down payment
- $42,225
- Closing costs
- $5,067
- Reserves months
- —
- Total cash needed
- —
Loan-product check · same deal, 3 products live
Conventional
25% down · 7.5% · 30yr
- Down + closing
- —
- Monthly P&I
- —
- Monthly cashflow
- —
- DSCR
- —
- Eligible?
- —
Personal DTI + credit; lowest rate.
DSCR
20% down · 8.5% · 30yr
- Down + closing
- —
- Monthly P&I
- —
- Monthly cashflow
- —
- DSCR
- —
- Eligible?
- —
No personal income docs; deal must DSCR.
Hard money
10% down · 12.0% · 12mo
- Down + closing
- —
- Monthly P&I
- —
- Monthly cashflow
- —
- DSCR
- —
- Eligible?
- —
Short-term bridge; refi at stabilization.
Rent comps 6 comps
| Address | Beds | Baths | Sqft | Rent | $/sqft | DOM | Units | Dist |
|---|---|---|---|---|---|---|---|---|
| 22858 Lupin Ln Cedarpines Park, CA | 3.0 | 2.0 | 1176 | $2,000 | $1.70 | 1d | 1 | 0.24mi |
| 767 Woodland Rd Unit 1 Crestline, CA | 2.0 | 1.0 | 1100 | $1,700 | $1.55 | 2d | 1 | 1.00mi |
| 21510 Crest Forest Dr Cedarpines Park, CA | 3.0 | 2.5 | 1824 | $2,350 | $1.29 | 1d | 1 | 1.02mi |
| 794 Woodland Rd Crestline, CA | 3.0 | 2.0 | 1372 | $1,400 | $1.02 | 17d | 1 | 1.08mi |
| 23855 Zuger Dr Unit B Crestline, CA | 3.0 | 1.0 | 1300 | $1,995 | $1.53 | 19d | 1 | 1.40mi |
| 23882 Springwater Rd Crestline, CA | 3.0 | 1.0 | 1133 | $2,500 | $2.21 | 19d | 1 | 1.46mi |
Listing history 14 events
-
2026-06-18days on market $168,900 Active 20 DOM
-
2026-06-17days on market $168,900 Active 19 DOM
-
2026-06-16days on market $168,900 Active 18 DOM
-
2026-06-15days on market $168,900 Active 17 DOM
-
2026-06-13days on market $168,900 Active 15 DOM
-
2026-06-13days on market $168,900 Active 14 DOM
-
2026-06-09days on market $168,900 Active 11 DOM
-
2026-06-08days on market $168,900 Active 10 DOM
-
2026-06-07days on market $168,900 Active 9 DOM
-
2026-06-04days on market $168,900 Active 6 DOM
-
2026-06-03days on market $168,900 Active 5 DOM
-
2026-06-02days on market $168,900 Active 4 DOM
-
2026-06-01days on market $168,900 Active 3 DOM
-
2026-05-31days on market $168,900 Active 2 DOM
ⓘ Source: listings_history table (triggers on properties + properties_extension) + one-shot
backfill from property_details.listing_events for pre-trigger history.
Climate risk First Street
- Flood 4/10 Moderate FEMA zone A · 21% chance over 30 yrs
- Wildfire 8/10 Severe
- Heat 4/10 Moderate 3 d/yr ≥89°F today · 8 d/yr by 30 yrs out
- Wind 1/10 Low
- Air quality 10/10 Extreme 31 unhealthy d/yr today · 41 by 30 yrs out
Nearby sold comps map
Loading sold comps map…
Walkable amenities ~0.75 mi
Loading nearby amenities…
Taxation est. · year 1
- Rental income
- $25,623
- − Mortgage interest
- −$9,461
- − Property taxes
- −$2,534
- − Insurance
- −$2,347
- − Repairs & maintenance
- −$2,050
- − Management
- −$2,050
- − Depreciation
- −$4,913
- Taxable income
- $2,269
- Est. tax owed @ 24.0%
- −$544
- After-tax cash flow
- $4,189/yr
For passive investors: Depreciation is non-cash, so a rental often shows a tax loss while cash-flowing — sheltering income. Rental losses are passive: they offset passive income freely, and up to $25,000/yr can offset ordinary (W-2) income if you actively participate and your MAGI is under $100k (phasing out to $0 by $150k); unused losses carry forward. On sale, claimed depreciation is recaptured at up to 25%, and gains may owe capital-gains tax (a 1031 exchange can defer both). Figures are a year-1 estimate at your 24.0% rate — not tax advice; consult a CPA.
Schools (NCES district)
- District
- Rim Of The World Unified
- NCES district ID
- 0632610
- Math proficiency
- 13% ▼ -10.00%
- Reading proficiency
- 34% ▼ -7.00%
- Median HH income
- $55,860
- Composite
- 21.29/100
- National rank
- #8389
- State rank
- #415 of 517 in CA
Livability — Crestline
- Score
- 56/100
- State rank
- #805
- US rank
- #22821
Category grades
Schools grade is shown separately in the Schools card above.
Census & demographics
- Census place
- Crestline, CA
- County
- San Bernardino County · 2,030,291 people
- City population
- 9,065
- Metro
- Riverside-San Bernardino-Ontario, CA
- Population (ZIP)
- 9,065
- Household income
- $70,563
- Rent vs Own
- Severe rent burden
- 179.0
Population outlook (San Bernardino County) Hauer SSP2
- Today (2025)
- 2,300,329 people
- By 2030
- 2,378,907 · +3.4%
- By 2040
- 2,523,137 · +9.7%
- By 2050
- 2,642,388 · +14.9%
- By 2075
- 2,880,769 · +25.2%
- By 2100
- 2,909,436 · +26.5%
Race, ethnicity, and origin ACS 2023
- Neighborhood character
- Predominantly White (68%)
- Race & ethnicity
- White 68% Hispanic / Latino 25% Two or more races 20% Black 2%
- Hispanic origin (detail)
- Mexican 21%
- Common ancestry
- Romanian 5% Slovak 5% Lithuanian 4%
- Foreign-born
- 9% · Canada
- Languages at home
- 85% English-only · Spanish 12% Russian/Polish/Slavic 3% German/W. Germanic 1%
Political lean MEDSL · San Bernardino
- 2024 margin
- Toss-up / Even · D 47.5% · R 49.7% · Other 2.8%
- 2008→2024 swing
- -8.5pp toward R · 2008: 6.3pp · 2024: -2.1pp
- All cycles
- 2024: R+2.1 2020: D+10.7 2016: D+9.8 2012: D+5.4 2008: D+6.3
Not yet ingested
- Civics
- —
Market trends
- HPI YoY
- ▼ -255.88%
- Current HPI
- 352.6512
- Rent YoY
- ▲ 4.65%
- Metro
- Riverside-San Bernardino-Ontario, CA
- State GDP YoY
- ▲ 3.21%
- F500 in state
- 116
Industry mix (Fortune 500 HQ in CA)
| Industry | F500 HQs | Revenue |
|---|---|---|
| Technology | 27 | $1,492B |
|
||
| Financial Services | 3 | $174B |
|
||
| Retail | 3 | $44B |
|
||
| Insurance | 3 | $26B |
|
||
| Media / Entertainment | 2 | $115B |
|
||
| Pharmaceuticals / Biotech | 2 | $62B |
|
||
Price history
+275.3% since first listed22 events — show timeline
- 2026-05-29 Listed $168,900 SDMLS
- 2025-12-10 Listing Removed — SDMLS
- 2025-09-12 Price Changed $194,900 SDMLS
- 2025-02-08 Price Changed $214,900 SDMLS
- 2025-01-22 Listed $209,000 SDMLS
- 2013-06-03 Sold (MLS) $13,000 CRMLS
- 2013-05-30 Pending — CRMLS
- 2013-05-10 Price Changed $15,000 CRMLS
- 2013-03-20 Price Changed $18,000 CRMLS
- 2012-11-20 Price Changed $20,000 CRMLS
- 2012-09-17 Price Changed $23,000 CRMLS
- 2012-09-17 Relisted — CRMLS
- 2012-05-25 Listing Removed — CRMLS
- 2011-12-31 Listed $25,000 CRMLS
- 2011-12-17 Listing Removed — CRMLS
- 2011-12-17 Relisted — CRMLS
- 2011-06-07 Delisted — CRMLS
- 2011-03-08 Listed $25,000 CRMLS
- 2010-01-05 Listing Removed — CRMLS
- 2009-08-20 Listed $35,000 CRMLS
- 2009-02-10 Listing Removed — CRMLS
- 2008-05-13 Listed $45,000 CRMLS
Property tax history
+0.3%/yrLatest (2025): $141 · +3.4% YoY. Source: county tax records.
Cash-flow waterfall
monthlySold comps — $/sqft
last 12 mo · ≤1 miLoading sold comps…