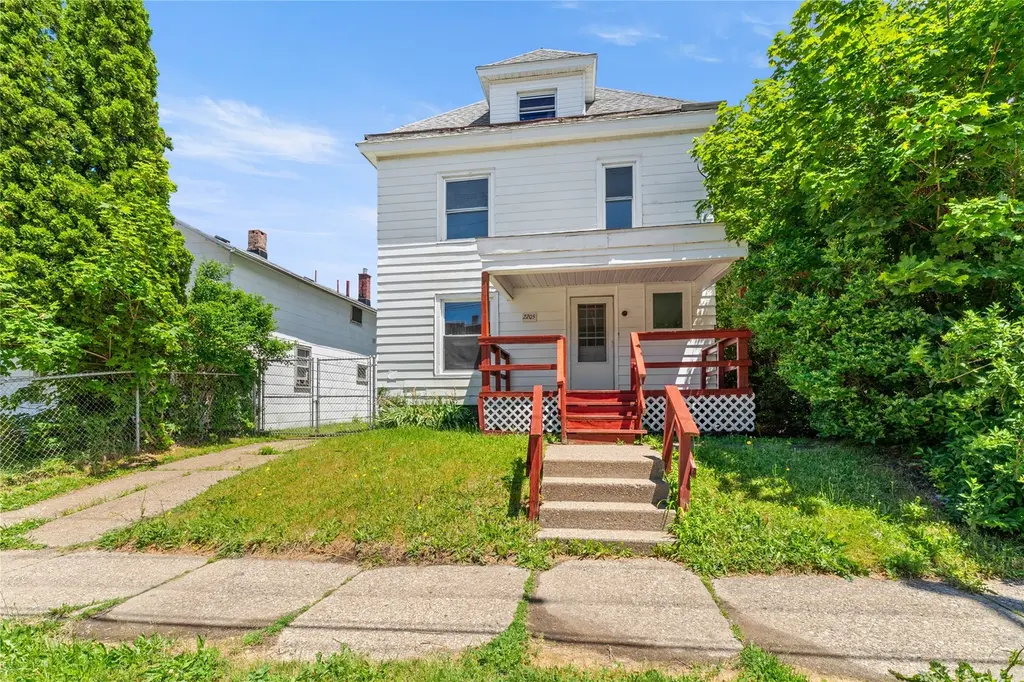
2205 Wayne St · Erie, PA
Flood risk 1/10 · Minimal
- FEMA flood zone
- X (unshaded)
- Chance of flooding over 30 yrs
- 0.0%
- Est. flood insurance / yr
- $473 – $860
Fire risk 1/10 · Minimal
- Est. fire insurance / yr
- $511 – $949
Heat risk 2/10 · Minimal
- Hot days now (above 90°F)
- 7 days/yr
- Hot days in 30 yrs
- 17 days/yr
Wind risk 1/10 · Minimal
- Chance of severe wind over 30 yrs
- —
Air-quality risk 2/10 · Minimal
- Unhealthy air days now
- 1 days/yr
- Unhealthy air days in 30 yrs
- 3 days/yr
Risk factors via First Street. Map © Google.
Why this score? — see what drove the B+ grade
The composite is a weighted blend of 9 inputs, each scored 0–100. Each bar is that input's sub-score; the figure is the points it added to the 100-point composite (weight × sub-score).
- Cash flow +26.7/30.0
- ARV discount +15.0/15.0
- DSCR +9.2/10.0
- Appreciation +7.9/10.0
- 1% rule +7.5/10.0
- Livability +4.2/5.0
- Rent growth +2.5/5.0
- Condition / age +2.5/5.0
- Schools +1.3/10.0
$89,000
🖨 Deal sheet 📄 Offer letter ✓ Due diligence
Listing remarks
This 3-bedroom, 1-bath single-family home featuring fresh paint throughout and new carpet on the second floor. This move-in-ready property offers comfortable living spaces, spacious bedrooms, and a functional layout.
Key facts
- 4,800 sq ft lot
- Garage
- Built 1907
Property features AI
Exterior
- Parking: 1-car garage
- Utilities: Public water; Public sewer
- Home design: Single-family residence; Two stories
- Construction: Aluminum siding; Composition roof
- Exterior features: Level lot; Lot dimensions approximately 38 x 123
Interior
- Flooring: Carpet; Hardwood; Vinyl
- Bathrooms: 1 full bathroom
- Heating & cooling: Hot water heating
- Interior features: Carpet, Hardwood, and Vinyl flooring; Unfinished basement; 7 total rooms
Neighborhood map
What this means for you Summary
Snapshot
- This is a 3-bed/1.0-bath single-family listed at $89k.
Deal economics
- At list price, monthly cash flow is $242 ($3k/yr) — positive.
- The deal already cash-flows at list — no discount required.
- Meets the 1% rule at list price ($1k rent vs $89k).
- Cap rate 9.6% vs local median 5.2% in Erie — top-decile yield for the area; either an underpriced asset or a hidden risk that comps aren't pricing in. Stress-test before assuming the spread holds.
Location & tenants
- Location reads 83/100 on livability (#109 in PA, #840 nationally) — a professional / high-income tenant draw. Strengths: amenities A+, commute A+, cost of living A+; Watch: crime D+, employment F.
- Erie City SD (urban): math 12% / reading 19% proficiency, ranked #510 of 539 in PA (top 95%) — low school quality limits family demand, transient renter base, plan for 1-2y turnover; 81% free/reduced lunch — lower-income household profile, screen leases tightly.
- Market conditions: 47 active listings in the ZIP; 5 comparable units currently listed for rent nearby; rentals lingering (median 44d on market — plan ~5-8 weeks vacancy on turnover, expect pricing pressure); 100% of comp listings sitting > 30 days — soft ceiling on asking rent; 364 units permitted in Erie County in 2024 (188 in 5+ unit buildings).
Forward outlook
- In year one you build about $6k of equity ($615 loan paydown + $5k appreciation (5.7% local appreciation)).
- Erie County population projected at -14% by 2050 — secular population decline; favor cash flow + early exit over multi-decade hold.
- At projected returns (5.7% appreciation + 3.0% rent growth), your $25k cash investment doubles in ~3 years — after that, you're playing with house money.
- By year 6, paydown + projected appreciation supports a ~$31k cash-out refi (75% LTV) — recoverable capital for the next deal without selling this one.
Negotiation context
- Only 6 days on market — expect competitive offers; lowballing is unlikely to land.
- Current owner paid $35k; list at $89k implies a 154% gain — meaningful room to come down on a strong offer.
Risks & watch-outs
- Watch-outs: built in 1907 — expect roof / HVAC / electrical / plumbing capex.
Questions for the listing agent
- Built in 1907 — when were the roof, HVAC, electrical panel, plumbing, and water heater last replaced?
- Is there a deadline driving the sale (1031 exchange, divorce, estate, relocation)? That informs how much negotiation room exists.
- Crime grade is D in this area — have there been break-ins, vandalism, or insurance claims at this property in the last 3 years? What carrier currently insures it and at what premium?
- What's the average days-on-market for RENTAL listings here right now (not sales)? A rising rental-DOM trend means longer vacancies and softer asking-rent achievability than the comps imply.
- What's the recent tenant-quality profile in this submarket — average credit score on applications, eviction rate, late-payment / NSF rate, and stable-employment percentage? A property-management company in the area should have these aggregated.
- How much new for-sale + rental construction is in the pipeline within 1–3 miles? Heavy new supply typically softens prices + rents 12–24 months out; constrained supply supports both.
Investment metrics
- 1% rule
- 1.25% ✓
- Cap rate
- 9.56%
- Cash-on-cash
- 11.65%
- DSCR
- 1.52
- GRM
- 6.7
CMA / ARV
- ARV (on-the-fly)
- $110,592
- Comps found
- 12
Show comp detail 12 sales within ~0.75 mi
| Address | Dist | Beds/Ba | Sqft | Sold | Price | $/sf | Match |
|---|---|---|---|---|---|---|---|
| 2607 Jackson Ave | 0.26mi | 3/1.0 | 1,478 (-4%) | 3mo | $59,000 | $40 | 79 |
| 2712 East Ave | 0.41mi | 4/1.0 (+1) | 1,564 (+2%) | 4mo | $112,500 | $72 | 70 |
| 2521 Wayne St | 0.22mi | 3/1.0 | 1,360 (-12%) | 4mo | $80,000 | $59 | 67 |
| 1224 E 22nd St | 0.57mi | 3/1.5 | 1,584 (+3%) | 1mo | $120,000 | $76 | 66 |
| 1156 E 30th St | 0.69mi | 4/1.0 (+1) | 1,540 (+0%) | 0mo | $174,900 | $114 | 62 |
| 1038 E 24th St | 0.34mi | 4/1.0 (+1) | 1,352 (-12%) | 2mo | $139,900 | $103 | 58 |
| 1316 Buffalo Rd | 0.69mi | 4/1.5 (+1) | 1,470 (-4%) | 3mo | $149,900 | $102 | 52 |
| 239 E 25th St | 0.75mi | 3/1.0 | 1,404 (-9%) | 1mo | $77,500 | $55 | 50 |
| 1203 E 29th St | 0.69mi | 3/2.5 | 1,450 (-6%) | 3mo | $30,000 | $21 | 50 |
| 3025 Pine Ave | 0.68mi | 3/2.0 | 1,674 (+9%) | 4mo | $105,000 | $63 | 46 |
| 633 E 11th St | 0.74mi | 3/1.0 | 1,347 (-12%) | 2mo | $60,000 | $45 | 43 |
| 953 E 33rd St | 0.73mi | 2/1.0 (-1) | 1,333 (-13%) | 3mo | $99,500 | $75 | 37 |
Match score weights: distance 35% · size 25% · config 20% · recency 20%. Top-matched comps best support the ARV.
Projected returns pro-forma
5.73% appreciation · 3.0% rent growth · sell at horizon
- IRR
- 24.5%
- Equity multiple
- 2.59×
- Total profit
- $39,716
- Equity at exit
- $54,437
- IRR
- 23.3%
- Equity multiple
- 5.22×
- Total profit
- $105,211
- Equity at exit
- $97,441
Cash invested: $24,920 (down + closing). Projections, not guarantees.
Landlord ↔ Tenant lean methodology
- Overall (STATE)
- 62 Landlord-Friendly
- State Pennsylvania
- 62 Landlord-Friendly · EVEN
- County
- — inherits STATE
- City
- — inherits STATE
ZIP-level market 16503
- Home prices YoY
- 4.4%
- Active inventory
- 47
- Price-to-rent
- 6.7×
Monthly cashflow live
- Estimated rent
- $1,110 high interval (Pro) →
- Mortgage (P&I)
- −$467
- Tax from tax record
- −$131 /mo · $1,578/yr
- Insurance
- −$37
- HOA
- −$0
- Vacancy / Maint / Mgmt
- −$233
- Net cashflow
- $242
Break-even live
UW: 25.0% down · 7.5% · 30yr · 1.5% tax · 5.0% vac · 8.0% maint · 8.0% mgmt
Financing live
Cash to close
- Down payment
- $22,250
- Closing costs
- $2,670
- Reserves months
- —
- Total cash needed
- —
Loan-product check · same deal, 3 products live
Conventional
25% down · 7.5% · 30yr
- Down + closing
- —
- Monthly P&I
- —
- Monthly cashflow
- —
- DSCR
- —
- Eligible?
- —
Personal DTI + credit; lowest rate.
DSCR
20% down · 8.5% · 30yr
- Down + closing
- —
- Monthly P&I
- —
- Monthly cashflow
- —
- DSCR
- —
- Eligible?
- —
No personal income docs; deal must DSCR.
Hard money
10% down · 12.0% · 12mo
- Down + closing
- —
- Monthly P&I
- —
- Monthly cashflow
- —
- DSCR
- —
- Eligible?
- —
Short-term bridge; refi at stabilization.
Rent comps 5 comps
| Address | Beds | Baths | Sqft | Rent | $/sqft | DOM | Units | Dist |
|---|---|---|---|---|---|---|---|---|
| 614 E 22nd St Unit 1 Erie, PA | 3.0 | 1.0 | 1300 | $1,000 | $0.77 | 44d | 1 | 0.24mi |
| 223 E 9th St Erie, PA | 2.0 | 2.0 | 1564 | $1,300 | $0.83 | 44d | 1 | 1.14mi |
| 622 E 4th St Erie, PA | 3.0 | 1.0 | 1500 | $1,250 | $0.83 | 44d | 1 | 1.26mi |
| 115 W 32nd St Erie, PA | 3.0 | 2.0 | 1844 | $1,050 | $0.57 | 44d | 1 | 1.30mi |
| 100 Erie Insurance Pl Erie, PA | 3.0 | 1.0 | 1120 | $1,425 | $1.27 | 44d | 1 | 1.46mi |
Listing history 7 events
-
2026-06-18status $89,000 Pending 6 DOM
-
2026-06-18days on market $89,000 Active 6 DOM
-
2026-06-17days on market $89,000 Active 5 DOM
-
2026-06-16days on market $89,000 Active 4 DOM
-
2026-06-15days on market $89,000 Active 3 DOM
-
2026-06-13remarks 216-char remark
-
2026-06-13$89,000 Active 1 DOM
ⓘ Source: listings_history table (triggers on properties + properties_extension) + one-shot
backfill from property_details.listing_events for pre-trigger history.
Tax reassessment forecast PA · Partial reset (capped growth)
- Current annual tax
- $1,578 · $131/mo
- Projected year-2 tax
- $1,578 · $131/mo
- Expected delta
- $0/yr ($0/mo · 0.0%)
ⓘ Screening estimate from a state-policy table — verify with the county assessor before closing.
Climate risk First Street
- Flood 1/10 Low FEMA zone X (unshaded) · 0% chance over 30 yrs
- Wildfire 1/10 Low
- Heat 2/10 Low 7 d/yr ≥90°F today · 17 d/yr by 30 yrs out
- Wind 1/10 Low
- Air quality 2/10 Low 1 unhealthy d/yr today · 3 by 30 yrs out
Nearby sold comps map
Loading sold comps map…
Walkable amenities ~0.75 mi
Loading nearby amenities…
Taxation est. · year 1
- Rental income
- $13,325
- − Mortgage interest
- −$4,985
- − Property taxes
- −$1,578
- − Insurance
- −$445
- − Repairs & maintenance
- −$1,066
- − Management
- −$1,066
- − Depreciation
- −$2,589
- Taxable income
- $1,596
- Est. tax owed @ 24.0%
- −$383
- After-tax cash flow
- $2,521/yr
For passive investors: Depreciation is non-cash, so a rental often shows a tax loss while cash-flowing — sheltering income. Rental losses are passive: they offset passive income freely, and up to $25,000/yr can offset ordinary (W-2) income if you actively participate and your MAGI is under $100k (phasing out to $0 by $150k); unused losses carry forward. On sale, claimed depreciation is recaptured at up to 25%, and gains may owe capital-gains tax (a 1031 exchange can defer both). Figures are a year-1 estimate at your 24.0% rate — not tax advice; consult a CPA.
Schools (NCES district)
- District
- Erie City SD
- NCES district ID
- 4209300
- Math proficiency
- 12% ▼ -11.00%
- Reading proficiency
- 19% ▼ -16.00%
- Median HH income
- $33,625
- Composite
- 12.59/100
- National rank
- #9617
- State rank
- #510 of 539 in PA
Livability — Erie
- Score
- 83/100
- State rank
- #109
- US rank
- #840
Category grades
Schools grade is shown separately in the Schools card above.
Census & demographics
- Census place
- Erie, PA
- City population
- 92,215
- Population (ZIP)
- 15,204
Population outlook (Erie County) Hauer SSP2
- Today (2025)
- 272,159 people
- By 2030
- 266,299 · -2.2%
- By 2040
- 250,987 · -7.8%
- By 2050
- 234,925 · -13.7%
- By 2075
- 199,164 · -26.8%
- By 2100
- 162,985 · -40.1%
Race, ethnicity, and origin ACS 2023
- Neighborhood character
- Diverse neighborhood (Simpson 0.65)
- Race & ethnicity
- White 45% Black 37% Hispanic / Latino 10% Two or more races 8% Asian 2%
- Hispanic origin (detail)
- Mexican 2% Puerto Rican 7%
- Common ancestry
- Romanian 6% Scotch-Irish 1% Lithuanian 1%
- Foreign-born
- 6% · India, Canada
- Languages at home
- 90% English-only · Spanish 4% Arabic 2% Other Indo-European 2%
Political lean MEDSL · Erie
- 2024 margin
- Toss-up / Even · D 49.0% · R 50.0%
- 2008→2024 swing
- -20.9pp toward R · 2008: 19.9pp · 2024: -1.0pp
- All cycles
- 2024: R+1.0 2020: D+1.0 2016: R+2.0 2012: D+16.9 2008: D+19.9
Not yet ingested
- Civics
- —
Market trends
- HPI YoY
- ▲ 5.73%
- Current HPI
- 135.5955
- Rent YoY
- —
- Metro
- —
- State GDP YoY
- ▲ 1.68%
- F500 in state
- 34
Industry mix (Fortune 500 HQ in PA)
| Industry | F500 HQs | Revenue |
|---|---|---|
| Healthcare | 2 | $309B |
|
||
| Insurance | 2 | $27B |
|
||
| Telecommunications / Media | 1 | $124B |
|
||
| Industrial Distribution | 1 | $22B |
|
||
| Financial Services | 1 | $20B |
|
||
| Chemicals / Materials | 1 | $18B |
|
||
Price history
+349.8% since first listed3 events — show timeline
- 2026-06-12 Listed $89,000 GEBOR
- 1995-12-05 Sold (Public Records) $35,000 Public Records
- 1989-12-01 Sold (Public Records) $19,787 Public Records
Property tax history
+1.9%/yrLatest (2026): $1,578 · +3.4% YoY. Source: county tax records.
Cash-flow waterfall
monthlySold comps — $/sqft
last 12 mo · ≤1 miLoading sold comps…