325 Dana Dr · Redland, TX
Flood risk No data
- FEMA flood zone
- —
- Chance of flooding over 30 yrs
- —
- Est. flood insurance / yr
- —
Fire risk No data
- Est. fire insurance / yr
- —
Heat risk No data
- Hot days now (above threshold)
- —
- Hot days in 30 yrs
- —
Wind risk No data
- Chance of severe wind over 30 yrs
- —
Air-quality risk No data
- Unhealthy air days now
- —
- Unhealthy air days in 30 yrs
- —
Risk factors via First Street. Map © Google.
Why this score? — see what drove the C- grade
The composite is a weighted blend of 9 inputs, each scored 0–100. Each bar is that input's sub-score; the figure is the points it added to the 100-point composite (weight × sub-score).
- ARV discount +15.0/15.0
- Cash flow +13.5/30.0
- Condition / age +4.8/5.0
- DSCR +4.1/10.0
- 1% rule +3.8/10.0
- Schools +3.3/10.0
- Livability +3.3/5.0
- Rent growth +2.5/5.0
- Appreciation +0.0/10.0
$164,990
🖨 Deal sheet 📄 Offer letter ✓ Due diligence
Listing remarks MLS
Model 1229 A1 - Savannah Known for providing the lowest price and price per square foot, National Homecorp is here to help you get more home for your money! SELLER-Paid Closing Costs: Enjoy up to 3% closing cost contribution when you use NHC lender and our preferred title company.
Key facts
- Built 2026
- Listed 22 days
Neighborhood map
What this means for you Summary
Snapshot
- This is a 3-bed/2.5-bath single-family listed at $165k. Condition is rated excellent.
Deal economics
- At list price, monthly cash flow is $5 ($60/yr) — positive.
- The deal already cash-flows at list — no discount required.
- To meet the 1% rule (rent ≥ 1% of price), the offer needs to be $145k (12.1% below list).
- Recommended offer: $145k (12.1% below list) — sets the bar for 1% rule.
Location & tenants
- Location reads 66/100 on livability (#634 in TX) — a middle-class / working-renter tenant base. Strengths: cost of living A+, housing A+, crime A-; Watch: schools F, amenities F, commute F.
- Lufkin ISD (town): math 39% / reading 39% proficiency, ranked #446 of 826 in TX (top 54%) — families likely to look elsewhere, expect single-tenant / working-renter base with shorter leases; 68% free/reduced lunch — lower-income household profile, screen leases tightly.
- Market conditions: 297 active listings in the ZIP; 120 units permitted in Angelina County in 2024 (0 in 5+ unit buildings).
Forward outlook
- Local home prices are declining (-3.0%/yr); year-one equity from $1k of loan paydown is wiped out by about $5k of value loss. Plan a longer hold.
Negotiation context
- It's been on market 23 days — a 2% lower offer ($163k) is reasonable based on typical stale-listing flexibility.
- 4 sale attempts; this cycle's ask has dropped $25k (13%) from the opening price — seller is motivated, your offer sets the floor, not the list.
Questions for the listing agent
- Is there a deadline driving the sale (1031 exchange, divorce, estate, relocation)? That informs how much negotiation room exists.
- Schools are F-rated, which usually means shorter tenancies and higher turnover. Who's the typical renter profile here, and what's been the actual vacancy rate?
- What's the average days-on-market for RENTAL listings here right now (not sales)? A rising rental-DOM trend means longer vacancies and softer asking-rent achievability than the comps imply.
- What's the recent tenant-quality profile in this submarket — average credit score on applications, eviction rate, late-payment / NSF rate, and stable-employment percentage? A property-management company in the area should have these aggregated.
- How much new for-sale + rental construction is in the pipeline within 1–3 miles? Heavy new supply typically softens prices + rents 12–24 months out; constrained supply supports both.
Investment metrics
- 1% rule
- 0.88% ✗
- Cap rate
- 6.33%
- Cash-on-cash
- 0.13%
- DSCR
- 1.01
- GRM
- 9.5
CMA / ARV
- ARV (median comp)
- $202,203
- List price
- $164,990
- Delta
- -16.92%
- Verdict
- UNDERPRICED
- Comps
- 4 within 1.0 mi
Show comp detail 1 sale within ~0.75 mi
| Address | Dist | Beds/Ba | Sqft | Sold | Price | $/sf | Match |
|---|---|---|---|---|---|---|---|
| 370 Byrd Dr | 0.25mi | 3/3.0 | 1,409 (+15%) | 2mo | $70,000 | $50 | 61 |
Match score weights: distance 35% · size 25% · config 20% · recency 20%. Top-matched comps best support the ARV.
Projected returns pro-forma
-3.0% appreciation · 3.0% rent growth · sell at horizon
- IRR
- -16.1%
- Equity multiple
- 0.43×
- Total profit
- $-26,396
- Equity at exit
- $24,601
- IRR
- -7.7%
- Equity multiple
- 0.51×
- Total profit
- $-22,487
- Equity at exit
- $14,265
Cash invested: $46,197 (down + closing). Projections, not guarantees.
Landlord ↔ Tenant lean methodology
- Overall (STATE)
- 87 Strongly Landlord-Friendly
- State Texas
- 87 Strongly Landlord-Friendly · R+5
- County
- — inherits STATE
- City
- — inherits STATE
ZIP-level market 75901
- Home prices YoY
- -16.9%
- Active inventory
- 297
- Price-to-rent
- 9.5×
Monthly cashflow live
- Estimated rent
- $1,450 medium interval (Pro) →
- Mortgage (P&I)
- −$865
- Tax est. 1.5%
- −$206 /mo · $2,475/yr
- Insurance
- −$69
- HOA
- −$0
- Vacancy / Maint / Mgmt
- −$304
- Net cashflow
- $5
Break-even live
UW: 25.0% down · 7.5% · 30yr · 1.5% tax · 5.0% vac · 8.0% maint · 8.0% mgmt
Financing live
Cash to close
- Down payment
- $41,248
- Closing costs
- $4,950
- Reserves months
- —
- Total cash needed
- —
Loan-product check · same deal, 3 products live
Conventional
25% down · 7.5% · 30yr
- Down + closing
- —
- Monthly P&I
- —
- Monthly cashflow
- —
- DSCR
- —
- Eligible?
- —
Personal DTI + credit; lowest rate.
DSCR
20% down · 8.5% · 30yr
- Down + closing
- —
- Monthly P&I
- —
- Monthly cashflow
- —
- DSCR
- —
- Eligible?
- —
No personal income docs; deal must DSCR.
Hard money
10% down · 12.0% · 12mo
- Down + closing
- —
- Monthly P&I
- —
- Monthly cashflow
- —
- DSCR
- —
- Eligible?
- —
Short-term bridge; refi at stabilization.
Listing history 28 events
-
2026-06-19days on market $164,990 Active 23 DOM
-
2026-06-18days on market $164,990 Active 22 DOM
-
2026-06-17price $164,990 Active 21 DOM
-
2026-06-17days on market $166,990 Active 21 DOM
-
2026-06-16days on market $166,990 Active 20 DOM
-
2026-06-15days on market $166,990 Active 19 DOM
-
2026-06-14days on market $166,990 Active 17 DOM
-
2026-06-13days on market $166,990 Active 16 DOM
-
2026-06-10days on market $166,990 Active 14 DOM
-
2026-06-09days on market $166,990 Active 13 DOM
-
2026-06-08days on market $166,990 Active 12 DOM
-
2026-06-07days on market $166,990 Active 11 DOM
-
2026-06-03days on market $166,990 Active 7 DOM
-
2026-06-03price $166,990 Active 6 DOM
-
2026-06-02days on market $167,990 Active 6 DOM
-
2026-06-01days on market $167,990 Active 5 DOM
-
2026-05-31days on market $167,990 Active 4 DOM
-
2026-05-30days on market $167,990 Active 3 DOM
-
2026-05-14price $174,990 283-char remark
Show marketing remark (283 chars)
Model 1229 A1 - Savannah Known for providing the lowest price and price per square foot, National Homecorp is here to help you get more home for your money! SELLER-Paid Closing Costs: Enjoy up to 3% closing cost contribution when you use NHC lender and our preferred title company.
-
2026-05-12historical
-
2026-04-22price $179,990 283-char remark
Show marketing remark (283 chars)
Model 1229 A1 - Savannah Known for providing the lowest price and price per square foot, National Homecorp is here to help you get more home for your money! SELLER-Paid Closing Costs: Enjoy up to 3% closing cost contribution when you use NHC lender and our preferred title company.
-
2026-04-15$189,990 Active
-
2026-04-14historical
-
2026-04-08$189,990 Active
-
2026-03-11price $189,990
Show marketing remark (283 chars)
Model 1229 A1 - Savannah Known for providing the lowest price and price per square foot, National Homecorp is here to help you get more home for your money! SELLER-Paid Closing Costs: Enjoy up to 3% closing cost contribution when you use NHC lender and our preferred title company.
-
2026-03-11price $189,990 283-char remark
Show marketing remark (283 chars)
Model 1229 A1 - Savannah Known for providing the lowest price and price per square foot, National Homecorp is here to help you get more home for your money! SELLER-Paid Closing Costs: Enjoy up to 3% closing cost contribution when you use NHC lender and our preferred title company.
-
2026-02-24$199,988 Active 283-char remark
Show marketing remark (283 chars)
Model 1229 A1 - Savannah Known for providing the lowest price and price per square foot, National Homecorp is here to help you get more home for your money! SELLER-Paid Closing Costs: Enjoy up to 3% closing cost contribution when you use NHC lender and our preferred title company.
-
2026-02-05$199,988 Active
ⓘ Source: listings_history table (triggers on properties + properties_extension) + one-shot
backfill from property_details.listing_events for pre-trigger history.
Nearby sold comps map
Loading sold comps map…
Walkable amenities ~0.75 mi
Loading nearby amenities…
Taxation est. · year 1
- Rental income
- $17,395
- − Mortgage interest
- −$9,242
- − Property taxes
- −$2,475
- − Insurance
- −$825
- − Repairs & maintenance
- −$1,392
- − Management
- −$1,392
- − Depreciation
- −$4,800
- Taxable loss
- −$2,729
- Est. tax savings @ 24.0%
- +$655
- After-tax cash flow
- $715/yr
For passive investors: Depreciation is non-cash, so a rental often shows a tax loss while cash-flowing — sheltering income. Rental losses are passive: they offset passive income freely, and up to $25,000/yr can offset ordinary (W-2) income if you actively participate and your MAGI is under $100k (phasing out to $0 by $150k); unused losses carry forward. On sale, claimed depreciation is recaptured at up to 25%, and gains may owe capital-gains tax (a 1031 exchange can defer both). Figures are a year-1 estimate at your 24.0% rate — not tax advice; consult a CPA.
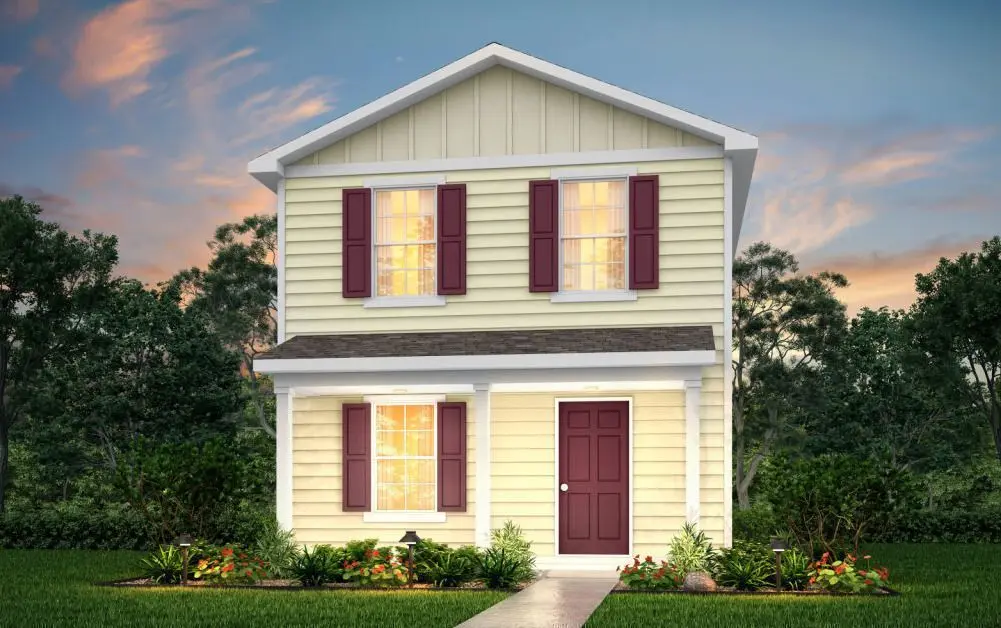
Condition & rehab AI · 1 photo
This two-story home is in excellent condition with no visible repairs needed. It offers a spacious layout and modern amenities, making it an ideal investment for both resale and rental markets.
Value-add opportunities
- Both Painting exterior and interior — Enhances curb appeal and interior aesthetics
- Both Landscaping improvements — Enhances curb appeal and adds value
- Both New flooring in bathrooms — Improves aesthetics and functionality
- Both New kitchen appliances — Enhances functionality and appeal
Renovation cost estimate screening
Value-add ROI direction
- Both Painting exterior and interior — Enhances curb appeal and interior aesthetics ↑
- Both Landscaping improvements — Enhances curb appeal and adds value ↑
- Both New flooring in bathrooms — Improves aesthetics and functionality ↑
- Both New kitchen appliances — Enhances functionality and appeal ↑
ⓘ Cost ranges are severity-bucket heuristics (US national rule-of-thumb). Get contractor quotes + a written scope before underwriting a rehab budget.
Schools (NCES district)
- District
- Lufkin ISD
- NCES district ID
- 4828550
- Math proficiency
- 39% ▼ -9.00%
- Reading proficiency
- 39% ▬ 0.00%
- Median HH income
- $41,009
- Composite
- 32.81/100
- National rank
- #5625
- State rank
- #446 of 826 in TX
Livability — Redland
- Score
- 66/100
- State rank
- #634
- US rank
- #12099
Category grades
Schools grade is shown separately in the Schools card above.
Census & demographics
- Census place
- Redland, TX
- County
- Angelina County · 62,696 people
- Metro
- Lufkin, TX
- Population (ZIP)
- 28,234
- Household income
- $62,966
- Rent vs Own
- Severe rent burden
- 930.0
Population outlook (Angelina County) Hauer SSP2
- Today (2025)
- 90,174 people
- By 2030
- 90,697 · +0.6%
- By 2040
- 91,291 · +1.2%
- By 2050
- 91,168 · +1.1%
- By 2075
- 88,961 · -1.3%
- By 2100
- 80,590 · -10.6%
Race, ethnicity, and origin ACS 2023
- Neighborhood character
- Diverse neighborhood (Simpson 0.64)
- Race & ethnicity
- White 48% Hispanic / Latino 33% Two or more races 21% Black 12% Asian 2%
- Hispanic origin (detail)
- Mexican 28%
- Common ancestry
- Lithuanian 2% Slovak 2% Italian 1%
- Foreign-born
- 14% · Canada
- Languages at home
- 72% English-only · Spanish 25% Chinese 1% Vietnamese 0%
Political lean MEDSL · Angelina
- 2024 margin
- Solid R (+52.0) · D 23.7% · R 75.7%
- 2008→2024 swing
- -17.0pp toward R · 2008: -35.0pp · 2024: -52.0pp
- All cycles
- 2024: R+52.0 2020: R+46.1 2016: R+47.3 2012: R+43.9 2008: R+35.0
Not yet ingested
- Civics
- —
Market trends
- HPI YoY
- ▼ -47.13%
- Current HPI
- 232.6282
- Rent YoY
- —
- Metro
- Lufkin, TX
- State GDP YoY
- ▲ 3.95%
- F500 in state
- 110
Industry mix (Fortune 500 HQ in TX)
| Industry | F500 HQs | Revenue |
|---|---|---|
| Energy | 16 | $1,198B |
|
||
| Technology | 5 | $198B |
|
||
| Engineering / Construction | 4 | $72B |
|
||
| Energy Services | 3 | $60B |
|
||
| Utilities | 3 | $41B |
|
||
| Healthcare | 2 | $330B |
|
||
Price history
-12.5% since first listed10 events — show timeline
- 2026-05-14 Price Changed $174,990 Zillow
- 2026-05-12 Listing Removed — HARMLS
- 2026-04-22 Price Changed $179,990 Zillow
- 2026-04-15 Listed $189,990 HARMLS
- 2026-04-14 Listing Removed — HARMLS
- 2026-04-08 Listed $189,990 Deep East Texas MLS
- 2026-03-11 Price Changed $189,990 HARMLS
- 2026-03-11 Price Changed $189,990 Zillow
- 2026-02-24 Listed $199,988 Zillow
- 2026-02-05 Listed $199,988 HARMLS
Cash-flow waterfall
monthlySold comps — $/sqft
last 12 mo · ≤1 miLoading sold comps…