5579 Frozen Camp Creek Rd · Reedy, WV
Flood risk 8/10 · Major
- FEMA flood zone
- X (unshaded)
- Chance of flooding over 30 yrs
- 0.99%
- Est. flood insurance / yr
- $507 – $1,088
Fire risk 3/10 · Minor
- Est. fire insurance / yr
- $787 – $1,461
Heat risk 4/10 · Minor
- Hot days now (above 100°F)
- 7 days/yr
- Hot days in 30 yrs
- 19 days/yr
Wind risk 2/10 · Minimal
- Chance of severe wind over 30 yrs
- 1.0%
Air-quality risk 2/10 · Minimal
- Unhealthy air days now
- 0 days/yr
- Unhealthy air days in 30 yrs
- 1 days/yr
Risk factors via First Street. Map © Google.
Why this score? — see what drove the C- grade
The composite is a weighted blend of 9 inputs, each scored 0–100. Each bar is that input's sub-score; the figure is the points it added to the 100-point composite (weight × sub-score).
- Cash flow +17.5/30.0
- ARV discount +7.5/15.0
- DSCR +5.5/10.0
- Appreciation +5.1/10.0
- 1% rule +3.9/10.0
- Schools +3.5/10.0
- Livability +2.9/5.0
- Rent growth +2.5/5.0
- Condition / age +2.5/5.0
$115,000
🖨 Deal sheet (PDF) 📄 Offer letter ✓ Due diligence
Listing remarks
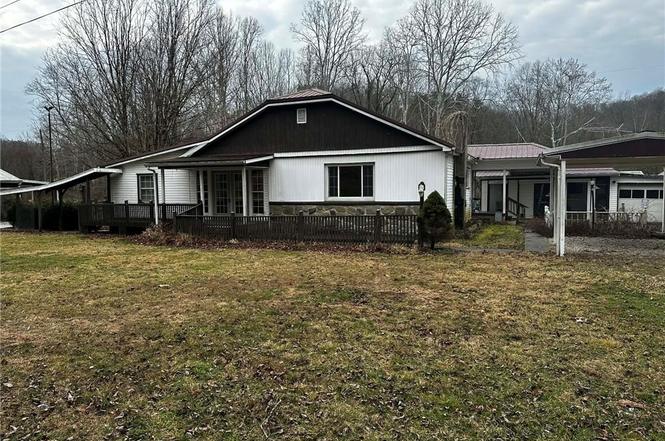
Welcome home to Leroy, WV! This one-floor home offers 3 bedrooms plus a bonus room, gas heat, a metal roof, and a wood-burning stove. Original hardwood floors are believed to be under the carpet, and an accessible attic provides ample storage with potential for additional living space. The property features a flat yard, a 24x30 garage with electric, an old greenhouse with gas service available, and an additional heated outbuilding with a former canning kitchen. A solid home with great potential for buyers ready to make it their own. Schedule your showing today!
Key facts
- 24x30 garage
- Metal roof
- Accessible attic
Tags
Property features AI
Exterior
- Parking: Detached garage with 2 spaces
- Security: Smoke detector(s)
- Utilities: Well water; Septic tank; Cable available
- Home design: Single-family residence; One story
- Construction: Stone and vinyl siding; Metal roof; No basement
- Exterior features: Porch; Outbuilding; Storage; Creek/stream on the property
Interior
- Kitchen: Dishwasher; Electric range; Refrigerator
- Flooring: Carpet; Hardwood; Tile; Vinyl
- Bathrooms: 1 full bathroom
- Heating & cooling: Central air conditioning; Forced air heating; Wood stove; Coal heating; Wall furnace
- Interior features: Eat-in kitchen; Insulated windows; Storage
Neighborhood map
What this means for you Summary
Snapshot
- This is a 2-bed/1.0-bath single-family listed at $115k.
Deal economics
- At list price, monthly cash flow is $22 ($269/yr) — positive.
- The deal already cash-flows at list — no discount required.
- To meet the 1% rule (rent ≥ 1% of price), the offer needs to be $102k (11.0% below list).
- Recommended offer: $101k (12.0% below list) — sets the bar for market timing.
Location & tenants
- Location reads 57/100 on livability (#262 in WV) — a working-class tenant base; expect higher turnover. Strengths: cost of living A+, housing A-; Watch: crime C-, health & safety D, amenities F.
- Jackson County Schools (town): math 38% / reading 45% proficiency, ranked #4 of 55 in WV (top 7%) — families likely to look elsewhere, expect single-tenant / working-renter base with shorter leases.
- Zoned schools: Gilmore Elementary School (math 57% / reading 42%, grade D, #49 of 377 statewide, top 16%, 159 students, 0% FRL); Ravenswood Middle School (math 38% / reading 43%, grade F, #16 of 109 statewide, top 16%, 321 students, 0% FRL); Ravenswood High School (math 12% / reading 47%, grade F, #69 of 110 statewide, top 71%, 429 students, 0% FRL) — zoned schools average 0% FRL vs 41% district-wide (41 pts lower); this property's tenant base skews higher-income than the district average.
- Market conditions: 6 active listings in the ZIP; 1 units permitted in Jackson County in 2024 (0 in 5+ unit buildings).
Forward outlook
- In year one you build about $944 of equity ($795 loan paydown + $149 appreciation (0.1% local appreciation)).
- Jackson County population projected at -12% by 2050 — secular population decline; favor cash flow + early exit over multi-decade hold.
Negotiation context
- It's been on market 136 days — a 12% lower offer ($101k) is reasonable based on typical stale-listing flexibility.
- 2 sale attempts; this cycle's ask has dropped $20k (15%) from the opening price — seller is motivated, your offer sets the floor, not the list.
Risks & watch-outs
- Watch-outs: flood insurance adds $66/mo; built in 1950 — expect roof / HVAC / electrical / plumbing capex.
- Climate carrying-cost: severe flood risk — expect insurance premiums to compound above CPI over the hold.
Questions for the listing agent
- It's been on market 136 days. Have you received any prior offers? Is the seller open to a 12% concession, seller financing, or rate buy-down credit?
- Built in 1950 — when were the roof, HVAC, electrical panel, plumbing, and water heater last replaced?
- What's the actual annual flood-insurance premium (NFIP or private), and is the property in a SFHA with mandatory coverage?
- Why hasn't it sold? Are there any deal-killer items the seller is aware of (foundation, flood, title, zoning, code violations)?
- Is there a deadline driving the sale (1031 exchange, divorce, estate, relocation)? That informs how much negotiation room exists.
- Schools are F-rated, which usually means shorter tenancies and higher turnover. Who's the typical renter profile here, and what's been the actual vacancy rate?
- What's the average days-on-market for RENTAL listings here right now (not sales)? A rising rental-DOM trend means longer vacancies and softer asking-rent achievability than the comps imply.
- What's the recent tenant-quality profile in this submarket — average credit score on applications, eviction rate, late-payment / NSF rate, and stable-employment percentage? A property-management company in the area should have these aggregated.
- How much new for-sale + rental construction is in the pipeline within 1–3 miles? Heavy new supply typically softens prices + rents 12–24 months out; constrained supply supports both.
Investment metrics
- 1% rule
- 0.89% ✗
- Cap rate
- 7.22%
- Cash-on-cash
- 3.31%
- DSCR
- 1.15
- GRM
- 9.4
CMA / ARV
No comps found within radius.
Projected returns pro-forma
0.13% appreciation · 3.0% rent growth · sell at horizon
- IRR
- -0.8%
- Equity multiple
- 0.96×
- Total profit
- $-1,221
- Equity at exit
- $34,141
- IRR
- 4.7%
- Equity multiple
- 1.52×
- Total profit
- $16,704
- Equity at exit
- $41,642
Cash invested: $32,200 (down + closing). Projections, not guarantees.
Landlord ↔ Tenant lean methodology
- Overall (STATE)
- 83 Strongly Landlord-Friendly
- State West Virginia
- 83 Strongly Landlord-Friendly · R+22
- County
- — inherits STATE
- City
- — inherits STATE
ZIP-level market 25252
- Home prices YoY
- 0.1%
- Active inventory
- 6
- Price-to-rent
- 9.4×
Monthly cashflow live
- Estimated rent
- $1,024 medium interval (Pro) →
- Mortgage (P&I)
- −$603
- Tax from tax record
- −$69 /mo · $827/yr
- Insurance
- −$48
- Flood insurance flood zone
- −$66 /mo · $798/yr
- HOA
- −$0
- Vacancy / Maint / Mgmt
- −$215
- Net cashflow
- $22
Break-even live
Sensitivity live
| Price | -10% $88 | -5% $55 | +0% $22 | +5% $-10 | +10% $-43 |
|---|---|---|---|---|---|
| Rent | -10% $-58 | -5% $-18 | +0% $22 | +5% $63 | +10% $103 |
| Rate | -1.0pp $80 | -0.5pp $52 | base $22 | +0.5pp $-7 | +1.0pp $-38 |
UW: 25.0% down · 7.5% · 30yr · 1.5% tax · 5.0% vac · 8.0% maint · 8.0% mgmt
Financing live
Cash to close
- Down payment
- $28,750
- Closing costs
- $3,450
- Reserves months
- —
- Total cash needed
- —
Loan-product check · same deal, 3 products live
Conventional
25% down · 7.5% · 30yr
- Down + closing
- —
- Monthly P&I
- —
- Monthly cashflow
- —
- DSCR
- —
- Eligible?
- —
Personal DTI + credit; lowest rate.
DSCR
20% down · 8.5% · 30yr
- Down + closing
- —
- Monthly P&I
- —
- Monthly cashflow
- —
- DSCR
- —
- Eligible?
- —
No personal income docs; deal must DSCR.
Hard money
10% down · 12.0% · 12mo
- Down + closing
- —
- Monthly P&I
- —
- Monthly cashflow
- —
- DSCR
- —
- Eligible?
- —
Short-term bridge; refi at stabilization.
Listing history 23 events
-
2026-06-21days on market $115,000 Active 136 DOM
-
2026-06-18days on market $115,000 Active 134 DOM
-
2026-06-17days on market $115,000 Active 133 DOM
-
2026-06-16days on market $115,000 Active 132 DOM
-
2026-06-15days on market $115,000 Active 131 DOM
-
2026-06-15days on market $115,000 Active 130 DOM
-
2026-06-13days on market $115,000 Active 129 DOM
-
2026-06-12days on market $115,000 Active 128 DOM
-
2026-06-09days on market $115,000 Active 125 DOM
-
2026-06-08days on market $115,000 Active 124 DOM
-
2026-06-08days on market $115,000 Active 123 DOM
-
2026-06-07days on market $115,000 Active 122 DOM
-
2026-06-04days on market $115,000 Active 120 DOM
-
2026-06-03days on market $115,000 Active 119 DOM
-
2026-06-02days on market $115,000 Active 118 DOM
-
2026-06-01days on market $115,000 Active 117 DOM
-
2026-05-31days on market $115,000 Active 116 DOM
-
2026-05-07price $115,000
-
2026-03-20price $129,900
-
2026-02-03$134,900 Active
-
2025-09-03price $159,000
-
2025-07-09price $169,000
-
2025-06-18$174,000 Active
ⓘ Source: listings_history table (triggers on properties + properties_extension) + one-shot
backfill from property_details.listing_events for pre-trigger history.
Tax reassessment forecast WV · Resets to sale price
- Current annual tax
- $827 · $69/mo
- Projected year-2 tax
- $827 · $69/mo
- Expected delta
- $0/yr ($0/mo · 0.0%)
ⓘ Screening estimate from a state-policy table — verify with the county assessor before closing.
Climate risk First Street
- Flood 8/10 Severe FEMA zone X (unshaded) · 99% chance over 30 yrs
- Wildfire 3/10 Moderate
- Heat 4/10 Moderate 7 d/yr ≥100°F today · 19 d/yr by 30 yrs out
- Wind 2/10 Low 100% chance of damaging wind over 30 yrs
- Air quality 2/10 Low 0 unhealthy d/yr today · 1 by 30 yrs out
Nearby sold comps map
Loading sold comps map…
Walkable amenities ~0.75 mi
Loading nearby amenities…
Taxation est. · year 1
- Rental income
- $12,285
- − Mortgage interest
- −$6,442
- − Property taxes
- −$827
- − Insurance
- −$1,372
- − Repairs & maintenance
- −$983
- − Management
- −$983
- − Depreciation
- −$3,345
- Taxable loss
- −$1,667
- Est. tax savings @ 24.0%
- +$400
- After-tax cash flow
- $669/yr
For passive investors: Depreciation is non-cash, so a rental often shows a tax loss while cash-flowing — sheltering income. Rental losses are passive: they offset passive income freely, and up to $25,000/yr can offset ordinary (W-2) income if you actively participate and your MAGI is under $100k (phasing out to $0 by $150k); unused losses carry forward. On sale, claimed depreciation is recaptured at up to 25%, and gains may owe capital-gains tax (a 1031 exchange can defer both). Figures are a year-1 estimate at your 24.0% rate — not tax advice; consult a CPA.
Schools (NCES district)
- District
- Jackson County Schools
- NCES district ID
- 5400540
- Math proficiency
- 38% ▼ -6.00%
- Reading proficiency
- 45% ▼ -6.00%
- Median HH income
- $41,632
- Composite
- 34.92/100
- National rank
- #5070
- State rank
- #4 of 55 in WV
Livability — Reedy
- Score
- 57/100
- State rank
- #262
- US rank
- #22347
Category grades
Schools grade is shown separately in the Schools card above.
Census & demographics
- Population (ZIP)
- 1,166
Population outlook (Jackson County) Hauer SSP2
- Today (2025)
- 28,752 people
- By 2030
- 28,271 · -1.7%
- By 2040
- 26,970 · -6.2%
- By 2050
- 25,248 · -12.2%
- By 2075
- 20,926 · -27.2%
- By 2100
- 15,573 · -45.8%
Race, ethnicity, and origin ACS 2023
- Neighborhood character
- Predominantly White (98%)
- Race & ethnicity
- White 98% Two or more races 2%
- Common ancestry
- Slovak 10% Romanian 2% Serbian 2%
Political lean MEDSL · Jackson
- 2024 margin
- Solid R (+56.2) · D 21.1% · R 77.3% · Other 1.7%
- 2008→2024 swing
- -37.5pp toward R · 2008: -18.7pp · 2024: -56.2pp
- All cycles
- 2024: R+56.2 2020: R+51.0 2016: R+52.1 2012: R+30.9 2008: R+18.7
Not yet ingested
- Civics
- —
Market trends
- HPI YoY
- ▲ 0.13%
- Current HPI
- 159.8514
- Rent YoY
- —
- Metro
- —
- State GDP YoY
- —
- F500 in state
- 0
Price history
-33.9% since first listed6 events — show timeline
- 2026-05-07 Price Changed $115,000 KVBOR
- 2026-03-20 Price Changed $129,900 KVBOR
- 2026-02-03 Listed $134,900 KVBOR
- 2025-09-03 Price Changed $159,000 KVBOR
- 2025-07-09 Price Changed $169,000 KVBOR
- 2025-06-18 Listed $174,000 KVBOR
Property tax history
+19.8%/yrLatest (2025): $827 · +104.1% YoY. Source: county tax records.
Cash-flow waterfall
monthlySold comps — $/sqft
last 12 mo · ≤1 miLoading sold comps…