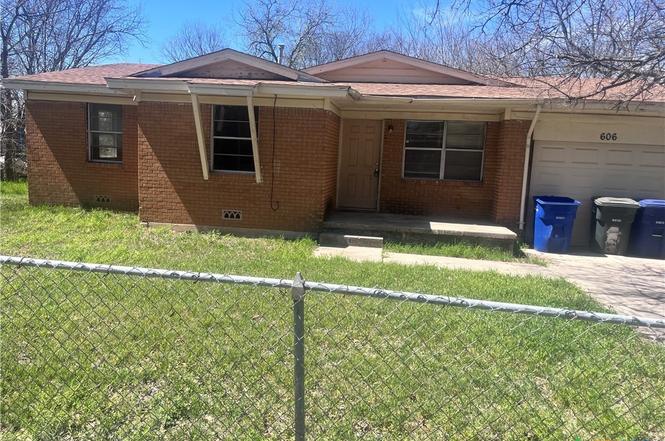
606 Mary St · Copperas Cove, TX
Flood risk 1/10 · Minimal
- FEMA flood zone
- X (unshaded)
- Chance of flooding over 30 yrs
- 0.0%
- Est. flood insurance / yr
- $507 – $1,088
Fire risk 4/10 · Minor
- Est. fire insurance / yr
- $1,222 – $2,270
Heat risk 7/10 · Major
- Hot days now (above 106°F)
- 7 days/yr
- Hot days in 30 yrs
- 22 days/yr
Wind risk 6/10 · Moderate
- Chance of severe wind over 30 yrs
- 48.0%
Air-quality risk 1/10 · Minimal
- Unhealthy air days now
- 0 days/yr
- Unhealthy air days in 30 yrs
- 0 days/yr
Risk factors via First Street. Map © Google.
Why this score? — see what drove the B+ grade
The composite is a weighted blend of 9 inputs, each scored 0–100. Each bar is that input's sub-score; the figure is the points it added to the 100-point composite (weight × sub-score).
- Cash flow +30.0/30.0
- ARV discount +15.0/15.0
- 1% rule +10.0/10.0
- DSCR +10.0/10.0
- Schools +3.6/10.0
- Livability +3.2/5.0
- Condition / age +2.5/5.0
- Rent growth +2.4/5.0
- Appreciation +0.0/10.0
$60,000
🖨 Deal sheet (PDF) 📄 Offer letter ✓ Due diligence
Listing remarks
Welcome to this charming newly remodeled 3-bedroom, 1-bathroom home in the heart of Copperas Cove, featuring a blend of laminate wood and classic hardwood flooring throughout, an updated kitchen with new flooring, refrigerator, and oven, and a refreshed bathroom. Enjoy the convenience of washer and dryer hookups and a spacious, fully chain-link fenced backyard perfect for outdoor activities. Centrally located near shopping and schools, this cozy home offers comfort, convenience, and move-in-ready appeal.
Key facts
- Centrally located
- Refreshed bathroom
- Updated kitchen
Tags
Neighborhood map
What this means for you Summary
Snapshot
- This is a 3-bed/2.0-bath single-family listed at $60k.
Deal economics
- At list price, monthly cash flow is $327 ($4k/yr) — positive.
- The deal already cash-flows at list — no discount required.
- Meets the 1% rule at list price ($1k rent vs $60k).
- Cap rate 12.8% vs local median 3.5% in Copperas Cove — top-decile yield for the area; either an underpriced asset or a hidden risk that comps aren't pricing in. Stress-test before assuming the spread holds.
Location & tenants
- Location reads 65/100 on livability (#706 in TX) — a middle-class / working-renter tenant base. Strengths: cost of living A+, housing A+; Watch: employment D+, amenities F, commute F.
- Copperas Cove ISD (suburban): math 41% / reading 42% proficiency, ranked #340 of 826 in TX (top 41%) — families likely to look elsewhere, expect single-tenant / working-renter base with shorter leases.
- Zoned schools: Fairview/Miss Jewell El (math 39% / reading 42%, grade F, #1,490 of 4,322 statewide, top 35%, 500 students, 77% FRL); Copperas Cove J H (math 43% / reading 42%, grade D-, #553 of 1,662 statewide, top 34%, 924 students, 63% FRL); Copperas Cove H S (math 29% / reading 42%, grade F, #941 of 1,632 statewide, top 58%, 2,277 students, 52% FRL) — zoned schools average 64% FRL vs 41% district-wide (23 pts higher); higher-poverty schools than district average — tighter screening recommended.
- Market conditions: Rents soft (-0.2%/yr); 611 active listings in the ZIP; 40 comparable units currently listed for rent nearby; rentals lingering (median 46d on market — plan ~5-8 weeks vacancy on turnover, expect pricing pressure); 62% of comp listings sitting > 30 days — soft ceiling on asking rent; 386 units permitted in Coryell County in 2024 (0 in 5+ unit buildings).
- This rent is only 18% of the median local income ($72k/yr) — well below the 30% rent-burden line; pricing power to push rent on renewal without tenant pushback.
Forward outlook
- Local home prices are declining (-3.0%/yr); year-one equity from $415 of loan paydown is wiped out by about $2k of value loss. Plan a longer hold.
- At projected returns (-3.0% appreciation + 0.0% rent growth), your $17k cash investment doubles in ~7 years — after that, you're playing with house money.
Negotiation context
- Only 1 days on market — expect competitive offers; lowballing is unlikely to land.
Risks & watch-outs
- Watch-outs: property tax is 3.8% of price.
- Climate carrying-cost: major wind risk, 48% chance of damaging wind over 30y; extreme-heat days projected 7→22/yr by 2055 (HVAC capex compounding) — expect insurance premiums to compound above CPI over the hold.
Questions for the listing agent
- Built in 1961 — when were the roof, HVAC, electrical panel, plumbing, and water heater last replaced?
- Property tax is high relative to price — has the assessment been appealed recently, and will the sale trigger a re-assessment?
- Is there a deadline driving the sale (1031 exchange, divorce, estate, relocation)? That informs how much negotiation room exists.
- What's the average days-on-market for RENTAL listings here right now (not sales)? A rising rental-DOM trend means longer vacancies and softer asking-rent achievability than the comps imply.
- What's the recent tenant-quality profile in this submarket — average credit score on applications, eviction rate, late-payment / NSF rate, and stable-employment percentage? A property-management company in the area should have these aggregated.
- How much new for-sale + rental construction is in the pipeline within 1–3 miles? Heavy new supply typically softens prices + rents 12–24 months out; constrained supply supports both.
Investment metrics
- 1% rule
- 1.81% ✓
- Cap rate
- 12.83%
- Cash-on-cash
- 23.34%
- DSCR
- 2.04
- GRM
- 4.6
CMA / ARV
- ARV (on-the-fly)
- $117,993
- Comps found
- 12
Show comp detail 12 sales within ~0.75 mi
| Address | Dist | Beds/Ba | Sqft | Sold | Price | $/sf | Match |
|---|---|---|---|---|---|---|---|
| 707 S 5th St | 0.09mi | 3/1.0 | 1,112 (+5%) | 1mo | $116,000 | $104 | 83 |
| 1102 S 3rd St | 0.36mi | 3/2.0 | 1,039 (-2%) | 2mo | $115,000 | $111 | 78 |
| 506 Veterans Ave | 0.28mi | 3/1.0 | 1,034 (-3%) | 3mo | $150,000 | $145 | 76 |
| 1002 S 7th St | 0.30mi | 3/2.0 | 1,122 (+6%) | 4mo | $62,000 | $55 | 73 |
| 102 E Robertson Ave | 0.30mi | 3/1.0 | 1,008 (-5%) | 1mo | $157,500 | $156 | 73 |
| 1106 S 15th St | 0.50mi | 3/1.5 | 1,032 (-3%) | 1mo | $160,882 | $156 | 69 |
| 714 Mickan St | 0.49mi | 3/1.0 | 1,008 (-5%) | 1mo | $97,800 | $97 | 63 |
| 1211 S 13th St | 0.55mi | 3/2.0 | 1,118 (+5%) | 4mo | $117,000 | $105 | 62 |
| 1003 S 27th St | 0.68mi | 3/1.5 | 1,124 (+6%) | 2mo | $159,000 | $141 | 55 |
| 401 Veterans Ave | 0.23mi | 2/1.0 (-1) | 912 (-14%) | 2mo | $98,000 | $107 | 54 |
| 803 Sandy Ct | 0.34mi | 2/1.0 (-1) | 936 (-12%) | 5mo | $60,000 | $64 | 51 |
| 914 Edwards St | 0.73mi | 3/2.0 | 1,149 (+8%) | 3mo | $179,800 | $156 | 50 |
Match score weights: distance 35% · size 25% · config 20% · recency 20%. Top-matched comps best support the ARV.
Projected returns pro-forma
-3.0% appreciation · 0.0% rent growth · sell at horizon
- IRR
- 12.5%
- Equity multiple
- 1.48×
- Total profit
- $8,003
- Equity at exit
- $8,946
- IRR
- 18.5%
- Equity multiple
- 2.30×
- Total profit
- $21,853
- Equity at exit
- $5,188
Cash invested: $16,800 (down + closing). Projections, not guarantees.
Landlord ↔ Tenant lean methodology
- Overall (STATE)
- 87 Strongly Landlord-Friendly
- State Texas
- 87 Strongly Landlord-Friendly · R+5
- County
- — inherits STATE
- City
- — inherits STATE
ZIP-level market 76522
- Home prices YoY
- -22.4%
- Rents YoY
- -0.2%
- Active inventory
- 611
- Price-to-rent
- 4.6×
Monthly cashflow live
- Estimated rent
- $1,083 high interval (Pro) →
- Mortgage (P&I)
- −$315
- Tax from tax record
- −$189 /mo · $2,271/yr
- Insurance
- −$25
- HOA
- −$0
- Lot rent
- −$0
- Vacancy / Maint / Mgmt
- −$227
- Net cashflow
- $327
Break-even live
Sensitivity live
| Price | -10% $361 | -5% $344 | +0% $327 | +5% $310 | +10% $293 |
|---|---|---|---|---|---|
| Rent | -10% $241 | -5% $284 | +0% $327 | +5% $370 | +10% $412 |
| Rate | -1.0pp $357 | -0.5pp $342 | base $327 | +0.5pp $311 | +1.0pp $295 |
UW: 25.0% down · 7.5% · 30yr · 1.5% tax · 5.0% vac · 8.0% maint · 8.0% mgmt
Financing live
Cash to close
- Down payment
- $15,000
- Closing costs
- $1,800
- Reserves months
- —
- Total cash needed
- —
Loan-product check · same deal, 3 products live
Conventional
25% down · 7.5% · 30yr
- Down + closing
- —
- Monthly P&I
- —
- Monthly cashflow
- —
- DSCR
- —
- Eligible?
- —
Personal DTI + credit; lowest rate.
DSCR
20% down · 8.5% · 30yr
- Down + closing
- —
- Monthly P&I
- —
- Monthly cashflow
- —
- DSCR
- —
- Eligible?
- —
No personal income docs; deal must DSCR.
Hard money
10% down · 12.0% · 12mo
- Down + closing
- —
- Monthly P&I
- —
- Monthly cashflow
- —
- DSCR
- —
- Eligible?
- —
Short-term bridge; refi at stabilization.
Rent comps 40 comps
| Address | Beds | Baths | Sqft | Rent | $/sqft | DOM | Units | Dist |
|---|---|---|---|---|---|---|---|---|
| 402 Mary St Apt 204 Copperas Cove, TX | 2.0 | 1.0 | 850 | $725 | $0.85 | 46d | 1 | 0.10mi |
| 808 Mary St Copperas Cove, TX | 3.0 | 1.0 | 1028 | $1,300 | $1.26 | 46d | 1 | 0.16mi |
| 403 S 7th St Copperas Cove, TX | 3.0 | 1.0 | 910 | $1,100 | $1.21 | 46d | 1 | 0.17mi |
| 604 S 11th St Copperas Cove, TX | 3.0 | 2.0 | 1119 | $1,300 | $1.16 | 46d | 1 | 0.18mi |
| 101 Meggs St Unit F Copperas Cove, TX | 2.0 | 1.0 | 725 | $695 | $0.96 | 46d | 1 | 0.19mi |
| 208 Veterans Ave Unit 106 Copperas Cove, TX | 2.0 | 1.0 | 829 | $650 | $0.78 | 26d | 1 | 0.20mi |
| 904 Mary St Copperas Cove, TX | 3.0 | 2.0 | 1041 | $1,052 | $1.01 | 46d | 1 | 0.20mi |
| 204 West Avenue F Unit A Copperas Cove, TX | 2.0 | 1.0 | 895 | $725 | $0.81 | 46d | 1 | 0.23mi |
| 204 West Avenue F Unit B Copperas Cove, TX | 2.0 | 1.0 | 895 | $705 | $0.79 | 46d | 1 | 0.23mi |
| 502 S 9th St Copperas Cove, TX | 3.0 | 1.5 | 1479 | $1,150 | $0.78 | 46d | 1 | 0.23mi |
| 410 Veterans Ave Unit 5 Copperas Cove, TX | 2.0 | 1.0 | 800 | $750 | $0.94 | 46d | 1 | 0.25mi |
| 1004 S 3rd St Copperas Cove, TX | 3.0 | 1.0 | 940 | $950 | $1.01 | 26d | 1 | 0.29mi |
| 1010 Georgetown Rd Copperas Cove, TX | 3.0 | 1.0 | 1018 | $995 | $0.98 | 46d | 1 | 0.32mi |
| 504 Highway Ave Unit B Copperas Cove, TX | 2.0 | 1.0 | 1500 | $700 | $0.47 | 46d | 1 | 0.34mi |
| 1008 S 9th St Unit B Copperas Cove, TX | 2.0 | 1.0 | 796 | $700 | $0.88 | 46d | 1 | 0.35mi |
| 1005 S 11th St Copperas Cove, TX | 4.0 | 2.0 | 1236 | $1,090 | $0.88 | 46d | 1 | 0.35mi |
| 915 S 15th St Copperas Cove, TX | 3.0 | 2.0 | 1008 | $850 | $0.84 | 16d | 1 | 0.36mi |
| 412 West Avenue C Unit C Copperas Cove, TX | 3.0 | 2.0 | 1343 | $1,600 | $1.19 | 23d | 1 | 0.39mi |
| 414 West Avenue C Unit C Copperas Cove, TX | 3.0 | 2.0 | 1343 | $1,600 | $1.19 | 46d | 1 | 0.39mi |
| 509 West Avenue B Copperas Cove, TX | 3.0 | 2.0 | 1339 | $1,175 | $0.88 | 26d | 1 | 0.43mi |
| 1202 S 3rd St Copperas Cove, TX | 3.0 | 2.0 | 1056 | $1,175 | $1.11 | 46d | 1 | 0.43mi |
| 1201 S 9th St Copperas Cove, TX | 3.0 | 2.0 | 1172 | $1,100 | $0.94 | 26d | 1 | 0.45mi |
| 1204 S 7th St Copperas Cove, TX | 3.0 | 2.0 | 1202 | $1,295 | $1.08 | 46d | 1 | 0.46mi |
| 304 Carpenter St Unit 1 Copperas Cove, TX | 2.0 | 1.0 | 850 | $775 | $0.91 | 46d | 1 | 0.46mi |
| 304 Carpenter St Unit 7 Copperas Cove, TX | 2.0 | 1.0 | 850 | $775 | $0.91 | 26d | 1 | 0.46mi |
| 1005 S 19th St Copperas Cove, TX | 3.0 | 1.5 | 1356 | $1,100 | $0.81 | 46d | 1 | 0.50mi |
| 806 S 25th St Copperas Cove, TX | 3.0 | 2.0 | 1400 | $1,400 | $1.00 | 46d | 1 | 0.54mi |
| 607 Curry Ave Copperas Cove, TX | 3.0 | 1.5 | 1192 | $935 | $0.78 | 26d | 1 | 0.54mi |
| 1006 S 21st St Copperas Cove, TX | 4.0 | 2.0 | 1445 | $1,100 | $0.76 | 46d | 1 | 0.56mi |
| 307 Sunset Ln Unit 4 Copperas Cove, TX | 2.0 | 1.0 | 754 | $700 | $0.93 | 16d | 1 | 0.58mi |
| 307 Sunset Ln Unit 6 Copperas Cove, TX | 2.0 | 1.0 | 800 | $650 | $0.81 | 46d | 1 | 0.58mi |
| 903 Curry Ave Copperas Cove, TX | 3.0 | 2.5 | 1285 | $1,200 | $0.93 | 26d | 1 | 0.59mi |
| 606 Westview Cir Unit B Copperas Cove, TX | 2.0 | 1.0 | 715 | $700 | $0.98 | 46d | 1 | 0.59mi |
| 606 Westview Cir Unit B Copperas Cove, TX | 2.0 | 1.0 | 715 | $700 | $0.98 | 23d | 1 | 0.59mi |
| 401 W Lincoln Ave Unit 2 Copperas Cove, TX | 2.0 | 1.0 | 740 | $850 | $1.15 | 26d | 1 | 0.60mi |
| 401 N 4th St Apt E Copperas Cove, TX | 2.0 | 1.0 | 750 | $700 | $0.93 | 26d | 1 | 0.63mi |
| 1208 S 19th St Copperas Cove, TX | 3.0 | 1.5 | 1010 | $1,525 | $1.51 | 26d | 1 | 0.63mi |
| 505 Hackberry St Unit 18 Copperas Cove, TX | 2.0 | 1.0 | 750 | $675 | $0.90 | 16d | 1 | 0.65mi |
| 505 Hackberry St Unit 25 Copperas Cove, TX | 2.0 | 1.0 | 758 | $675 | $0.89 | 46d | 1 | 0.65mi |
| 1208 Urbantke Ct Unit 6 Copperas Cove, TX | 2.0 | 1.0 | 758 | $695 | $0.92 | 46d | 1 | 0.66mi |
Listing history 2 events
-
2025-12-08status Pending
-
2025-12-08$60,000 Active
ⓘ Source: listings_history table (triggers on properties + properties_extension) + one-shot
backfill from property_details.listing_events for pre-trigger history.
Tax reassessment forecast TX · Resets to sale price
- Current annual tax
- $2,271 · $189/mo
- Projected year-2 tax
- $2,271 · $189/mo
- Expected delta
- $0/yr ($0/mo · 0.0%)
ⓘ Screening estimate from a state-policy table — verify with the county assessor before closing.
Climate risk First Street
- Flood 1/10 Low FEMA zone X (unshaded) · 0% chance over 30 yrs
- Wildfire 4/10 Moderate
- Heat 7/10 Severe 7 d/yr ≥106°F today · 22 d/yr by 30 yrs out
- Wind 6/10 Major 48% chance of damaging wind over 30 yrs
- Air quality 1/10 Low 0 unhealthy d/yr today · 0 by 30 yrs out
Nearby sold comps map
Loading sold comps map…
Walkable amenities ~0.75 mi
Loading nearby amenities…
Taxation est. · year 1
- Rental income
- $12,997
- − Mortgage interest
- −$3,361
- − Property taxes
- −$2,271
- − Insurance
- −$300
- − Repairs & maintenance
- −$1,040
- − Management
- −$1,040
- − Depreciation
- −$1,745
- Taxable income
- $3,241
- Est. tax owed @ 24.0%
- −$778
- After-tax cash flow
- $3,144/yr
For passive investors: Depreciation is non-cash, so a rental often shows a tax loss while cash-flowing — sheltering income. Rental losses are passive: they offset passive income freely, and up to $25,000/yr can offset ordinary (W-2) income if you actively participate and your MAGI is under $100k (phasing out to $0 by $150k); unused losses carry forward. On sale, claimed depreciation is recaptured at up to 25%, and gains may owe capital-gains tax (a 1031 exchange can defer both). Figures are a year-1 estimate at your 24.0% rate — not tax advice; consult a CPA.
Schools (NCES district)
- District
- Copperas Cove ISD
- NCES district ID
- 4815240
- Math proficiency
- 41% ▼ -6.00%
- Reading proficiency
- 42% ▼ -2.00%
- Median HH income
- $51,072
- Composite
- 35.85/100
- National rank
- #4822
- State rank
- #340 of 826 in TX
Livability — Copperas Cove
- Score
- 65/100
- State rank
- #706
- US rank
- #13158
Category grades
Schools grade is shown separately in the Schools card above.
Census & demographics
- Census place
- Copperas Cove, TX
- County
- Coryell County · 61,053 people
- City population
- 42,118
- Metro
- Killeen-Temple, TX
- Population (ZIP)
- 42,118
- Household income
- $72,206
- Rent vs Own
- Severe rent burden
- 1019.0
Population outlook (Coryell County) Hauer SSP2
- Today (2025)
- 75,485 people
- By 2030
- 75,627 · +0.2%
- By 2040
- 74,898 · -0.8%
- By 2050
- 74,221 · -1.7%
- By 2075
- 72,688 · -3.7%
- By 2100
- 66,862 · -11.4%
Race, ethnicity, and origin ACS 2023
- Neighborhood character
- Diverse neighborhood (Simpson 0.66)
- Race & ethnicity
- White 53% Hispanic / Latino 21% Two or more races 20% Black 14% Asian 2%
- Hispanic origin (detail)
- Mexican 11% Puerto Rican 6%
- Common ancestry
- Romanian 2% Italian 2% Lithuanian 2%
- Foreign-born
- 7% · Canada, South Korea
- Languages at home
- 85% English-only · Spanish 10% German/W. Germanic 2% Other Asian/Pacific 1%
Political lean MEDSL · Coryell
- 2024 margin
- Solid R (+40.7) · D 29.1% · R 69.8% · Other 1.1%
- 2008→2024 swing
- -13.8pp toward R · 2008: -26.9pp · 2024: -40.7pp
- All cycles
- 2024: R+40.7 2020: R+33.5 2016: R+39.5 2012: R+36.6 2008: R+26.9
Not yet ingested
- Civics
- —
Market trends
- HPI YoY
- ▼ -53.11%
- Current HPI
- 183.9452
- Rent YoY
- ▼ -0.25%
- Metro
- Killeen-Temple, TX
- State GDP YoY
- ▲ 3.95%
- F500 in state
- 110
Industry mix (Fortune 500 HQ in TX)
| Industry | F500 HQs | Revenue |
|---|---|---|
| Energy | 16 | $1,198B |
|
||
| Technology | 5 | $198B |
|
||
| Engineering / Construction | 4 | $72B |
|
||
| Energy Services | 3 | $60B |
|
||
| Utilities | 3 | $41B |
|
||
| Healthcare | 2 | $330B |
|
||
Price history
2 events — show timeline
- 2025-12-08 Pending — CTXMLS
- 2025-12-08 Listed $60,000 CTXMLS
Property tax history
+4.6%/yrLatest (2025): $2,271 · +1.4% YoY. Source: county tax records.
Cash-flow waterfall
monthlySold comps — $/sqft
last 12 mo · ≤1 miLoading sold comps…