6928 Jacksonville Cut Off Rd · Sherwood, AR
Flood risk 1/10 · Minimal
- FEMA flood zone
- X (shaded)
- Chance of flooding over 30 yrs
- 0.0%
- Est. flood insurance / yr
- $507 – $1,088
Fire risk 3/10 · Minor
- Est. fire insurance / yr
- $1,499 – $2,785
Heat risk 6/10 · Moderate
- Hot days now (above 110°F)
- 7 days/yr
- Hot days in 30 yrs
- 18 days/yr
Wind risk 4/10 · Minor
- Chance of severe wind over 30 yrs
- 9.0%
Air-quality risk 2/10 · Minimal
- Unhealthy air days now
- 2 days/yr
- Unhealthy air days in 30 yrs
- 2 days/yr
Risk factors via First Street. Map © Google.
Why this score? — see what drove the B+ grade
The composite is a weighted blend of 9 inputs, each scored 0–100. Each bar is that input's sub-score; the figure is the points it added to the 100-point composite (weight × sub-score).
- Cash flow +30.0/30.0
- ARV discount +15.0/15.0
- DSCR +10.0/10.0
- 1% rule +9.9/10.0
- Rent growth +3.7/5.0
- Livability +3.7/5.0
- Schools +2.6/10.0
- Condition / age +1.0/5.0
- Appreciation +0.0/10.0
$120,000
🖨 Deal sheet (PDF) 📄 Offer letter ✓ Due diligence
Listing remarks MLS
Pick your interior design in paint color and floor coverings. Property is sold as is with no seller's disclosure. the home has a nice setting between Sherwood and Jacksonville.
Key facts
- Built 1955
- Listed 404 days
Neighborhood map
What this means for you Summary
Snapshot
- This is a 4-bed/2.0-bath single-family listed at $120k. Condition is rated poor.
Deal economics
- At list price, monthly cash flow is $585 ($7k/yr) — positive.
- The deal already cash-flows at list — no discount required.
- Meets the 1% rule at list price ($2k rent vs $120k).
- Recommended offer: $106k (12.0% below list) — sets the bar for market timing.
- Cap rate 12.1% vs local median 4.4% in Sherwood — top-decile yield for the area; either an underpriced asset or a hidden risk that comps aren't pricing in. Stress-test before assuming the spread holds.
Location & tenants
- Location reads 73/100 on livability (#19 in AR) — a middle-class / working-renter tenant base. Strengths: cost of living A+, housing A+, health & safety A+; Watch: crime F, amenities F, commute F.
- Pulaski County Spec. School District (rural): math 27% / reading 31% proficiency, ranked #150 of 238 in AR (top 63%) — low school quality limits family demand, transient renter base, plan for 1-2y turnover.
- Zoned schools: Harris Elementary School (math 12% / reading 8%, grade F, #429 of 454 statewide, top 96%, 199 students, 97% FRL); Sylvan Hills Middle School (math 26% / reading 30%, grade F, #150 of 201 statewide, top 76%, 1,122 students, 52% FRL); Sylvan Hills High School (math 16% / reading 29%, grade F, #211 of 292 statewide, top 73%, 1,017 students, 38% FRL).
- Market conditions: Rents rising fast (+4.8%/yr); 248 active listings in the ZIP; solid renter incomes; 1,006 units permitted in Pulaski County in 2024 (0 in 5+ unit buildings).
Forward outlook
- Local home prices are declining (-3.0%/yr); year-one equity from $830 of loan paydown is wiped out by about $4k of value loss. Plan a longer hold.
- Pulaski County population projected at +6% by 2050 — modest demand growth; plan on rents tracking national, not racing it.
- At projected returns (-3.0% appreciation + 4.8% rent growth), your $34k cash investment doubles in ~6 years — after that, you're playing with house money.
Negotiation context
- It's been on market 405 days — a 12% lower offer ($106k) is reasonable based on typical stale-listing flexibility.
- 3 sale attempts with the ask held roughly flat each time — persistent listings suggest the price (not the market) is what's stuck; bring a comps-based counter.
Risks & watch-outs
- Watch-outs: built in 1955 — expect roof / HVAC / electrical / plumbing capex.
- Climate carrying-cost: extreme-heat days projected 7→18/yr by 2055 (HVAC capex compounding) — expect insurance premiums to compound above CPI over the hold.
Questions for the listing agent
- It's been on market 405 days. Have you received any prior offers? Is the seller open to a 12% concession, seller financing, or rate buy-down credit?
- Have any recent inspections been done? Can we get a copy of the seller's disclosures and any deferred-maintenance estimates?
- Built in 1955 — when were the roof, HVAC, electrical panel, plumbing, and water heater last replaced?
- Why hasn't it sold? Are there any deal-killer items the seller is aware of (foundation, flood, title, zoning, code violations)?
- Is there a deadline driving the sale (1031 exchange, divorce, estate, relocation)? That informs how much negotiation room exists.
- Crime grade is F in this area — have there been break-ins, vandalism, or insurance claims at this property in the last 3 years? What carrier currently insures it and at what premium?
- What's the average days-on-market for RENTAL listings here right now (not sales)? A rising rental-DOM trend means longer vacancies and softer asking-rent achievability than the comps imply.
- What's the recent tenant-quality profile in this submarket — average credit score on applications, eviction rate, late-payment / NSF rate, and stable-employment percentage? A property-management company in the area should have these aggregated.
- How much new for-sale + rental construction is in the pipeline within 1–3 miles? Heavy new supply typically softens prices + rents 12–24 months out; constrained supply supports both.
Investment metrics
- 1% rule
- 1.49% ✓
- Cap rate
- 12.15%
- Cash-on-cash
- 20.90%
- DSCR
- 1.93
- GRM
- 5.6
CMA / ARV
- ARV (median comp)
- $173,540
- List price
- $120,000
- Delta
- -30.85%
- Verdict
- UNDERPRICED
- Comps
- 3 within 1.0 mi
Projected returns pro-forma
-3.0% appreciation · 4.81% rent growth · sell at horizon
- IRR
- 15.4%
- Equity multiple
- 1.63×
- Total profit
- $21,177
- Equity at exit
- $17,892
- IRR
- 25.3%
- Equity multiple
- 3.40×
- Total profit
- $80,683
- Equity at exit
- $10,375
Cash invested: $33,600 (down + closing). Projections, not guarantees.
Landlord ↔ Tenant lean methodology
- Overall (STATE)
- 92 Strongly Landlord-Friendly
- State Arkansas
- 92 Strongly Landlord-Friendly · R+14
- County
- — inherits STATE
- City
- — inherits STATE
ZIP-level market 72120
- Rents YoY
- 4.8%
- Active inventory
- 248
- Price-to-rent
- 5.6×
Monthly cashflow live
- Estimated rent
- $1,791 medium interval (Pro) →
- Mortgage (P&I)
- −$629
- Tax est. 1.5%
- −$150 /mo · $1,800/yr
- Insurance
- −$50
- HOA
- −$0
- Vacancy / Maint / Mgmt
- −$376
- Net cashflow
- $585
Break-even live
Sensitivity live
| Price | -10% $668 | -5% $627 | +0% $585 | +5% $544 | +10% $502 |
|---|---|---|---|---|---|
| Rent | -10% $444 | -5% $515 | +0% $585 | +5% $656 | +10% $727 |
| Rate | -1.0pp $646 | -0.5pp $616 | base $585 | +0.5pp $554 | +1.0pp $523 |
UW: 25.0% down · 7.5% · 30yr · 1.5% tax · 5.0% vac · 8.0% maint · 8.0% mgmt
Financing live
Cash to close
- Down payment
- $30,000
- Closing costs
- $3,600
- Reserves months
- —
- Total cash needed
- —
Loan-product check · same deal, 3 products live
Conventional
25% down · 7.5% · 30yr
- Down + closing
- —
- Monthly P&I
- —
- Monthly cashflow
- —
- DSCR
- —
- Eligible?
- —
Personal DTI + credit; lowest rate.
DSCR
20% down · 8.5% · 30yr
- Down + closing
- —
- Monthly P&I
- —
- Monthly cashflow
- —
- DSCR
- —
- Eligible?
- —
No personal income docs; deal must DSCR.
Hard money
10% down · 12.0% · 12mo
- Down + closing
- —
- Monthly P&I
- —
- Monthly cashflow
- —
- DSCR
- —
- Eligible?
- —
Short-term bridge; refi at stabilization.
Listing history 22 events
-
2026-06-21days on market $120,000 Active 405 DOM
-
2026-06-18days on market $120,000 Active 402 DOM
-
2026-06-17days on market $120,000 Active 401 DOM
-
2026-06-16days on market $120,000 Active 400 DOM
-
2026-06-15days on market $120,000 Active 399 DOM
-
2026-06-14days on market $120,000 Active 397 DOM
-
2026-06-13days on market $120,000 Active 396 DOM
-
2026-06-10days on market $120,000 Active 394 DOM
-
2026-06-09days on market $120,000 Active 393 DOM
-
2026-06-08days on market $120,000 Active 392 DOM
-
2026-06-07days on market $120,000 Active 391 DOM
-
2026-06-05days on market $120,000 Active 388 DOM
-
2026-06-03days on market $120,000 Active 387 DOM
-
2026-06-02days on market $120,000 Active 386 DOM
-
2026-06-01days on market $120,000 Active 385 DOM
-
2026-05-31days on market $120,000 Active 384 DOM
-
2026-05-31days on market $120,000 Active 383 DOM
-
2025-11-04status Back on Market 176-char remark
Show marketing remark (176 chars)
Pick your interior design in paint color and floor coverings. Property is sold as is with no seller's disclosure. the home has a nice setting between Sherwood and Jacksonville.
-
2025-11-01historical 176-char remark
Show marketing remark (176 chars)
Pick your interior design in paint color and floor coverings. Property is sold as is with no seller's disclosure. the home has a nice setting between Sherwood and Jacksonville.
-
2025-06-06status Back on Market 176-char remark
Show marketing remark (176 chars)
Pick your interior design in paint color and floor coverings. Property is sold as is with no seller's disclosure. the home has a nice setting between Sherwood and Jacksonville.
-
2025-05-20status Pending (FC, SS, REO) 176-char remark
Show marketing remark (176 chars)
Pick your interior design in paint color and floor coverings. Property is sold as is with no seller's disclosure. the home has a nice setting between Sherwood and Jacksonville.
-
2025-04-22$120,000 New Listing 176-char remark
Show marketing remark (176 chars)
Pick your interior design in paint color and floor coverings. Property is sold as is with no seller's disclosure. the home has a nice setting between Sherwood and Jacksonville.
ⓘ Source: listings_history table (triggers on properties + properties_extension) + one-shot
backfill from property_details.listing_events for pre-trigger history.
Climate risk First Street
- Flood 1/10 Low FEMA zone X (shaded) · 0% chance over 30 yrs
- Wildfire 3/10 Moderate
- Heat 6/10 Major 7 d/yr ≥110°F today · 18 d/yr by 30 yrs out
- Wind 4/10 Moderate 9% chance of damaging wind over 30 yrs
- Air quality 2/10 Low 2 unhealthy d/yr today · 2 by 30 yrs out
Nearby sold comps map
Loading sold comps map…
Walkable amenities ~0.75 mi
Loading nearby amenities…
Taxation est. · year 1
- Rental income
- $21,487
- − Mortgage interest
- −$6,722
- − Property taxes
- −$1,800
- − Insurance
- −$600
- − Repairs & maintenance
- −$1,719
- − Management
- −$1,719
- − Depreciation
- −$3,491
- Taxable income
- $5,436
- Est. tax owed @ 24.0%
- −$1,305
- After-tax cash flow
- $5,718/yr
For passive investors: Depreciation is non-cash, so a rental often shows a tax loss while cash-flowing — sheltering income. Rental losses are passive: they offset passive income freely, and up to $25,000/yr can offset ordinary (W-2) income if you actively participate and your MAGI is under $100k (phasing out to $0 by $150k); unused losses carry forward. On sale, claimed depreciation is recaptured at up to 25%, and gains may owe capital-gains tax (a 1031 exchange can defer both). Figures are a year-1 estimate at your 24.0% rate — not tax advice; consult a CPA.
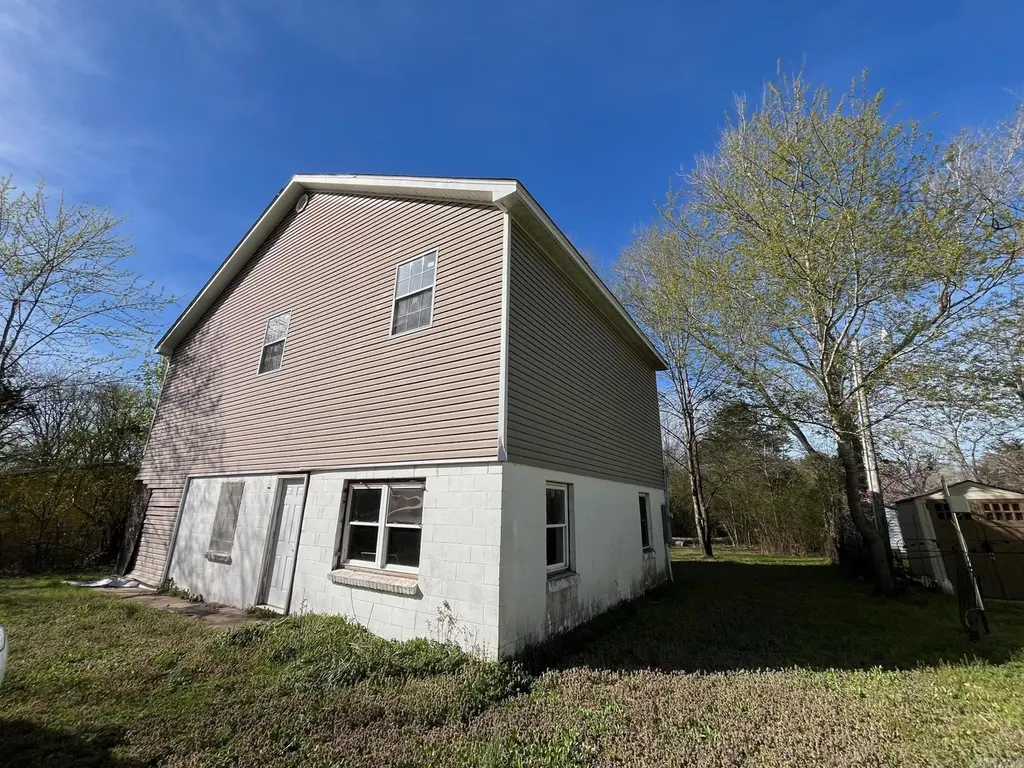
Condition & rehab AI · 2 photos
This property requires extensive repairs and maintenance, including new siding and windows, to become move-in ready.
Repairs flagged
- Major Peeling siding — Significant damage to exterior
- Major Exposed windows — Structural damage
Value-add opportunities
- Both New siding — Improves curb appeal and durability
- Both New windows — Enhances energy efficiency and safety
- Both Landscaping — Enhances curb appeal and property value
Renovation cost estimate screening
| Repair item | Severity | Est. cost |
|---|---|---|
| Peeling siding · Significant damage to exterior | Major | $15,000–50,000 |
| Exposed windows · Structural damage | Major | $15,000–50,000 |
| Total estimated repair cost · 2 items | $30,000–100,000 |
Value-add ROI direction
- Both New siding — Improves curb appeal and durability ↑
- Both New windows — Enhances energy efficiency and safety ↑
- Both Landscaping — Enhances curb appeal and property value ↑
ⓘ Cost ranges are severity-bucket heuristics (US national rule-of-thumb). Get contractor quotes + a written scope before underwriting a rehab budget.
Schools (NCES district)
- District
- Pulaski County Spec. School District
- NCES district ID
- 0511850
- Math proficiency
- 27% ▼ -13.00%
- Reading proficiency
- 31% ▼ -10.00%
- Median HH income
- $53,218
- Composite
- 25.67/100
- National rank
- #7394
- State rank
- #150 of 238 in AR
Livability — Sherwood
- Score
- 73/100
- State rank
- #19
- US rank
- #5246
Category grades
Schools grade is shown separately in the Schools card above.
Census & demographics
- County
- Pulaski County · 372,764 people
- City population
- 34,365
- Metro
- Little Rock-North Little Rock-Conway, AR
- Population (ZIP)
- 34,365
- Household income
- $76,598
- Rent vs Own
- Severe rent burden
- 774.0
Population outlook (Pulaski County) Hauer SSP2
- Today (2025)
- 415,378 people
- By 2030
- 423,720 · +2.0%
- By 2040
- 435,182 · +4.8%
- By 2050
- 440,904 · +6.1%
- By 2075
- 445,521 · +7.3%
- By 2100
- 419,173 · +0.9%
Race, ethnicity, and origin ACS 2023
- Neighborhood character
- Predominantly White (65%)
- Race & ethnicity
- White 65% Black 26% Two or more races 5% Hispanic / Latino 4% Asian 1%
- Common ancestry
- Lithuanian 2% Slovak 1% Italian 1%
- Foreign-born
- 2% · Canada, South Korea
- Languages at home
- 96% English-only · Spanish 2% Korean 1%
Political lean MEDSL · Pulaski
- 2024 margin
- Strong D (+22.1) · D 59.8% · R 37.7% · Other 2.5%
- 2008→2024 swing
- +10.6pp toward D · 2008: 11.6pp · 2024: 22.1pp
- All cycles
- 2024: D+22.1 2020: D+22.5 2016: D+17.9 2012: D+11.4 2008: D+11.6
Not yet ingested
- Civics
- —
Market trends
- HPI YoY
- ▼ -134.93%
- Current HPI
- 198.9456
- Rent YoY
- ▲ 4.81%
- Metro
- Little Rock-North Little Rock-Conway, AR
- State GDP YoY
- ▲ 3.80%
- F500 in state
- 10
Industry mix (Fortune 500 HQ in AR)
| Industry | F500 HQs | Revenue |
|---|---|---|
| Retail | 1 | $681B |
|
||
| Food / Agriculture | 1 | $53B |
|
||
| Retail / Energy | 1 | $22B |
|
||
| Transportation / Logistics | 1 | $12B |
|
||
| Energy | 1 | $4B |
|
||
Price history
5 events — show timeline
- 2025-11-04 Relisted — CARMLS
- 2025-11-01 Listing Removed — CARMLS
- 2025-06-06 Relisted — CARMLS
- 2025-05-20 Pending — CARMLS
- 2025-04-22 Listed $120,000 CARMLS
Cash-flow waterfall
monthlySold comps — $/sqft
last 12 mo · ≤1 miLoading sold comps…