 Fourplex
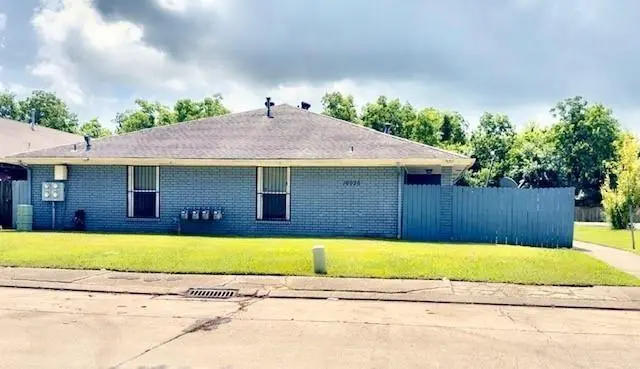
10920 Roger Dr · New Orleans, LA
Flood risk 8/10 · Major
- FEMA flood zone
- X (shaded)
- Chance of flooding over 30 yrs
- 0.6%
- Est. flood insurance / yr
- $507 – $1,088
Fire risk 1/10 · Minimal
- Est. fire insurance / yr
- $1,269 – $2,357
Heat risk 10/10 · Severe
- Hot days now (above 107°F)
- 7 days/yr
- Hot days in 30 yrs
- 21 days/yr
Wind risk 10/10 · Severe
- Chance of severe wind over 30 yrs
- 99.0%
Air-quality risk 3/10 · Minor
- Unhealthy air days now
- 3 days/yr
- Unhealthy air days in 30 yrs
- 3 days/yr
Risk factors via First Street. Map © Google.
Why this score? — see what drove the B- grade
The composite is a weighted blend of 9 inputs, each scored 0–100. Each bar is that input's sub-score; the figure is the points it added to the 100-point composite (weight × sub-score).
- Cash flow +30.0/30.0
- 1% rule +10.0/10.0
- DSCR +10.0/10.0
- ARV discount +4.8/15.0
- Livability +4.0/5.0
- Rent growth +2.5/5.0
- Condition / age +2.5/5.0
- Schools +1.6/10.0
- Appreciation +0.0/10.0
$325,000
🖨 Deal sheet 📄 Offer letter ✓ Due diligence
Multi-family units
County records classify this as Multi-Family (2-4 Unit). Listing-text estimate: 4 units. confirmed
Listing remarks MLS
This 4-unit quadplex features 8 bedrooms and 8 full bathrooms across approximately 4,869 square feet of living space. Currently generating approximately $4,938/month in rental income. Each unit has its own private entrance. Tenants enjoy off-street parking and a private patio. Solid build. Strong return. A smart move for investors looking for cash flow from day one. Whether you're expanding your portfolio or diving into real estate for the first time, this property delivers space, stability, and strong returns.
Key facts
- Private patio
- Private entrance
- Off-street parking
Tags
Neighborhood map
What this means for you Summary
Snapshot
- This is a 4 × 2-bed/2-bath units multifamily listed at $325k.
Deal economics
- At list price, monthly cash flow is $2k ($21k/yr) — positive. Per door: $443/mo.
- The deal already cash-flows at list — no discount required.
- Meets the 1% rule at list price ($5k rent vs $325k).
- Recommended offer: $306k (6.0% below list) — sets the bar for market timing.
- Cap rate 13.1% vs local median 4.4% in New Orleans — top-decile yield for the area; either an underpriced asset or a hidden risk that comps aren't pricing in. Stress-test before assuming the spread holds.
Location & tenants
- Location reads 81/100 on livability (#3 in LA, #1,383 nationally) — a professional / high-income tenant draw. Strengths: amenities A+, commute A+, health & safety A+; Watch: crime C-, employment D.
- Orleans Parish (urban): math 11% / reading 27% proficiency, ranked #69 of 98 in LA (top 70%) — low school quality limits family demand, transient renter base, plan for 1-2y turnover; 68% free/reduced lunch — lower-income household profile, screen leases tightly.
- Market conditions: 128 active listings in the ZIP; lower-income renter base — watch delinquency; 710 units permitted in Orleans Parish in 2024 (244 in 5+ unit buildings).
- At $4,930/mo this rent would consume 145% of the median local household income ($41k/yr) (locally 2030% of renters already pay >50% of income on rent) — very limited rent-growth headroom before tenants either downsize or default.
Forward outlook
- Local home prices are declining (-3.0%/yr); year-one equity from $2k of loan paydown is wiped out by about $10k of value loss. Plan a longer hold.
- Orleans County population projected at +61% by 2050 — long-run rental-demand tailwind backs the buy-and-hold thesis.
- At projected returns (-3.0% appreciation + 3.0% rent growth), your $91k cash investment doubles in ~6 years — after that, you're playing with house money.
Negotiation context
- It's been on market 85 days — a 6% lower offer ($306k) is reasonable based on typical stale-listing flexibility.
- 8 sale attempts since 31y ago with the ask held roughly flat each time — persistent listings suggest the price (not the market) is what's stuck; bring a comps-based counter.
- Current owner paid $70k; list at $325k implies a 364% gain — meaningful room to come down on a strong offer.
Risks & watch-outs
- Watch-outs: flood insurance adds $66/mo.
- Climate carrying-cost: severe flood risk; severe wind risk, 99% chance of damaging wind over 30y; extreme-heat days projected 7→21/yr by 2055 (HVAC capex compounding) — expect insurance premiums to compound above CPI over the hold.
Questions for the listing agent
- It's been on market 85 days. Have you received any prior offers? Is the seller open to a 6% concession, seller financing, or rate buy-down credit?
- Can we see the unit-by-unit rent roll, current vacancy, and any below-market leases? What's the average tenancy length?
- What capital expenditures (roof, boiler, parking lot, exteriors) have been made in the last 5 years, and what's planned in the next 2?
- Built in 1970 — when were the roof, HVAC, electrical panel, plumbing, and water heater last replaced?
- What's the actual annual flood-insurance premium (NFIP or private), and is the property in a SFHA with mandatory coverage?
- Why hasn't it sold? Are there any deal-killer items the seller is aware of (foundation, flood, title, zoning, code violations)?
- Is there a deadline driving the sale (1031 exchange, divorce, estate, relocation)? That informs how much negotiation room exists.
- What's the average days-on-market for RENTAL listings here right now (not sales)? A rising rental-DOM trend means longer vacancies and softer asking-rent achievability than the comps imply.
- What's the recent tenant-quality profile in this submarket — average credit score on applications, eviction rate, late-payment / NSF rate, and stable-employment percentage? A property-management company in the area should have these aggregated.
- How much new apartment / multifamily construction is in the pipeline within 1–3 miles? Heavy new supply (>2% of stock underway) typically softens rents 12–24 months out; light construction supports rent growth.
Investment metrics
- 1% rule
- 1.52% ✓
- Cap rate
- 13.08%
- Cash-on-cash
- 24.24%
- DSCR
- 2.08
- GRM
- 5.5
CMA / ARV
- ARV (median comp)
- $306,368
- List price
- $325,000
- Delta
- 6.08%
- Verdict
- FAIR
- Comps
- 9 within 1.0 mi
Show comp detail 1 sale within ~0.75 mi
| Address | Dist | Beds/Ba | Sqft | Sold | Price | $/sf | Match |
|---|---|---|---|---|---|---|---|
| 10940 Roger Dr | 0.03mi | 8/6.0 | 5,030 (+7%) | 0mo | $241,000 | $48 | 78 |
Match score weights: distance 35% · size 25% · config 20% · recency 20%. Top-matched comps best support the ARV.
Projected returns pro-forma
-3.0% appreciation · 3.0% rent growth · sell at horizon
- IRR
- 16.4%
- Equity multiple
- 1.66×
- Total profit
- $60,168
- Equity at exit
- $48,459
- IRR
- 25.0%
- Equity multiple
- 3.17×
- Total profit
- $197,679
- Equity at exit
- $28,100
Cash invested: $91,000 (down + closing). Projections, not guarantees.
Landlord ↔ Tenant lean methodology
- Overall (STATE)
- 90 Strongly Landlord-Friendly
- State Louisiana
- 90 Strongly Landlord-Friendly · R+12
- County
- — inherits STATE
- City
- — inherits STATE
ZIP-level market 70127
- Home prices YoY
- -29.2%
- Active inventory
- 128
- Price-to-rent
- 22.0×
Monthly cashflow live
- Estimated rent
- $4,930 high interval (Pro) →
- Mortgage (P&I)
- −$1,704
- Tax from tax record
- −$217 /mo · $2,603/yr
- Insurance
- −$135
- Flood insurance flood zone
- −$66 /mo · $798/yr
- HOA
- −$0
- Vacancy / Maint / Mgmt
- −$1,035
- Net cashflow
- $1,772
Break-even live
4-unit breakdown (identical units grouped — click to expand)
| Units | Beds | Baths | Est. rent |
|---|---|---|---|
| 4× units | 2 | 2 | $4,928 |
| #1 | 2 | 2 | $1,232 |
| #2 | 2 | 2 | $1,232 |
| #3 | 2 | 2 | $1,232 |
| #4 | 2 | 2 | $1,232 |
| Total (4 units) | $4,930 | ||
UW: 25.0% down · 7.5% · 30yr · 1.5% tax · 5.0% vac · 8.0% maint · 8.0% mgmt
Financing live
Cash to close
- Down payment
- $81,250
- Closing costs
- $9,750
- Reserves months
- —
- Total cash needed
- —
Loan-product check · same deal, 3 products live
Conventional
25% down · 7.5% · 30yr
- Down + closing
- —
- Monthly P&I
- —
- Monthly cashflow
- —
- DSCR
- —
- Eligible?
- —
Personal DTI + credit; lowest rate.
DSCR
20% down · 8.5% · 30yr
- Down + closing
- —
- Monthly P&I
- —
- Monthly cashflow
- —
- DSCR
- —
- Eligible?
- —
No personal income docs; deal must DSCR.
Hard money
10% down · 12.0% · 12mo
- Down + closing
- —
- Monthly P&I
- —
- Monthly cashflow
- —
- DSCR
- —
- Eligible?
- —
Short-term bridge; refi at stabilization.
Listing history 27 events
-
2026-06-13statusdays on market $325,000 Pending 85 DOM
-
2026-06-10days on market $325,000 Active 83 DOM
-
2026-06-09days on market $325,000 Active 82 DOM
-
2026-06-08days on market $325,000 Active 81 DOM
-
2026-06-07days on market $325,000 Active 80 DOM
-
2026-06-05days on market $325,000 Active 77 DOM
-
2026-06-03days on market $325,000 Active 76 DOM
-
2026-06-02days on market $325,000 Active 75 DOM
-
2026-06-01days on market $325,000 Active 74 DOM
-
2026-05-31days on market $325,000 Active 73 DOM
-
2026-03-19$325,000 Active 516-char remark
Show marketing remark (516 chars)
This 4-unit quadplex features 8 bedrooms and 8 full bathrooms across approximately 4,869 square feet of living space. Currently generating approximately $4,938/month in rental income. Each unit has its own private entrance. Tenants enjoy off-street parking and a private patio. Solid build. Strong return. A smart move for investors looking for cash flow from day one. Whether you're expanding your portfolio or diving into real estate for the first time, this property delivers space, stability, and strong returns.
-
2025-07-15$290,000 Active
-
2024-07-03price $305,000
-
2024-06-04price $315,000
-
2024-04-17price $325,000
-
2024-04-04price $334,999
-
2024-03-13$305,000
-
2006-10-19soldstatus $70,000
-
2001-07-02soldstatus $130,000
-
2001-07-02soldstatus $130,000
-
2001-04-18$130,000
-
2001-04-18$130,000
-
1995-05-08soldstatus $81,000
-
1995-05-08$81,000
-
1995-05-08$81,000
-
1995-05-08soldstatus $81,000
ⓘ Source: listings_history table (triggers on properties + properties_extension) + one-shot
backfill from property_details.listing_events for pre-trigger history.
Tax reassessment forecast LA · Resets to sale price
- Current annual tax
- $2,603 · $217/mo
- Projected year-2 tax
- $2,603 · $217/mo
- Expected delta
- $0/yr ($0/mo · 0.0%)
ⓘ Screening estimate from a state-policy table — verify with the county assessor before closing.
Climate risk First Street
- Flood 8/10 Severe FEMA zone X (shaded) · 60% chance over 30 yrs
- Wildfire 1/10 Low
- Heat 10/10 Extreme 7 d/yr ≥107°F today · 21 d/yr by 30 yrs out
- Wind 10/10 Extreme 99% chance of damaging wind over 30 yrs
- Air quality 3/10 Moderate 3 unhealthy d/yr today · 3 by 30 yrs out
Nearby sold comps map
Loading sold comps map…
Walkable amenities ~0.75 mi
Loading nearby amenities…
Taxation est. · year 1
- Rental income
- $59,160
- − Mortgage interest
- −$18,205
- − Property taxes
- −$2,603
- − Insurance
- −$2,422
- − Repairs & maintenance
- −$4,733
- − Management
- −$4,733
- − Depreciation
- −$9,455
- Taxable income
- $17,009
- Est. tax owed @ 24.0%
- −$4,082
- After-tax cash flow
- $17,177/yr
For passive investors: Depreciation is non-cash, so a rental often shows a tax loss while cash-flowing — sheltering income. Rental losses are passive: they offset passive income freely, and up to $25,000/yr can offset ordinary (W-2) income if you actively participate and your MAGI is under $100k (phasing out to $0 by $150k); unused losses carry forward. On sale, claimed depreciation is recaptured at up to 25%, and gains may owe capital-gains tax (a 1031 exchange can defer both). Figures are a year-1 estimate at your 24.0% rate — not tax advice; consult a CPA.
Schools (NCES district)
- District
- Orleans Parish
- NCES district ID
- 2201170
- Math proficiency
- 11% ▼ -52.00%
- Reading proficiency
- 27% ▼ -46.00%
- Median HH income
- $37,011
- Composite
- 15.78/100
- National rank
- #9271
- State rank
- #69 of 98 in LA
Livability — New Orleans
- Score
- 81/100
- State rank
- #3
- US rank
- #1383
Category grades
Schools grade is shown separately in the Schools card above.
Census & demographics
- Census place
- New Orleans, LA
- County
- Orleans Parish · 338,817 people
- City population
- 338,817
- Metro
- New Orleans-Metairie, LA
- Population (ZIP)
- 23,107
- Household income
- $40,765
- Rent vs Own
- Severe rent burden
- 2030.0
Population outlook (Orleans County) Hauer SSP2
- Today (2025)
- 513,025 people
- By 2030
- 575,781 · +12.2%
- By 2040
- 700,174 · +36.5%
- By 2050
- 826,541 · +61.1%
- By 2075
- 1,123,374 · +119.0%
- By 2100
- 1,355,609 · +164.2%
Race, ethnicity, and origin ACS 2023
- Neighborhood character
- Predominantly Black (91%)
- Race & ethnicity
- Black 91% Hispanic / Latino 4% Two or more races 4% White 2%
- Common ancestry
- Lithuanian 1% Hispanic 1%
- Foreign-born
- 3% · Canada, Vietnam
- Languages at home
- 96% English-only · Spanish 2%
Political lean MEDSL · Orleans
- 2024 margin
- Solid D (+67.0) · D 82.2% · R 15.2% · Other 2.7%
- 2008→2024 swing
- +6.7pp toward D · 2008: 60.3pp · 2024: 67.0pp
- All cycles
- 2024: D+67.0 2020: D+68.2 2016: D+66.2 2012: D+62.5 2008: D+60.3
Not yet ingested
- Civics
- —
Market trends
- HPI YoY
- ▼ -72.43%
- Current HPI
- 175.4465
- Rent YoY
- —
- Metro
- New Orleans-Metairie, LA
- State GDP YoY
- ▲ 3.29%
- F500 in state
- 10
Industry mix (Fortune 500 HQ in LA)
| Industry | F500 HQs | Revenue |
|---|---|---|
| Telecommunications | 2 | $23B |
|
||
| Utilities | 1 | $12B |
|
||
| Wholesale / Distribution | 1 | $5B |
|
||
| Advertising | 1 | $2B |
|
||
Price history
+301.2% since first listed17 events — show timeline
- 2026-03-19 Listed $325,000 AcadianaMLS
- 2026-03-19 Listed $325,000 GSREIN
- 2025-07-15 Listed $290,000 AcadianaMLS
- 2024-07-03 Price Changed $305,000 GSREIN
- 2024-06-04 Price Changed $315,000 GSREIN
- 2024-04-17 Price Changed $325,000 GSREIN
- 2024-04-04 Price Changed $334,999 GSREIN
- 2024-03-13 Listed $305,000 AcadianaMLS
- 2006-10-19 Sold (Public Records) $70,000 Public Records
- 2001-07-02 Sold (Public Records) $130,000 Public Records
- 2001-07-02 Sold (MLS) $130,000 GSREIN
- 2001-04-18 Listed $130,000 GSREIN
- 2001-04-18 Listed $130,000 AcadianaMLS
- 1995-05-08 Sold (Public Records) $81,000 Public Records
- 1995-05-08 Listed $81,000 GSREIN
- 1995-05-08 Listed $81,000 AcadianaMLS
- 1995-05-08 Sold (MLS) $81,000 GSREIN
Property tax history
+0.8%/yrLatest (2026): $2,603 · +1.1% YoY. Source: county tax records.
Cash-flow waterfall
monthlySold comps — $/sqft
last 12 mo · ≤1 miLoading sold comps…