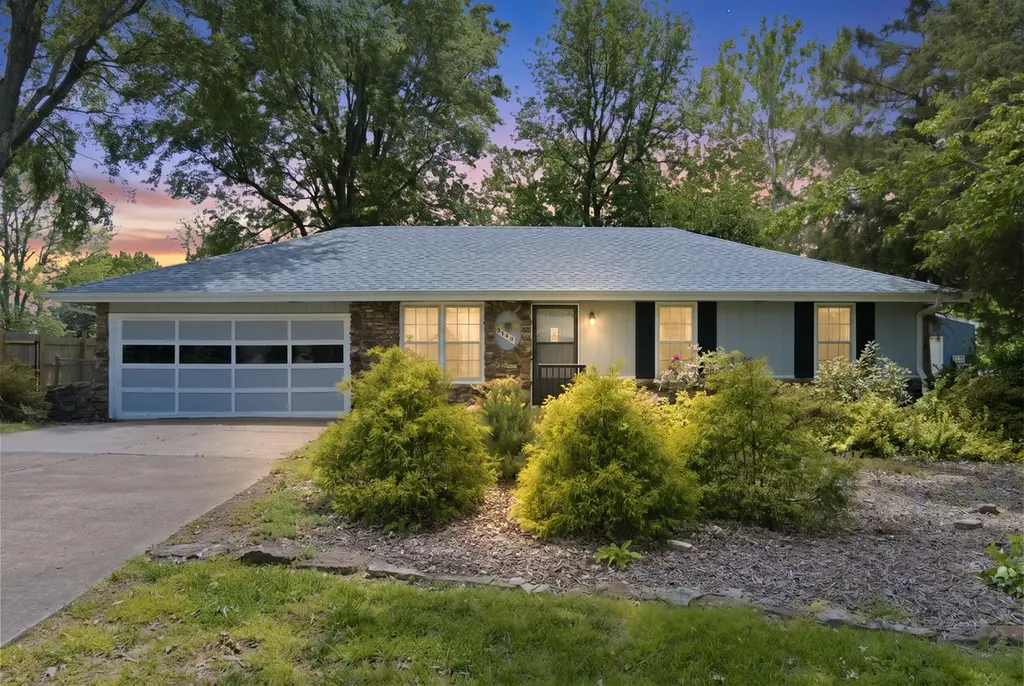
3140 W Wick St · Battlefield, MO
Flood risk 1/10 · Minimal
- FEMA flood zone
- X (unshaded)
- Chance of flooding over 30 yrs
- 0.0%
- Est. flood insurance / yr
- $507 – $1,088
Fire risk 2/10 · Minimal
- Est. fire insurance / yr
- $1,054 – $1,958
Heat risk 5/10 · Moderate
- Hot days now (above 105°F)
- 7 days/yr
- Hot days in 30 yrs
- 19 days/yr
Wind risk 2/10 · Minimal
- Chance of severe wind over 30 yrs
- 1.0%
Air-quality risk 1/10 · Minimal
- Unhealthy air days now
- 0 days/yr
- Unhealthy air days in 30 yrs
- 0 days/yr
Risk factors via First Street. Map © Google.
Why this score? — see what drove the B- grade
The composite is a weighted blend of 9 inputs, each scored 0–100. Each bar is that input's sub-score; the figure is the points it added to the 100-point composite (weight × sub-score).
- Cash flow +25.9/30.0
- ARV discount +15.0/15.0
- DSCR +8.7/10.0
- 1% rule +6.0/10.0
- Livability +4.0/5.0
- Schools +3.2/10.0
- Rent growth +3.1/5.0
- Condition / age +2.5/5.0
- Appreciation +0.0/10.0
$189,999
🖨 Deal sheet 📄 Offer letter ✓ Due diligence
Listing remarks
Welcome to 3140 W Wick Street in Springfield MO. This 3 bedroom, 1.5 bathroom home offers timeless character and quality craftsmanship in a prime south Springfield location. Conveniently located south of Republic Road and north of Weaver, you are just minutes from Highway 60, Highway 160, shopping, restaurants, groceries, and hospitals. Located in the highly desirable Kickapoo High School district with Cherokee Middle School and Wilson/Harrison Elementary nearby. Built in 1973, this home was built to last and features beautiful curb appeal, mature landscaping, a 1 year old roof, and a spacious 2 car garage. Inside you will find unique light fixtures, polished trim work, wood paneling, and a
Key facts
- Kitchen cabinetry
- Polished trim work
- 1 year old roof
Tags
Property features AI
Exterior
- Parking: 2-car garage with garage door opener; Driveway; Garage faces front
- Security: Smoke detectors; Carbon monoxide detectors; Accessible entrance and grip-accessible features
- Utilities: Public water; Public sewer
- Home design: Single family residence; One story; Wood siding
- Construction: Asphalt roof; Permanent foundation; Built with wood siding
- Exterior features: Rain gutters; Chain link fencing; Shed(s); Few trees on lot; City street frontage; Asphalt and concrete road surfaces (public maintained road)
Interior
- Kitchen: Electric cooktop; Gas cooktop; Convection oven; Garbage disposal; Electric water heater
- Bedrooms: Bedrooms with walk-in closet(s)
- Flooring: Carpet; Linoleum
- Bathrooms: One full bathroom; One half bathroom
- Heating & cooling: Central heating (natural gas); Fireplace(s) for supplemental heat; Central air conditioning; Ceiling fans
- Interior features: Laminate countertops; Walk-in closets; Window coverings including drapes and blinds; Family room fireplace
- Laundry & utility: Main level laundry
Neighborhood map
What this means for you Summary
Snapshot
- This is a 3-bed/1.5-bath single-family listed at $190k.
Deal economics
- At list price, monthly cash flow is $468 ($6k/yr) — positive.
- The deal already cash-flows at list — no discount required.
- Meets the 1% rule at list price ($2k rent vs $190k).
- Cap rate 9.2% vs local median 3.1% in Battlefield — top-decile yield for the area; either an underpriced asset or a hidden risk that comps aren't pricing in. Stress-test before assuming the spread holds.
Location & tenants
- Location reads 79/100 on livability (#24 in MO, #2,245 nationally) — a middle-class / working-renter tenant base. Strengths: crime A+, cost of living A+, housing A+; Watch: amenities F, commute F.
- Springfield R-XII (urban): math 32% / reading 46% proficiency, ranked #174 of 324 in MO (top 54%) — families likely to look elsewhere, expect single-tenant / working-renter base with shorter leases.
- Zoned schools: Cherokee Middle (math 50% / reading 62%, grade B-, #40 of 391 statewide, top 10%, 758 students, 27% FRL); Kickapoo High (math 39% / reading 66%, grade C-, #89 of 521 statewide, top 17%, 1,881 students, 26% FRL) — zoned schools average 27% FRL vs 46% district-wide (20 pts lower); this property's tenant base skews higher-income than the district average.
- Zoned-school proficiency averages 54% at this address vs 39% district-wide (+15 pts) — the actual schools serving this property are materially stronger than the Springfield R-XII average implies; a family-tenant draw the district grade alone would hide.
- Market conditions: Rents rising (+2.5%/yr); 250 active listings in the ZIP; 3 comparable units currently listed for rent nearby; rentals leasing fast (median 14d on market — plan ~1-2 weeks tenant-placement turnaround); solid renter incomes; 1,302 units permitted in Greene County in 2024 (250 in 5+ unit buildings).
Forward outlook
- Local home prices are declining (-3.0%/yr); year-one equity from $1k of loan paydown is wiped out by about $6k of value loss. Plan a longer hold.
- Greene County population projected at +25% by 2050 — long-run rental-demand tailwind backs the buy-and-hold thesis.
Negotiation context
- Only 1 days on market — expect competitive offers; lowballing is unlikely to land.
Risks & watch-outs
- Climate carrying-cost: extreme-heat days projected 7→19/yr by 2055 (HVAC capex compounding) — expect insurance premiums to compound above CPI over the hold.
Questions for the listing agent
- Built in 1973 — when were the roof, HVAC, electrical panel, plumbing, and water heater last replaced?
- Is there a deadline driving the sale (1031 exchange, divorce, estate, relocation)? That informs how much negotiation room exists.
- Schools are A-rated — typically a magnet for longer-tenancy family renters. What's the average tenant stay here, and is there a school-zone premium baked into asking?
- What's the average days-on-market for RENTAL listings here right now (not sales)? A rising rental-DOM trend means longer vacancies and softer asking-rent achievability than the comps imply.
- What's the recent tenant-quality profile in this submarket — average credit score on applications, eviction rate, late-payment / NSF rate, and stable-employment percentage? A property-management company in the area should have these aggregated.
- How much new for-sale + rental construction is in the pipeline within 1–3 miles? Heavy new supply typically softens prices + rents 12–24 months out; constrained supply supports both.
Investment metrics
- 1% rule
- 1.10% ✓
- Cap rate
- 9.25%
- Cash-on-cash
- 10.55%
- DSCR
- 1.47
- GRM
- 7.6
CMA / ARV
- ARV (on-the-fly)
- $228,144
- Comps found
- 12
Show comp detail 12 sales within ~0.75 mi
| Address | Dist | Beds/Ba | Sqft | Sold | Price | $/sf | Match |
|---|---|---|---|---|---|---|---|
| 3122 W Edward St | 0.07mi | 3/1.5 | 1,282 (-6%) | 2mo | $165,000 | $129 | 86 |
| 4941 S James Ave | 0.16mi | 3/2.0 | 1,372 (+1%) | 6mo | $224,900 | $164 | 84 |
| 3045 W Darby St | 0.50mi | 3/2.0 | 1,368 (+1%) | 2mo | $230,000 | $168 | 72 |
| 3432 W Shawnee Dr | 0.65mi | 3/2.0 | 1,347 (-1%) | 7mo | $249,900 | $186 | 61 |
| 3050 W Village Ter | 0.51mi | 3/2.0 | 1,309 (-4%) | 10mo | $224,900 | $172 | 60 |
| 3020 W Buena Vista St | 0.58mi | 3/2.0 | 1,278 (-6%) | 6mo | $225,000 | $176 | 56 |
| 2929 W Melbourne St | 0.68mi | 3/2.0 | 1,310 (-4%) | 8mo | $219,900 | $168 | 54 |
| 3539 W Vincent Dr | 0.67mi | 3/2.0 | 1,456 (+7%) | 6mo | $237,500 | $163 | 50 |
| 2951 W Camino Alto St | 0.72mi | 3/2.0 | 1,423 (+5%) | 10mo | $249,900 | $176 | 48 |
| 3119 W Melbourne St | 0.61mi | 3/2.0 | 1,520 (+12%) | 5mo | $299,900 | $197 | 45 |
| 3004 W Knob Hill St | 0.72mi | 3/2.0 | 1,486 (+9%) | 7mo | $215,000 | $145 | 43 |
| 5020 Aspen Dr | 0.65mi | 3/2.0 | 1,510 (+11%) | 9mo | $250,000 | $166 | 42 |
Match score weights: distance 35% · size 25% · config 20% · recency 20%. Top-matched comps best support the ARV.
Projected returns pro-forma
-3.0% appreciation · 2.53% rent growth · sell at horizon
- IRR
- -1.0%
- Equity multiple
- 0.96×
- Total profit
- $-2,036
- Equity at exit
- $28,329
- IRR
- 8.2%
- Equity multiple
- 1.61×
- Total profit
- $32,383
- Equity at exit
- $16,428
Cash invested: $53,200 (down + closing). Projections, not guarantees.
Landlord ↔ Tenant lean methodology
- Overall (STATE)
- 81 Strongly Landlord-Friendly
- State Missouri
- 81 Strongly Landlord-Friendly · R+10
- County
- — inherits STATE
- City
- — inherits STATE
ZIP-level market 65810
- Home prices YoY
- -28.8%
- Rents YoY
- 2.5%
- Active inventory
- 250
- Price-to-rent
- 7.6×
Monthly cashflow live
- Estimated rent
- $2,082 medium interval (Pro) →
- Mortgage (P&I)
- −$996
- Tax from tax record
- −$102 /mo · $1,221/yr
- Insurance
- −$79
- HOA
- −$0
- Vacancy / Maint / Mgmt
- −$437
- Net cashflow
- $468
Break-even live
UW: 25.0% down · 7.5% · 30yr · 1.5% tax · 5.0% vac · 8.0% maint · 8.0% mgmt
Financing live
Cash to close
- Down payment
- $47,500
- Closing costs
- $5,700
- Reserves months
- —
- Total cash needed
- —
Loan-product check · same deal, 3 products live
Conventional
25% down · 7.5% · 30yr
- Down + closing
- —
- Monthly P&I
- —
- Monthly cashflow
- —
- DSCR
- —
- Eligible?
- —
Personal DTI + credit; lowest rate.
DSCR
20% down · 8.5% · 30yr
- Down + closing
- —
- Monthly P&I
- —
- Monthly cashflow
- —
- DSCR
- —
- Eligible?
- —
No personal income docs; deal must DSCR.
Hard money
10% down · 12.0% · 12mo
- Down + closing
- —
- Monthly P&I
- —
- Monthly cashflow
- —
- DSCR
- —
- Eligible?
- —
Short-term bridge; refi at stabilization.
Rent comps 3 comps
| Address | Beds | Baths | Sqft | Rent | $/sqft | DOM | Units | Dist |
|---|---|---|---|---|---|---|---|---|
| 4159 S El Salvador Ave Springfield, MO | 2.0 | 2.0 | 1129 | $1,095 | $0.97 | 13d | 1 | 1.11mi |
| 2183 W Arlington St Springfield, MO | 3.0 | 2.0 | 1850 | $1,995 | $1.08 | 23d | 1 | 1.13mi |
| 5773 Trailside Cir W Springfield, MO | 2.0–3.0 | 2.0–2.5 | 1688 | $3,195 | $1.89 | 13d | 4 | 1.37mi |
Listing history 2 events
-
2026-05-11status Pending
-
2026-05-09$189,999 Active
ⓘ Source: listings_history table (triggers on properties + properties_extension) + one-shot
backfill from property_details.listing_events for pre-trigger history.
Tax reassessment forecast MO · Resets to sale price
- Current annual tax
- $1,221 · $102/mo
- Projected year-2 tax
- $1,843 · $154/mo
- Expected delta
- +$622/yr (+$52/mo · 51.0%)
ⓘ Screening estimate from a state-policy table — verify with the county assessor before closing.
Climate risk First Street
- Flood 1/10 Low FEMA zone X (unshaded) · 0% chance over 30 yrs
- Wildfire 2/10 Low
- Heat 5/10 Major 7 d/yr ≥105°F today · 19 d/yr by 30 yrs out
- Wind 2/10 Low 100% chance of damaging wind over 30 yrs
- Air quality 1/10 Low 0 unhealthy d/yr today · 0 by 30 yrs out
Nearby sold comps map
Loading sold comps map…
Walkable amenities ~0.75 mi
Loading nearby amenities…
Taxation est. · year 1
- Rental income
- $24,986
- − Mortgage interest
- −$10,643
- − Property taxes
- −$1,221
- − Insurance
- −$950
- − Repairs & maintenance
- −$1,999
- − Management
- −$1,999
- − Depreciation
- −$5,527
- Taxable income
- $2,647
- Est. tax owed @ 24.0%
- −$635
- After-tax cash flow
- $4,976/yr
For passive investors: Depreciation is non-cash, so a rental often shows a tax loss while cash-flowing — sheltering income. Rental losses are passive: they offset passive income freely, and up to $25,000/yr can offset ordinary (W-2) income if you actively participate and your MAGI is under $100k (phasing out to $0 by $150k); unused losses carry forward. On sale, claimed depreciation is recaptured at up to 25%, and gains may owe capital-gains tax (a 1031 exchange can defer both). Figures are a year-1 estimate at your 24.0% rate — not tax advice; consult a CPA.
Schools (NCES district)
- District
- Springfield R-XII
- NCES district ID
- 2928860
- Math proficiency
- 32% ▼ -2.00%
- Reading proficiency
- 46% ▼ -3.00%
- Median HH income
- $37,886
- Composite
- 32.45/100
- National rank
- #5717
- State rank
- #174 of 324 in MO
Livability — Battlefield
- Score
- 79/100
- State rank
- #24
- US rank
- #2245
Category grades
Schools grade is shown separately in the Schools card above.
Census & demographics
- County
- Greene County · 244,327 people
- Metro
- Springfield, MO
- Population (ZIP)
- 22,137
- Household income
- $95,160
- Rent vs Own
- Severe rent burden
- 437.0
Population outlook (Greene County) Hauer SSP2
- Today (2025)
- 319,054 people
- By 2030
- 335,135 · +5.0%
- By 2040
- 366,186 · +14.8%
- By 2050
- 397,431 · +24.6%
- By 2075
- 477,035 · +49.5%
- By 2100
- 520,828 · +63.2%
Race, ethnicity, and origin ACS 2023
- Neighborhood character
- Predominantly White (89%)
- Race & ethnicity
- White 89% Two or more races 4% Hispanic / Latino 3% Asian 3% Black 2%
- Common ancestry
- Italian 4% Lithuanian 3% Portuguese 3%
- Foreign-born
- 4% · Vietnam, China, Canada
- Languages at home
- 95% English-only · Other Indo-European 1% Spanish 1% Chinese 1%
Political lean MEDSL · Greene
- 2024 margin
- Strong R (+20.8) · D 38.9% · R 59.7% · Other 1.4%
- 2008→2024 swing
- -5.0pp toward R · 2008: -15.8pp · 2024: -20.8pp
- All cycles
- 2024: R+20.8 2020: R+20.1 2016: R+27.4 2012: R+24.4 2008: R+15.8
Not yet ingested
- Civics
- —
Market trends
- HPI YoY
- ▼ -78.67%
- Current HPI
- 194.8736
- Rent YoY
- ▲ 2.53%
- Metro
- Springfield, MO
- State GDP YoY
- ▲ 1.84%
- F500 in state
- 20
Industry mix (Fortune 500 HQ in MO)
| Industry | F500 HQs | Revenue |
|---|---|---|
| Healthcare | 1 | $163B |
|
||
| Insurance | 1 | $21B |
|
||
| Industrial Technology | 1 | $17B |
|
||
| Retail | 1 | $16B |
|
||
| Industrial Distribution | 1 | $10B |
|
||
| Utilities | 1 | $9B |
|
||
Price history
2 events — show timeline
- 2026-05-11 Pending — SOMO
- 2026-05-09 Listed $189,999 SOMO
Property tax history
+4.0%/yrLatest (2025): $1,221 · +0.0% YoY. Source: county tax records.
Cash-flow waterfall
monthlySold comps — $/sqft
last 12 mo · ≤1 miLoading sold comps…