13393 Mariposa #181 · Victorville, CA
Flood risk 6/10 · Moderate
- FEMA flood zone
- X (unshaded)
- Chance of flooding over 30 yrs
- 0.67%
- Est. flood insurance / yr
- $507 – $1,088
Fire risk 1/10 · Minimal
- Est. fire insurance / yr
- $659 – $1,223
Heat risk 7/10 · Major
- Hot days now (above 99°F)
- 3 days/yr
- Hot days in 30 yrs
- 8 days/yr
Wind risk 1/10 · Minimal
- Chance of severe wind over 30 yrs
- —
Air-quality risk 9/10 · Severe
- Unhealthy air days now
- 22 days/yr
- Unhealthy air days in 30 yrs
- 28 days/yr
Risk factors via First Street. Map © Google.
Why this score? — see what drove the B+ grade
The composite is a weighted blend of 9 inputs, each scored 0–100. Each bar is that input's sub-score; the figure is the points it added to the 100-point composite (weight × sub-score).
- Cash flow +30.0/30.0
- ARV discount +15.0/15.0
- 1% rule +10.0/10.0
- DSCR +10.0/10.0
- Rent growth +3.6/5.0
- Livability +2.7/5.0
- Condition / age +2.5/5.0
- Schools +2.2/10.0
- Appreciation +0.0/10.0
$70,000
🖨 Deal sheet (PDF) 📄 Offer letter ✓ Due diligence
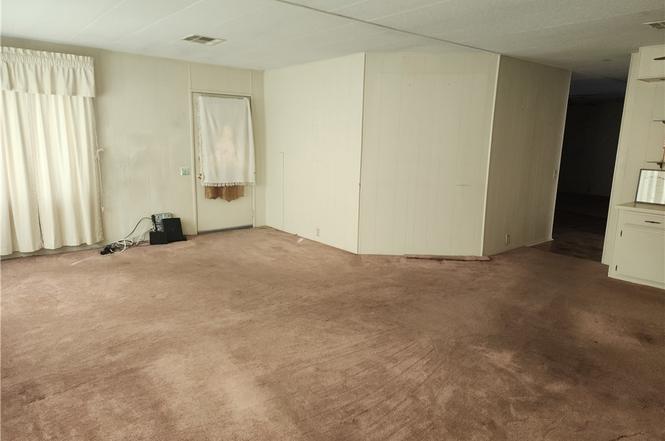
Listing remarks
MUST have a park approval for this community . .. Owner anxious to sell. Come see this home, located in a Senior Living Park. Spacious 2 bedroom 2 bath unit, has plenty of cabinet space, Inside laundry, large windows for plenty of lighting from outside, Vinyl fence around unit. Rock landscaped in rear, Has a large full length Inclosed area, Vinyl flooring appealing to the eye. Central heat and air, Carpet through out. separate dining area, Resort style amenities- Pool, Spa, Clubhouse, Library, games for seniors, Gated community. This unit is also located close to the main Office, Central to shopping and other city amenities. Seller very motivated. Bring your offers and Move in soon. Please
Key facts
- Large windows
- Vinyl flooring
- Rock landscaped
Tags
Property features AI
Finance
- Other: Manager approval required for residency; Pets: contact manager for policy
- Financial info: Land lease amount: $780 (monthly)
- HOA & community: Senior community; Land lease for the space (land lease amount applies)
Exterior
- Parking: Located in the VictorVilla park
- Utilities: Public/district water; Public sewer; Cable available
- Home design: Single-story (one level); Mobile home remains on site; Located in Victor Villa MHP; North of Nisqually Road from the 215 freeway (approximate directions)
- Construction: Mobile home dimensions approximately 36' x 81'; Double body type (multi-section mobile)
- Exterior features: Community pool; Curbs, sidewalks, and dog park in the community
Interior
- Kitchen: Electric range
- Bedrooms: All bedrooms located on the ground level
- Flooring: Vinyl flooring; Laminate flooring
- Bathrooms: 2 full bathrooms; Bathrooms include showers and exhaust fans
- Heating & cooling: Central heating (furnace); Central cooling and wall/window unit(s)
- Interior features: Formal entry; All bedrooms on one level; Front door entry; One-story home
- Laundry & utility: Inside laundry area
Neighborhood map
What this means for you Summary
Snapshot
- This is a 2-bed/2.0-bath manufactured listed at $70k.
Deal economics
- At list price, monthly cash flow is $1k ($14k/yr) — positive.
- The deal already cash-flows at list — no discount required.
- Meets the 1% rule at list price ($2k rent vs $70k).
- Recommended offer: $62k (12.0% below list) — sets the bar for market timing.
- Cap rate 26.2% vs local median 4.2% in Victorville — top-decile yield for the area; either an underpriced asset or a hidden risk that comps aren't pricing in. Stress-test before assuming the spread holds.
Location & tenants
- Location reads 54/100 on livability (#906 in CA) — a working-class tenant base; expect higher turnover. Strengths: housing A+; Watch: employment D+, schools D-, crime F.
- Victor Elementary (urban): math 25% / reading 25% proficiency, ranked #408 of 517 in CA (top 79%) — low school quality limits family demand, transient renter base, plan for 1-2y turnover; 70% free/reduced lunch — lower-income household profile, screen leases tightly.
- Market conditions: Rents rising fast (+4.3%/yr); 284 active listings in the ZIP; 12 comparable units currently listed for rent nearby; rentals leasing fast (median 0d on market — plan ~1-2 weeks tenant-placement turnaround); 5,458 units permitted in San Bernardino County in 2024 (1,500 in 5+ unit buildings).
- This rent runs 40% of the median local income ($62k/yr) — at the standard rent-burdened threshold; future hikes will face affordability resistance.
Forward outlook
- Local home prices are declining (-3.0%/yr); year-one equity from $484 of loan paydown is wiped out by about $2k of value loss. Plan a longer hold.
- San Bernardino County population projected at +15% by 2050 — modest demand growth; plan on rents tracking national, not racing it.
- At projected returns (-3.0% appreciation + 4.3% rent growth), your $20k cash investment doubles in ~2 years — after that, you're playing with house money.
Negotiation context
- It's been on market 132 days — a 12% lower offer ($62k) is reasonable based on typical stale-listing flexibility.
- 3 sale attempts with the ask held roughly flat each time — persistent listings suggest the price (not the market) is what's stuck; bring a comps-based counter.
Risks & watch-outs
- Climate carrying-cost: major flood risk; extreme-heat days projected 3→8/yr by 2055 (HVAC capex compounding) — expect insurance premiums to compound above CPI over the hold.
Questions for the listing agent
- It's been on market 132 days. Have you received any prior offers? Is the seller open to a 12% concession, seller financing, or rate buy-down credit?
- Built in 1976 — when were the roof, HVAC, electrical panel, plumbing, and water heater last replaced?
- Why hasn't it sold? Are there any deal-killer items the seller is aware of (foundation, flood, title, zoning, code violations)?
- Is there a deadline driving the sale (1031 exchange, divorce, estate, relocation)? That informs how much negotiation room exists.
- Schools are D-rated, which usually means shorter tenancies and higher turnover. Who's the typical renter profile here, and what's been the actual vacancy rate?
- Crime grade is F in this area — have there been break-ins, vandalism, or insurance claims at this property in the last 3 years? What carrier currently insures it and at what premium?
- What's the average days-on-market for RENTAL listings here right now (not sales)? A rising rental-DOM trend means longer vacancies and softer asking-rent achievability than the comps imply.
- What's the recent tenant-quality profile in this submarket — average credit score on applications, eviction rate, late-payment / NSF rate, and stable-employment percentage? A property-management company in the area should have these aggregated.
- How much new for-sale + rental construction is in the pipeline within 1–3 miles? Heavy new supply typically softens prices + rents 12–24 months out; constrained supply supports both.
Investment metrics
- 1% rule
- 2.98% ✓
- Cap rate
- 26.21%
- Cash-on-cash
- 71.14%
- DSCR
- 4.17
- GRM
- 2.8
CMA / ARV
- ARV (on-the-fly)
- $102,690
- Comps found
- 12
Show comp detail 12 sales within ~0.75 mi
| Address | Dist | Beds/Ba | Sqft | Sold | Price | $/sf | Match |
|---|---|---|---|---|---|---|---|
| 13393 Mariposa Rd #269 | 0.00mi | 2/2.0 | 1,623 (-0%) | 20mo | $120,000 | $74 | 82 |
| 13393 Mariposa #114 | 0.00mi | 2/2.0 | 1,440 (-12%) | 4mo | $85,500 | $59 | 77 |
| 13393 Mariposa Rd #156 | 0.00mi | 3/2.0 (+1) | 1,736 (+6%) | 10mo | $155,000 | $89 | 76 |
| 13393 Mariposa #188 | 0.24mi | 2/2.0 | 1,512 (-7%) | 6mo | $78,000 | $52 | 72 |
| 13393 Mariposa Rd, #97 | 0.06mi | 3/2.0 (+1) | 1,440 (-12%) | 3mo | $90,600 | $63 | 70 |
| 13393 Mariposa Rd #35 | 0.00mi | 3/2.0 (+1) | 1,464 (-10%) | 10mo | $65,000 | $44 | 70 |
| 13393 Mariposa Rd #26 | 0.00mi | 2/2.0 | 1,440 (-12%) | 17mo | $65,000 | $45 | 66 |
| 13393 Mariposa Rd #92 | 0.00mi | 3/2.0 (+1) | 1,431 (-12%) | 10mo | $144,000 | $101 | 66 |
| 13393 Mariposa #282 | 0.00mi | 2/2.0 | 1,440 (-12%) | 17mo | $30,000 | $21 | 66 |
| 13393 Mariposa Rd #124 | 0.00mi | 3/2.0 (+1) | 1,484 (-9%) | 21mo | $122,000 | $82 | 62 |
| 13393 Mariposa Rd #9 | 0.00mi | 3/2.0 (+1) | 1,440 (-12%) | 19mo | $75,000 | $52 | 60 |
| 15614 Calico Dr | 0.42mi | 3/2.0 (+1) | 1,723 (+6%) | 11mo | $380,000 | $221 | 57 |
Match score weights: distance 35% · size 25% · config 20% · recency 20%. Top-matched comps best support the ARV.
Projected returns pro-forma
-3.0% appreciation · 4.27% rent growth · sell at horizon
- IRR
- 72.2%
- Equity multiple
- 4.34×
- Total profit
- $65,388
- Equity at exit
- $10,437
- IRR
- 76.5%
- Equity multiple
- 9.35×
- Total profit
- $163,708
- Equity at exit
- $6,052
Cash invested: $19,600 (down + closing). Projections, not guarantees.
Landlord ↔ Tenant lean methodology
- Overall (STATE)
- 18 Strongly Tenant-Friendly
- State California
- 18 Strongly Tenant-Friendly · D+13
- County
- — inherits STATE
- City
- — inherits STATE
ZIP-level market 92395
- Home prices YoY
- -14.7%
- Rents YoY
- 4.3%
- Active inventory
- 284
- Price-to-rent
- 2.8×
Monthly cashflow live
- Estimated rent
- $2,083 high interval (Pro) →
- Mortgage (P&I)
- −$367
- Tax est. 1.5%
- −$88 /mo · $1,050/yr
- Insurance
- −$29
- HOA
- −$0
- Vacancy / Maint / Mgmt
- −$437
- Net cashflow
- $1,162
Break-even live
Sensitivity live
| Price | -10% $1,210 | -5% $1,186 | +0% $1,162 | +5% $1,138 | +10% $1,114 |
|---|---|---|---|---|---|
| Rent | -10% $997 | -5% $1,080 | +0% $1,162 | +5% $1,244 | +10% $1,326 |
| Rate | -1.0pp $1,197 | -0.5pp $1,180 | base $1,162 | +0.5pp $1,144 | +1.0pp $1,125 |
UW: 25.0% down · 7.5% · 30yr · 1.5% tax · 5.0% vac · 8.0% maint · 8.0% mgmt
Financing live
Cash to close
- Down payment
- $17,500
- Closing costs
- $2,100
- Reserves months
- —
- Total cash needed
- —
Loan-product check · same deal, 3 products live
Conventional
25% down · 7.5% · 30yr
- Down + closing
- —
- Monthly P&I
- —
- Monthly cashflow
- —
- DSCR
- —
- Eligible?
- —
Personal DTI + credit; lowest rate.
DSCR
20% down · 8.5% · 30yr
- Down + closing
- —
- Monthly P&I
- —
- Monthly cashflow
- —
- DSCR
- —
- Eligible?
- —
No personal income docs; deal must DSCR.
Hard money
10% down · 12.0% · 12mo
- Down + closing
- —
- Monthly P&I
- —
- Monthly cashflow
- —
- DSCR
- —
- Eligible?
- —
Short-term bridge; refi at stabilization.
Rent comps 12 comps
| Address | Beds | Baths | Sqft | Rent | $/sqft | DOM | Units | Dist |
|---|---|---|---|---|---|---|---|---|
| 15678 Inca Way Victorville, CA | 3.0 | 2.0 | 1399 | $2,200 | $1.57 | 18d | 1 | 0.20mi |
| 13632 Nassau Dr Victorville, CA | 3.0 | 2.0 | 1298 | $1,990 | $1.53 | 0d | 1 | 0.38mi |
| 15450 Nisqualli Rd Victorville, CA | 1.0–3.0 | 1.0–2.0 | 940 | $2,146 | $2.28 | 0d | 7 | 0.44mi |
| 13024 Rainwood Ct Victorville, CA | 2.0 | 2.0 | 1159 | $1,800 | $1.55 | 0d | 1 | 0.56mi |
| 13925 Burning Tree Dr Victorville, CA | 3.0 | 2.0 | 1440 | $2,250 | $1.56 | 0d | 1 | 0.84mi |
| 12692 Senecio Ave Victorville, CA | 3.0 | 2.0 | 1275 | $2,300 | $1.80 | 0d | 1 | 0.87mi |
| 16376 Appletree Ln Victorville, CA | 3.0 | 2.0 | 1544 | $2,450 | $1.59 | 3d | 1 | 1.07mi |
| 13520 Third Ave Victorville, CA | 2.0–3.0 | 2.0–2.5 | 1000 | $1,850 | $1.85 | 0d | 1 | 1.13mi |
| 14257 Sage St Victorville, CA | 3.0 | 3.0 | 1319 | $2,500 | $1.90 | 0d | 1 | 1.19mi |
| 14344 Mcart Rd Victorville, CA | 2.0–3.0 | 2.0 | 1042 | $1,899 | $1.82 | 0d | 4 | 1.27mi |
| 13860 Navarro Dr Victorville, CA | 2.0 | 2.0 | 1255 | $1,850 | $1.47 | 0d | 1 | 1.44mi |
| 14599 Santa Fe Trl Victorville, CA | 3.0 | 2.0 | 1521 | $2,250 | $1.48 | 0d | 1 | 1.49mi |
Listing history 21 events
-
2026-06-21days on market $70,000 Active 132 DOM
-
2026-06-18days on market $70,000 Active 129 DOM
-
2026-06-17days on market $70,000 Active 128 DOM
-
2026-06-16days on market $70,000 Active 127 DOM
-
2026-06-15days on market $70,000 Active 126 DOM
-
2026-06-13days on market $70,000 Active 124 DOM
-
2026-06-13days on market $70,000 Active 123 DOM
-
2026-06-09days on market $70,000 Active 120 DOM
-
2026-06-08days on market $70,000 Active 119 DOM
-
2026-06-07days on market $70,000 Active 118 DOM
-
2026-06-04days on market $70,000 Active 115 DOM
-
2026-06-03days on market $70,000 Active 114 DOM
-
2026-06-02days on market $70,000 Active 113 DOM
-
2026-06-01days on market $70,000 Active 112 DOM
-
2026-05-31days on market $70,000 Active 111 DOM
-
2026-04-29price $70,000
-
2026-03-30status Active
-
2026-03-24historical Active Under Contract
-
2026-03-23status Active
-
2026-03-22status Pending Sale
-
2026-02-08$72,900 Active
ⓘ Source: listings_history table (triggers on properties + properties_extension) + one-shot
backfill from property_details.listing_events for pre-trigger history.
Climate risk First Street
- Flood 6/10 Major FEMA zone X (unshaded) · 67% chance over 30 yrs
- Wildfire 1/10 Low
- Heat 7/10 Severe 3 d/yr ≥99°F today · 8 d/yr by 30 yrs out
- Wind 1/10 Low
- Air quality 9/10 Extreme 22 unhealthy d/yr today · 28 by 30 yrs out
Nearby sold comps map
Loading sold comps map…
Walkable amenities ~0.75 mi
Loading nearby amenities…
Taxation est. · year 1
- Rental income
- $24,998
- − Mortgage interest
- −$3,921
- − Property taxes
- −$1,050
- − Insurance
- −$350
- − Repairs & maintenance
- −$2,000
- − Management
- −$2,000
- − Depreciation
- −$2,036
- Taxable income
- $13,641
- Est. tax owed @ 24.0%
- −$3,274
- After-tax cash flow
- $10,669/yr
For passive investors: Depreciation is non-cash, so a rental often shows a tax loss while cash-flowing — sheltering income. Rental losses are passive: they offset passive income freely, and up to $25,000/yr can offset ordinary (W-2) income if you actively participate and your MAGI is under $100k (phasing out to $0 by $150k); unused losses carry forward. On sale, claimed depreciation is recaptured at up to 25%, and gains may owe capital-gains tax (a 1031 exchange can defer both). Figures are a year-1 estimate at your 24.0% rate — not tax advice; consult a CPA.
Schools (NCES district)
- District
- Victor Elementary
- NCES district ID
- 0641040
- Math proficiency
- 25% ▬ 0.00%
- Reading proficiency
- 25% ▼ -9.00%
- Median HH income
- $44,949
- Composite
- 21.58/100
- National rank
- #8304
- State rank
- #408 of 517 in CA
Livability — Victorville
- Score
- 54/100
- State rank
- #906
- US rank
- #24038
Category grades
Schools grade is shown separately in the Schools card above.
Census & demographics
- Census place
- Victorville, CA
- County
- San Bernardino County · 2,030,291 people
- City population
- 154,418
- Metro
- Riverside-San Bernardino-Ontario, CA
- Population (ZIP)
- 47,375
- Household income
- $62,102
- Rent vs Own
- Severe rent burden
- 2449.0
Population outlook (San Bernardino County) Hauer SSP2
- Today (2025)
- 2,300,329 people
- By 2030
- 2,378,907 · +3.4%
- By 2040
- 2,523,137 · +9.7%
- By 2050
- 2,642,388 · +14.9%
- By 2075
- 2,880,769 · +25.2%
- By 2100
- 2,909,436 · +26.5%
Race, ethnicity, and origin ACS 2023
- Neighborhood character
- Diverse neighborhood (Simpson 0.65)
- Race & ethnicity
- Hispanic / Latino 49% White 30% Two or more races 19% Black 13% Asian 4% Native American 1%
- Hispanic origin (detail)
- Mexican 40% Puerto Rican 1%
- Common ancestry
- Romanian 1% Slovak 1% Portuguese 1%
- Foreign-born
- 18% · Canada, South Korea, Guatemala
- Languages at home
- 63% English-only · Spanish 31% Tagalog/Filipino 1% Arabic 1%
Political lean MEDSL · San Bernardino
- 2024 margin
- Toss-up / Even · D 47.5% · R 49.7% · Other 2.8%
- 2008→2024 swing
- -8.5pp toward R · 2008: 6.3pp · 2024: -2.1pp
- All cycles
- 2024: R+2.1 2020: D+10.7 2016: D+9.8 2012: D+5.4 2008: D+6.3
Not yet ingested
- Civics
- —
Market trends
- HPI YoY
- ▼ -68.10%
- Current HPI
- 395.2836
- Rent YoY
- ▲ 4.27%
- Metro
- Riverside-San Bernardino-Ontario, CA
- State GDP YoY
- ▲ 3.21%
- F500 in state
- 116
Industry mix (Fortune 500 HQ in CA)
| Industry | F500 HQs | Revenue |
|---|---|---|
| Technology | 27 | $1,492B |
|
||
| Financial Services | 3 | $174B |
|
||
| Retail | 3 | $44B |
|
||
| Insurance | 3 | $26B |
|
||
| Media / Entertainment | 2 | $115B |
|
||
| Pharmaceuticals / Biotech | 2 | $62B |
|
||
Price history
-4.0% since first listed6 events — show timeline
- 2026-04-29 Price Changed $70,000 CRMLS
- 2026-03-30 Relisted — CRMLS
- 2026-03-24 Contingent — CRMLS
- 2026-03-23 Relisted — CRMLS
- 2026-03-22 Pending — CRMLS
- 2026-02-08 Listed $72,900 CRMLS
Property tax history
-8.4%/yrLatest (2025): $53 · +5.1% YoY. Source: county tax records.
Cash-flow waterfall
monthlySold comps — $/sqft
last 12 mo · ≤1 miLoading sold comps…