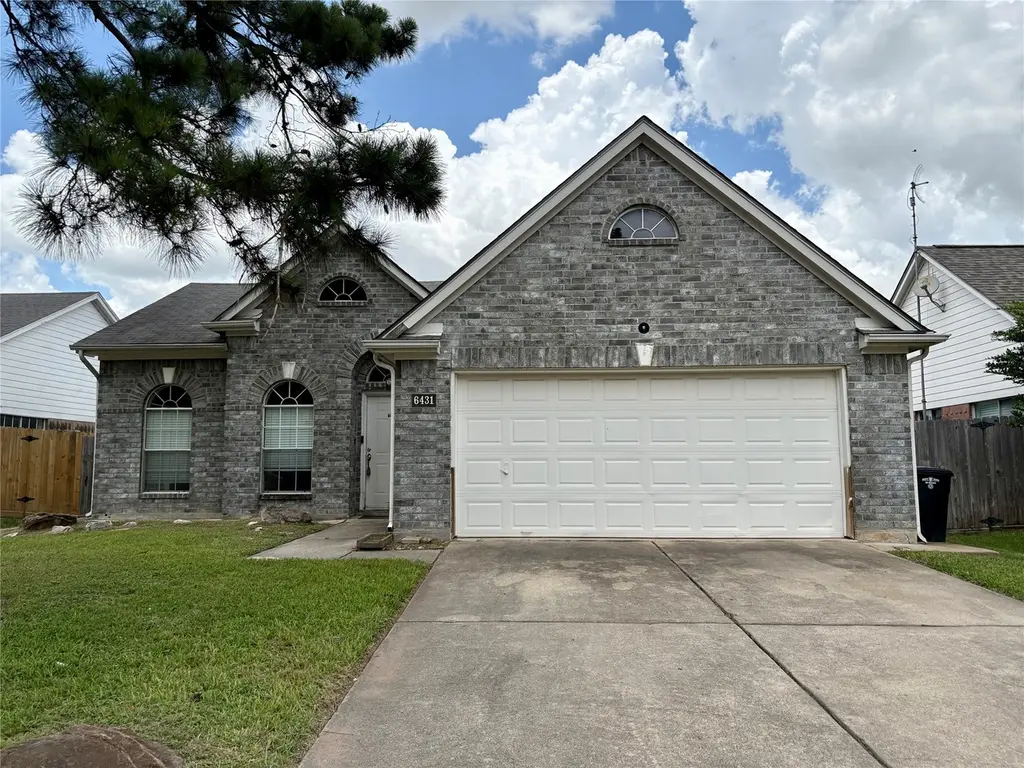
6431 Diamond Rock Dr · Houston, TX
Flood risk 1/10 · Minimal
- FEMA flood zone
- X (unshaded)
- Chance of flooding over 30 yrs
- 0.0%
- Est. flood insurance / yr
- $507 – $1,088
Fire risk 3/10 · Minor
- Est. fire insurance / yr
- $1,222 – $2,270
Heat risk 9/10 · Severe
- Hot days now (above 110°F)
- 7 days/yr
- Hot days in 30 yrs
- 23 days/yr
Wind risk 8/10 · Major
- Chance of severe wind over 30 yrs
- 99.0%
Air-quality risk 2/10 · Minimal
- Unhealthy air days now
- 2 days/yr
- Unhealthy air days in 30 yrs
- 2 days/yr
Risk factors via First Street. Map © Google.
Why this score? — see what drove the D grade
The composite is a weighted blend of 9 inputs, each scored 0–100. Each bar is that input's sub-score; the figure is the points it added to the 100-point composite (weight × sub-score).
- Cash flow +10.1/30.0
- ARV discount +8.0/15.0
- Appreciation +4.4/10.0
- Schools +4.4/10.0
- 1% rule +4.2/10.0
- Livability +3.7/5.0
- DSCR +2.9/10.0
- Condition / age +2.5/5.0
- Rent growth +1.8/5.0
$217,999
🖨 Deal sheet (PDF) 📄 Offer letter ✓ Due diligence
Listing remarks
Wonderful starter home. Your buyer will love the space this house has to offer and make it their own. Thank you for showing - bring your offers. -- Offer has been accepted - waiting for full execution to change status
Key facts
- 5,501 sq ft lot
- 2 garage spots
- Built 1996
Property features AI
Finance
- Other: Seller disclosure available
- HOA & community: Community managed by Crest Management; Annual association fee of $400
Exterior
- Parking: Attached 2-car garage
- Utilities: Public water; Public sewer
- Home design: Residential property; 1,296 total building area; Built in 1996; Slab foundation; Composition roof
- Construction: Brick construction
- Exterior features: Fenced backyard; Located in a subdivision
Interior
- Kitchen: Kitchen on the first floor; Breakfast nook on the first floor
- Bedrooms: Primary bedroom on the first floor (approx. 14x12); Two additional bedrooms on the first floor (each approx. 10x10)
- Flooring: Carpet; Plank; Tile; Vinyl
- Bathrooms: 2 full bathrooms
- Heating & cooling: Central heating (gas); Central air (electric)
- Interior features: High ceilings; Kitchen/family room combo; Pantry; Ceiling fan(s); One fireplace; 8 total rooms
- Laundry & utility: Utility room on the first floor
Neighborhood map
What this means for you Summary
Snapshot
- This is a 3-bed/2.0-bath single-family listed at $218k.
Deal economics
- At list price, monthly cash flow is $-129 ($-2k/yr) — negative.
- To cash-flow at today's rent, offer at most $195k (10.4% below list).
- To meet the 1% rule (rent ≥ 1% of price), the offer needs to be $201k (7.7% below list).
- Recommended offer: $195k (10.4% below list) — sets the bar for cash-flow.
- Cap rate 5.6% vs local median 3.2% in Houston — top-decile yield for the area; either an underpriced asset or a hidden risk that comps aren't pricing in. Stress-test before assuming the spread holds.
Location & tenants
- Location reads 74/100 on livability (#184 in TX, #4,771 nationally) — a middle-class / working-renter tenant base. Strengths: amenities A+, cost of living A+, housing A+; Watch: crime F.
- Cypress-Fairbanks ISD (suburban): math 45% / reading 52% proficiency, ranked #161 of 826 in TX (top 20%) — families likely to look elsewhere, expect single-tenant / working-renter base with shorter leases.
- Zoned schools: Walker El (math 23% / reading 38%, grade F, #2,464 of 4,322 statewide, top 58%, 1,025 students, 77% FRL); Rowe Middle (math 26% / reading 44%, grade F, #842 of 1,662 statewide, top 51%, 1,310 students, 80% FRL); Cypress-Fairbanks J J A E P (12 students, 0% FRL).
- Zoned-school proficiency averages 33% at this address vs 48% district-wide (-16 pts) — the specific schools serving this property underperform the Cypress-Fairbanks ISD average; the district grade overstates school quality for this exact location.
- Market conditions: Rents soft (-2.9%/yr); 763 active listings in the ZIP; 37 comparable units currently listed for rent nearby; rentals at typical pace (median 23d on market — plan ~3-4 weeks tenant-placement turnaround); solid renter incomes; 29,883 units permitted in Harris County in 2024 (8,621 in 5+ unit buildings).
Forward outlook
- Local home prices are declining (-1.3%/yr); year-one equity from $2k of loan paydown is wiped out by about $3k of value loss. Plan a longer hold.
- Harris County population projected at +47% by 2050 — long-run rental-demand tailwind backs the buy-and-hold thesis.
Negotiation context
- It's been on market 17 days — a 2% lower offer ($215k) is reasonable based on typical stale-listing flexibility.
Risks & watch-outs
- Climate carrying-cost: severe wind risk, 99% chance of damaging wind over 30y; extreme-heat days projected 7→23/yr by 2055 (HVAC capex compounding) — expect insurance premiums to compound above CPI over the hold.
Questions for the listing agent
- What do current leases actually rent for vs. the listed asking? Can we see a recent rent roll and the last 12 months of T-12 income?
- What does the HOA fee cover, when was the last increase, and are there any pending special assessments or reserve-fund shortfalls?
- Is there a deadline driving the sale (1031 exchange, divorce, estate, relocation)? That informs how much negotiation room exists.
- Schools are D-rated, which usually means shorter tenancies and higher turnover. Who's the typical renter profile here, and what's been the actual vacancy rate?
- Crime grade is F in this area — have there been break-ins, vandalism, or insurance claims at this property in the last 3 years? What carrier currently insures it and at what premium?
- The area grade is low — what's the realistic commute time and amenity access for the typical tenant pool here? Any planned neighborhood developments (good or bad) we should know about?
- What's the average days-on-market for RENTAL listings here right now (not sales)? A rising rental-DOM trend means longer vacancies and softer asking-rent achievability than the comps imply.
- What's the recent tenant-quality profile in this submarket — average credit score on applications, eviction rate, late-payment / NSF rate, and stable-employment percentage? A property-management company in the area should have these aggregated.
- How much new for-sale + rental construction is in the pipeline within 1–3 miles? Heavy new supply typically softens prices + rents 12–24 months out; constrained supply supports both.
Investment metrics
- 1% rule
- 0.92% ✗
- Cap rate
- 5.58%
- Cash-on-cash
- -2.53%
- DSCR
- 0.89
- GRM
- 9.0
CMA / ARV
- ARV (on-the-fly)
- $220,320
- Comps found
- 12
Show comp detail 12 sales within ~0.75 mi
| Address | Dist | Beds/Ba | Sqft | Sold | Price | $/sf | Match |
|---|---|---|---|---|---|---|---|
| 20918 Walder Ct | 0.29mi | 3/2.0 | 1,316 (+2%) | 3mo | $219,600 | $167 | 82 |
| 6450 New World Dr | 0.08mi | 2/1.5 (-1) | 1,176 (-9%) | 2mo | $218,000 | $185 | 72 |
| 21007 Terrace View Dr | 0.23mi | 3/2.0 | 1,475 (+14%) | 1mo | $250,000 | $169 | 65 |
| 20648 Patriot Park Ln | 0.47mi | 3/2.0 | 1,204 (-7%) | 2mo | $224,900 | $187 | 65 |
| 21170 Northern Colony Ct | 0.47mi | 3/2.0 | 1,375 (+6%) | 4mo | $225,000 | $164 | 64 |
| 21126 Settlers Valley Dr | 0.36mi | 3/2.0 | 1,436 (+11%) | 2mo | $204,999 | $143 | 63 |
| 6205 Lone Prairie Way | 0.62mi | 3/2.5 | 1,336 (+3%) | 5mo | $215,000 | $161 | 60 |
| 6233 Lone Prairie Way | 0.65mi | 3/2.5 | 1,260 (-3%) | 7mo | $219,900 | $175 | 58 |
| 6635 Rusty Ridge Ln | 0.64mi | 3/2.0 | 1,206 (-7%) | 2mo | $205,000 | $170 | 57 |
| 20603 Sycamore Crest Ln | 0.61mi | 3/2.0 | 1,201 (-7%) | 2mo | $164,990 | $137 | 57 |
| 20710 Azelea Field St | 0.44mi | 3/2.0 | 1,445 (+12%) | 7mo | $264,900 | $183 | 55 |
| 6023 Lillybelle St | 0.59mi | 3/2.0 | 1,474 (+14%) | 5mo | $275,000 | $187 | 46 |
Match score weights: distance 35% · size 25% · config 20% · recency 20%. Top-matched comps best support the ARV.
Projected returns pro-forma
-1.27% appreciation · 0.0% rent growth · sell at horizon
- IRR
- -13.2%
- Equity multiple
- 0.46×
- Total profit
- $-33,003
- Equity at exit
- $49,802
- IRR
- -9.8%
- Equity multiple
- 0.24×
- Total profit
- $-46,382
- Equity at exit
- $49,930
Cash invested: $61,040 (down + closing). Projections, not guarantees.
Landlord ↔ Tenant lean methodology
- Overall (STATE)
- 87 Strongly Landlord-Friendly
- State Texas
- 87 Strongly Landlord-Friendly · R+5
- County
- — inherits STATE
- City
- — inherits STATE
ZIP-level market 77449
- Home prices YoY
- -0.5%
- Rents YoY
- -2.9%
- Active inventory
- 763
- Price-to-rent
- 9.0×
Monthly cashflow live
- Estimated rent
- $2,013 high interval (Pro) →
- Mortgage (P&I)
- −$1,143
- Tax from tax record
- −$452 /mo · $5,420/yr
- Insurance
- −$91
- HOA
- −$33
- Vacancy / Maint / Mgmt
- −$423
- Net cashflow
- $-129
Break-even live
Sensitivity live
| Price | -10% $-5 | -5% $-67 | +0% $-129 | +5% $-190 | +10% $-252 |
|---|---|---|---|---|---|
| Rent | -10% $-288 | -5% $-208 | +0% $-129 | +5% $-49 | +10% $30 |
| Rate | -1.0pp $-19 | -0.5pp $-73 | base $-129 | +0.5pp $-185 | +1.0pp $-243 |
UW: 25.0% down · 7.5% · 30yr · 1.5% tax · 5.0% vac · 8.0% maint · 8.0% mgmt
Financing live
Cash to close
- Down payment
- $54,500
- Closing costs
- $6,540
- Reserves months
- —
- Total cash needed
- —
Loan-product check · same deal, 3 products live
Conventional
25% down · 7.5% · 30yr
- Down + closing
- —
- Monthly P&I
- —
- Monthly cashflow
- —
- DSCR
- —
- Eligible?
- —
Personal DTI + credit; lowest rate.
DSCR
20% down · 8.5% · 30yr
- Down + closing
- —
- Monthly P&I
- —
- Monthly cashflow
- —
- DSCR
- —
- Eligible?
- —
No personal income docs; deal must DSCR.
Hard money
10% down · 12.0% · 12mo
- Down + closing
- —
- Monthly P&I
- —
- Monthly cashflow
- —
- DSCR
- —
- Eligible?
- —
Short-term bridge; refi at stabilization.
Rent comps 37 comps
| Address | Beds | Baths | Sqft | Rent | $/sqft | DOM | Units | Dist |
|---|---|---|---|---|---|---|---|---|
| 6402 Wild River Dr Katy, TX | 3.0 | 2.0 | 1572 | $2,091 | $1.33 | 4d | 1 | 0.12mi |
| 6506 Garden Canyon Dr Katy, TX | 3.0 | 2.0 | 1842 | $1,895 | $1.03 | 24d | 1 | 0.18mi |
| 20967 Young Meadows Way Katy, TX | 3.0 | 2.0 | 1256 | $1,795 | $1.43 | 9d | 1 | 0.37mi |
| 21035 Carmel Valley Dr Katy, TX | 3.0 | 2.0 | 1431 | $1,791 | $1.25 | 26d | 1 | 0.40mi |
| 20507 Barker Bend Ct Katy, TX | 3.0 | 2.0 | 1488 | $1,825 | $1.23 | 45d | 1 | 0.50mi |
| 20735 Dewberry Creek Ln Katy, TX | 4.0 | 2.0 | 1609 | $1,756 | $1.09 | 24d | 1 | 0.56mi |
| 6010 Diantha St Katy, TX | 3.0 | 2.0 | 1465 | $1,856 | $1.27 | 45d | 1 | 0.62mi |
| 6747 Scarlet Sagebrush St Katy, TX | 3.0 | 2.0 | 1530 | $2,300 | $1.50 | 45d | 1 | 0.63mi |
| 6619 Rusty Ridge Ln Katy, TX | 3.0 | 2.5 | 1450 | $1,895 | $1.31 | 5d | 1 | 0.64mi |
| 21627 Calico Bush Trl Katy, TX | 3.0 | 2.0 | 1423 | $3,800 | $2.67 | 18d | 1 | 0.70mi |
| 6810 N Fry Rd Katy, TX | 1.0–3.0 | 1.0–3.0 | 1151 | $2,683 | $2.33 | 1d | 58 | 0.72mi |
| 21054 Breezeway Cove Dr Bridgeland, TX | 3.0–4.0 | 2.5–3.5 | 1784 | $2,450 | $1.37 | 1d | 41 | 0.83mi |
| 21447 FM 529 Rd Cypress, TX | 1.0–3.0 | 1.0–2.0 | 996 | $2,205 | $2.21 | 1d | 28 | 0.85mi |
| 20978 Farm to Market Road 529 Unit SWFS2 Cypress, TX | 2.0 | 2.0 | 1025 | $1,725 | $1.68 | 4d | 1 | 0.86mi |
| 20978 Farm to Market Road 529 Cypress, TX | 2.0 | 2.0 | 1025 | $1,725 | $1.68 | 45d | 1 | 0.86mi |
| 6502 Wellington Meadows Dr Katy, TX | 3.0 | 2.0 | 1416 | $1,500 | $1.06 | 14d | 1 | 0.90mi |
| 19638 Billineys Park Dr Katy, TX | 3.0 | 2.5 | 1752 | $1,750 | $1.00 | 21d | 1 | 0.92mi |
| 21235 Catalina Palm Dr Cypress, TX | 4.0 | 2.0 | 1756 | $2,600 | $1.48 | 45d | 1 | 1.01mi |
| 7310 Coconut Bay Dr Cypress, TX | 4.0 | 2.0 | 1620 | $2,307 | $1.42 | 45d | 1 | 1.02mi |
| 19607 Buckland Park Dr Katy, TX | 3.0 | 2.0 | 1798 | $1,965 | $1.09 | 4d | 1 | 1.04mi |
| 21331 Hartford Hollow Ln Katy, TX | 3.0 | 2.0 | 1820 | $1,500 | $0.82 | 21d | 1 | 1.05mi |
| 19802 Plantation Grove Trl Katy, TX | 3.0 | 2.0 | 1607 | $1,745 | $1.09 | 45d | 1 | 1.15mi |
| 19735 Plantation Grove Trl Katy, TX | 3.0 | 2.0 | 1404 | $1,719 | $1.22 | 4d | 1 | 1.20mi |
| 19730 Cozy Cabbin Dr Katy, TX | 3.0 | 2.0 | 1544 | $1,800 | $1.17 | 24d | 1 | 1.22mi |
| 5523 Dapplewood Ln Katy, TX | 3.0 | 2.0 | 1560 | $1,825 | $1.17 | 1d | 1 | 1.23mi |
| 20123 Braley Ct Cypress, TX | 3.0 | 2.5 | 1726 | $1,976 | $1.14 | 1d | 1 | 1.23mi |
| 19501 W Little York Rd Katy, TX | 2.0 | 2.0 | 990 | $1,250 | $1.26 | 26d | 1 | 1.34mi |
| 19501 W Little York Rd Katy, TX | 2.0 | 2.0 | 990 | $1,250 | $1.26 | 45d | 1 | 1.34mi |
| 21522 Violet Ridge Rd Katy, TX | 3.0 | 4.0 | 1597 | $2,200 | $1.38 | 45d | 1 | 1.35mi |
| 21038 Treasure Gate Ln Cypress, TX | 4.0 | 2.5 | 1804 | $2,676 | $1.48 | 45d | 1 | 1.40mi |
| 19903 Mountain Dale Dr Cypress, TX | 3.0 | 2.0 | 1356 | $1,896 | $1.40 | 1d | 1 | 1.42mi |
| 7558 Magnolia Orchid Ln Cypress, TX | 4.0 | 2.5 | 1743 | $2,390 | $1.37 | 45d | 1 | 1.42mi |
| 5107 Jasper Garden Cir Katy, TX | 3.0 | 2.0 | 1412 | $1,825 | $1.29 | 22d | 1 | 1.43mi |
| 21054 Montego Breeze Ln Cypress, TX | 3.0–5.0 | 2.0–3.5 | 1935 | $2,199 | $1.14 | 14d | 21 | 1.45mi |
| 19917 Stoney Haven Dr Cypress, TX | 2.0 | 1.5 | 1060 | $1,579 | $1.49 | 45d | 1 | 1.47mi |
| 19442 Elmtree Estates Dr Katy, TX | 3.0 | 2.0 | 1735 | $1,776 | $1.02 | 14d | 1 | 1.48mi |
| 19434 Glenway Falls Dr Katy, TX | 3.0 | 2.0 | 1326 | $1,800 | $1.36 | 45d | 1 | 1.50mi |
HOA detail
- Monthly dues
- $33 · $396/yr
Listing history 14 events
-
2026-06-21days on market $217,999 Pending 17 DOM
-
2026-06-18days on market $217,999 Pending 16 DOM
-
2026-06-17days on market $217,999 Pending 15 DOM
-
2026-06-16days on market $217,999 Pending 14 DOM
-
2026-06-15days on market $217,999 Pending 13 DOM
-
2026-06-13days on market $217,999 Pending 11 DOM
-
2026-06-13remarks 217-char remark
-
2026-06-13statusdays on market $217,999 Pending 10 DOM
-
2026-06-09days on market $217,999 Active 7 DOM
-
2026-06-08days on market $217,999 Active 6 DOM
-
2026-06-07days on market $217,999 Active 5 DOM
-
2026-06-04days on market $217,999 Active 2 DOM
-
2026-06-03remarks 144-char remark
-
2026-06-03$217,999 Active 1 DOM
ⓘ Source: listings_history table (triggers on properties + properties_extension) + one-shot
backfill from property_details.listing_events for pre-trigger history.
Tax reassessment forecast TX · Resets to sale price
- Current annual tax
- $5,420 · $452/mo
- Projected year-2 tax
- $5,420 · $452/mo
- Expected delta
- $0/yr ($0/mo · 0.0%)
ⓘ Screening estimate from a state-policy table — verify with the county assessor before closing.
Climate risk First Street
- Flood 1/10 Low FEMA zone X (unshaded) · 0% chance over 30 yrs
- Wildfire 3/10 Moderate
- Heat 9/10 Extreme 7 d/yr ≥110°F today · 23 d/yr by 30 yrs out
- Wind 8/10 Severe 99% chance of damaging wind over 30 yrs
- Air quality 2/10 Low 2 unhealthy d/yr today · 2 by 30 yrs out
Nearby sold comps map
Loading sold comps map…
Walkable amenities ~0.75 mi
Loading nearby amenities…
Taxation est. · year 1
- Rental income
- $24,151
- − Mortgage interest
- −$12,211
- − Property taxes
- −$5,420
- − Insurance
- −$1,090
- − Repairs & maintenance
- −$1,932
- − Management
- −$1,932
- − HOA
- −$396
- − Depreciation
- −$6,342
- Taxable loss
- −$5,172
- Est. tax savings @ 24.0%
- +$1,241
- After-tax cash flow
- $-304/yr
For passive investors: Depreciation is non-cash, so a rental often shows a tax loss while cash-flowing — sheltering income. Rental losses are passive: they offset passive income freely, and up to $25,000/yr can offset ordinary (W-2) income if you actively participate and your MAGI is under $100k (phasing out to $0 by $150k); unused losses carry forward. On sale, claimed depreciation is recaptured at up to 25%, and gains may owe capital-gains tax (a 1031 exchange can defer both). Figures are a year-1 estimate at your 24.0% rate — not tax advice; consult a CPA.
Schools (NCES district)
- District
- Cypress-Fairbanks ISD
- NCES district ID
- 4816110
- Math proficiency
- 45% ▼ -12.00%
- Reading proficiency
- 52% ▼ -2.00%
- Median HH income
- $72,025
- Composite
- 43.63/100
- National rank
- #2968
- State rank
- #161 of 826 in TX
Livability — Houston
- Score
- 74/100
- State rank
- #184
- US rank
- #4771
Category grades
Schools grade is shown separately in the Schools card above.
Census & demographics
- County
- Harris County · 4,702,590 people
- City population
- 3,226,434
- Metro
- Houston-The Woodlands-Sugar Land, TX
- Population (ZIP)
- 130,028
- Household income
- $87,808
- Rent vs Own
- Severe rent burden
- 3088.0
Population outlook (Harris County) Hauer SSP2
- Today (2025)
- 5,571,493 people
- By 2030
- 6,089,821 · +9.3%
- By 2040
- 7,142,806 · +28.2%
- By 2050
- 8,185,864 · +46.9%
- By 2075
- 10,574,329 · +89.8%
- By 2100
- 12,109,958 · +117.4%
Race, ethnicity, and origin ACS 2023
- Neighborhood character
- Diverse neighborhood (Simpson 0.68)
- Race & ethnicity
- Hispanic / Latino 49% Two or more races 22% Black 20% White 19% Asian 6%
- Hispanic origin (detail)
- Mexican 26% Puerto Rican 1% Cuban 4%
- Common ancestry
- Lithuanian 1% Italian 1%
- Foreign-born
- 32% · Canada, Jamaica, Vietnam
- Languages at home
- 48% English-only · Spanish 40% Other Indo-European 3% Vietnamese 1%
Political lean MEDSL · Harris
- 2024 margin
- Lean D (+5.5) · D 52.0% · R 46.4% · Other 1.6%
- 2008→2024 swing
- +3.9pp toward D · 2008: 1.6pp · 2024: 5.5pp
- All cycles
- 2024: D+5.5 2020: D+13.3 2016: D+12.4 2012: D+0.1 2008: D+1.6
Not yet ingested
- Civics
- —
Market trends
- HPI YoY
- ▼ -1.27%
- Current HPI
- 254.6622
- Rent YoY
- ▼ -2.86%
- Metro
- Houston-The Woodlands-Sugar Land, TX
- State GDP YoY
- ▲ 3.95%
- F500 in state
- 110
Industry mix (Fortune 500 HQ in TX)
| Industry | F500 HQs | Revenue |
|---|---|---|
| Energy | 16 | $1,198B |
|
||
| Technology | 5 | $198B |
|
||
| Engineering / Construction | 4 | $72B |
|
||
| Energy Services | 3 | $60B |
|
||
| Utilities | 3 | $41B |
|
||
| Healthcare | 2 | $330B |
|
||
Price history
3 events — show timeline
- 2026-06-02 Listed $217,999 HARMLS
- 2003-08-20 Sold (Public Records) — Public Records
- 1996-11-22 Sold (Public Records) — Public Records
Property tax history
+7.5%/yrLatest (2025): $5,420 · +9.9% YoY. Source: county tax records.
Cash-flow waterfall
monthlySold comps — $/sqft
last 12 mo · ≤1 miLoading sold comps…