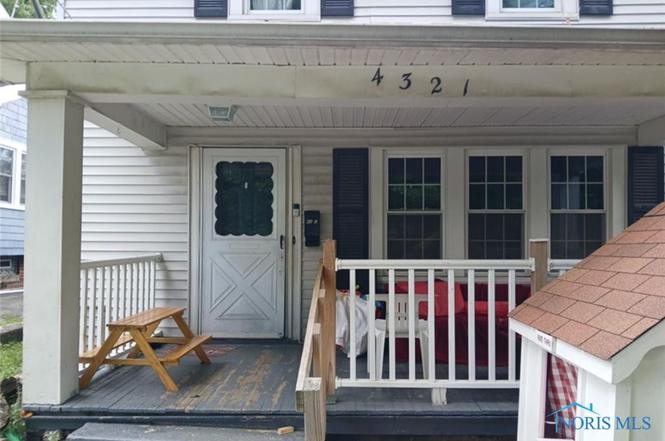
4321 Burnham Ave · Toledo, OH
Flood risk 7/10 · Major
- FEMA flood zone
- X (unshaded)
- Chance of flooding over 30 yrs
- 0.78%
- Est. flood insurance / yr
- $473 – $860
Fire risk 1/10 · Minimal
- Est. fire insurance / yr
- $713 – $1,323
Heat risk 3/10 · Minor
- Hot days now (above 101°F)
- 7 days/yr
- Hot days in 30 yrs
- 16 days/yr
Wind risk 2/10 · Minimal
- Chance of severe wind over 30 yrs
- —
Air-quality risk 2/10 · Minimal
- Unhealthy air days now
- 1 days/yr
- Unhealthy air days in 30 yrs
- 3 days/yr
Risk factors via First Street. Map © Google.
Why this score? — see what drove the B grade
The composite is a weighted blend of 9 inputs, each scored 0–100. Each bar is that input's sub-score; the figure is the points it added to the 100-point composite (weight × sub-score).
- Cash flow +30.0/30.0
- ARV discount +13.2/15.0
- DSCR +10.0/10.0
- 1% rule +8.7/10.0
- Rent growth +4.0/5.0
- Livability +3.3/5.0
- Condition / age +2.5/5.0
- Schools +1.6/10.0
- Appreciation +0.0/10.0
$90,000
🖨 Deal sheet 📄 Offer letter ✓ Due diligence
Listing remarks MLS
Updated Kitchen and baths, electric updated in 2001, majority of windows are new, new carpet in bedrooms, rubber roofing on Airing deck, new furnace, siding and shutters. Priced below market. Great house for a great price.
Key facts
- 5,201 sq ft lot
- Garage
- Built 1927
Neighborhood map
What this means for you Summary
Snapshot
- This is a 3-bed/1.5-bath single-family listed at $90k.
Deal economics
- At list price, monthly cash flow is $309 ($4k/yr) — positive.
- The deal already cash-flows at list — no discount required.
- Meets the 1% rule at list price ($1k rent vs $90k).
- Recommended offer: $79k (12.0% below list) — sets the bar for market timing.
- Cap rate 11.2% vs local median 7.6% in Toledo — top-decile yield for the area; either an underpriced asset or a hidden risk that comps aren't pricing in. Stress-test before assuming the spread holds.
Location & tenants
- Location reads 66/100 on livability (#645 in OH) — a middle-class / working-renter tenant base. Strengths: cost of living A+, housing A+, health & safety A+; Watch: amenities C-, crime F, commute F.
- Toledo City (urban): math 15% / reading 24% proficiency, ranked #634 of 656 in OH (top 97%) — low school quality limits family demand, transient renter base, plan for 1-2y turnover; 72% free/reduced lunch — lower-income household profile, screen leases tightly.
- Zoned schools: Whittier Elementary School (math 6% / reading 13%, grade F, #1,505 of 1,584 statewide, top 95%, 509 students, 0% FRL); Start High School (math 11% / reading 33%, grade F, #672 of 781 statewide, top 86%, 1,242 students, 50% FRL) — zoned schools average 25% FRL vs 72% district-wide (47 pts lower); this property's tenant base skews higher-income than the district average.
- Market conditions: Rents rising fast (+6.0%/yr); 92 active listings in the ZIP; 38 comparable units currently listed for rent nearby; rentals at typical pace (median 23d on market — plan ~3-4 weeks tenant-placement turnaround); 415 units permitted in Lucas County in 2024 (122 in 5+ unit buildings).
Forward outlook
- Local home prices are declining (-3.0%/yr); year-one equity from $622 of loan paydown is wiped out by about $3k of value loss. Plan a longer hold.
- Lucas County population projected at -16% by 2050 — secular population decline; favor cash flow + early exit over multi-decade hold.
- At projected returns (-3.0% appreciation + 6.0% rent growth), your $25k cash investment doubles in ~7 years — after that, you're playing with house money.
Negotiation context
- It's been on market 157 days — a 12% lower offer ($79k) is reasonable based on typical stale-listing flexibility.
- 12 sale attempts since 26y ago with the ask held roughly flat each time — persistent listings suggest the price (not the market) is what's stuck; bring a comps-based counter.
Risks & watch-outs
- Watch-outs: flood insurance adds $56/mo; built in 1927 — expect roof / HVAC / electrical / plumbing capex.
- Climate carrying-cost: major flood risk — expect insurance premiums to compound above CPI over the hold.
Questions for the listing agent
- It's been on market 157 days. Have you received any prior offers? Is the seller open to a 12% concession, seller financing, or rate buy-down credit?
- Built in 1927 — when were the roof, HVAC, electrical panel, plumbing, and water heater last replaced?
- What's the actual annual flood-insurance premium (NFIP or private), and is the property in a SFHA with mandatory coverage?
- Why hasn't it sold? Are there any deal-killer items the seller is aware of (foundation, flood, title, zoning, code violations)?
- Is there a deadline driving the sale (1031 exchange, divorce, estate, relocation)? That informs how much negotiation room exists.
- Schools are D-rated, which usually means shorter tenancies and higher turnover. Who's the typical renter profile here, and what's been the actual vacancy rate?
- Crime grade is F in this area — have there been break-ins, vandalism, or insurance claims at this property in the last 3 years? What carrier currently insures it and at what premium?
- What's the average days-on-market for RENTAL listings here right now (not sales)? A rising rental-DOM trend means longer vacancies and softer asking-rent achievability than the comps imply.
- What's the recent tenant-quality profile in this submarket — average credit score on applications, eviction rate, late-payment / NSF rate, and stable-employment percentage? A property-management company in the area should have these aggregated.
- How much new for-sale + rental construction is in the pipeline within 1–3 miles? Heavy new supply typically softens prices + rents 12–24 months out; constrained supply supports both.
Investment metrics
- 1% rule
- 1.37% ✓
- Cap rate
- 11.15%
- Cash-on-cash
- 17.35%
- DSCR
- 1.77
- GRM
- 6.1
CMA / ARV
- ARV (on-the-fly)
- $102,992
- Comps found
- 12
Show comp detail 12 sales within ~0.75 mi
| Address | Dist | Beds/Ba | Sqft | Sold | Price | $/sf | Match |
|---|---|---|---|---|---|---|---|
| 4321 Burnham Ave | 0.00mi | 3/1.5 | 1,256 (0%) | 0mo | $85,000 | $68 | 100 |
| 650 Dryden Dr | 0.04mi | 3/1.0 | 1,248 (-1%) | 1mo | $75,000 | $60 | 95 |
| 4227 Caroline Ave | 0.11mi | 3/1.5 | 1,210 (-4%) | 0mo | $134,500 | $111 | 88 |
| 3948 Vermaas Ave | 0.34mi | 3/1.0 | 1,296 (+3%) | 1mo | $60,000 | $46 | 76 |
| 3868 Eggeman Ave | 0.49mi | 3/1.0 | 1,262 (+0%) | 1mo | $70,000 | $55 | 73 |
| 3940 Vermaas Ave | 0.36mi | 3/1.0 | 1,305 (+4%) | 2mo | $70,000 | $54 | 73 |
| 610 Dryden Dr | 0.06mi | 3/1.5 | 1,087 (-14%) | 2mo | $71,500 | $66 | 73 |
| 439 W Capistrano Ave | 0.59mi | 3/1.0 | 1,244 (-1%) | 1mo | $116,000 | $93 | 68 |
| 4048 Asbury Dr | 0.25mi | 3/1.0 | 1,091 (-13%) | 0mo | $89,600 | $82 | 64 |
| 1204 Higley St | 0.68mi | 2/2.0 (-1) | 1,184 (-6%) | 1mo | $119,000 | $101 | 51 |
| 802 W Capistrano Ave | 0.61mi | 3/1.0 | 1,102 (-12%) | 1mo | $150,000 | $136 | 48 |
| 1221 Eleanor Ave | 0.61mi | 3/1.0 | 1,098 (-13%) | 1mo | $120,000 | $109 | 47 |
Match score weights: distance 35% · size 25% · config 20% · recency 20%. Top-matched comps best support the ARV.
Projected returns pro-forma
-3.0% appreciation · 6.01% rent growth · sell at horizon
- IRR
- 8.7%
- Equity multiple
- 1.36×
- Total profit
- $8,966
- Equity at exit
- $13,419
- IRR
- 20.5%
- Equity multiple
- 2.99×
- Total profit
- $50,054
- Equity at exit
- $7,782
Cash invested: $25,200 (down + closing). Projections, not guarantees.
Landlord ↔ Tenant lean methodology
- Overall (STATE)
- 73 Landlord-Friendly
- State Ohio
- 73 Landlord-Friendly · R+6
- County
- — inherits STATE
- City
- — inherits STATE
ZIP-level market 43612
- Home prices YoY
- -17.5%
- Rents YoY
- 6.0%
- Active inventory
- 92
- Price-to-rent
- 6.1×
Monthly cashflow live
- Estimated rent
- $1,229 high interval (Pro) →
- Mortgage (P&I)
- −$472
- Tax from tax record
- −$97 /mo · $1,167/yr
- Insurance
- −$38
- Flood insurance flood zone
- −$56 /mo · $666/yr
- HOA
- −$0
- Vacancy / Maint / Mgmt
- −$258
- Net cashflow
- $309
Break-even live
UW: 25.0% down · 7.5% · 30yr · 1.5% tax · 5.0% vac · 8.0% maint · 8.0% mgmt
Financing live
Cash to close
- Down payment
- $22,500
- Closing costs
- $2,700
- Reserves months
- —
- Total cash needed
- —
Loan-product check · same deal, 3 products live
Conventional
25% down · 7.5% · 30yr
- Down + closing
- —
- Monthly P&I
- —
- Monthly cashflow
- —
- DSCR
- —
- Eligible?
- —
Personal DTI + credit; lowest rate.
DSCR
20% down · 8.5% · 30yr
- Down + closing
- —
- Monthly P&I
- —
- Monthly cashflow
- —
- DSCR
- —
- Eligible?
- —
No personal income docs; deal must DSCR.
Hard money
10% down · 12.0% · 12mo
- Down + closing
- —
- Monthly P&I
- —
- Monthly cashflow
- —
- DSCR
- —
- Eligible?
- —
Short-term bridge; refi at stabilization.
Rent comps 38 comps
| Address | Beds | Baths | Sqft | Rent | $/sqft | DOM | Units | Dist |
|---|---|---|---|---|---|---|---|---|
| 4220 Caroline Ave Toledo, OH | 3.0 | 1.0 | 944 | $1,095 | $1.16 | 43d | 1 | 0.10mi |
| 4140 Caroline Ave Toledo, OH | 3.0 | 1.5 | 1378 | $1,650 | $1.20 | 23d | 1 | 0.14mi |
| 4406 Asbury Dr Toledo, OH | 4.0 | 2.0 | 1089 | $1,550 | $1.42 | 13d | 1 | 0.16mi |
| 4124 Vermaas Ave Toledo, OH | 2.0 | 1.0 | 1245 | $997 | $0.80 | 43d | 1 | 0.17mi |
| 4129 Vermaas Ave Toledo, OH | 3.0 | 1.5 | 1385 | $1,250 | $0.90 | 43d | 1 | 0.17mi |
| 4039 Vermaas Ave Toledo, OH | 2.0 | 1.0 | 900 | $900 | $1.00 | 23d | 1 | 0.23mi |
| 3905 Peru St Toledo, OH | 4.0 | 3.0 | 1548 | $1,300 | $0.84 | 21d | 1 | 0.33mi |
| 3950 Woodhaven Dr Toledo, OH | 2.0 | 1.0 | 1072 | $745 | $0.69 | 23d | 1 | 0.34mi |
| 1016 Mallett St Unit 1 Toledo, OH | 2.0 | 1.0 | 1300 | $900 | $0.69 | 43d | 1 | 0.43mi |
| 4158 Mayfield Dr Toledo, OH | 2.0 | 1.0 | 960 | $850 | $0.89 | 13d | 1 | 0.46mi |
| 4459 N Haven Ave Toledo, OH | 3.0 | 1.0 | 1416 | $1,200 | $0.85 | 13d | 1 | 0.56mi |
| 4138 N Lockwood Ave Toledo, OH | 2.0 | 1.0 | 1300 | $1,050 | $0.81 | 23d | 1 | 0.58mi |
| 1014 Berdan Ave Toledo, OH | 3.0 | 1.0 | 1215 | $1,200 | $0.99 | 43d | 1 | 0.65mi |
| 3615 Berkeley Dr Toledo, OH | 3.0 | 1.0 | 1096 | $1,400 | $1.28 | 13d | 1 | 0.78mi |
| 3915 Willys Pkwy Unit 3915 Toledo, OH | 3.0 | 1.0 | 1080 | $800 | $0.74 | 21d | 1 | 0.79mi |
| 4223 Birchall Rd Toledo, OH | 3.0 | 1.0 | 1338 | $1,395 | $1.04 | 23d | 1 | 0.91mi |
| 1338 Crestwood Rd Toledo, OH | 3.0 | 1.0 | 1000 | $1,250 | $1.25 | 13d | 1 | 0.91mi |
| 3805 Hoiles Ave Toledo, OH | 3.0 | 1.0 | 1370 | $1,025 | $0.75 | 23d | 1 | 0.97mi |
| 3725 Hoiles Ave Toledo, OH | 3.0 | 1.0 | 1180 | $1,245 | $1.06 | 23d | 1 | 0.98mi |
| 5207 Bennett Rd Toledo, OH | 2.0 | 2.0 | 1109 | $1,200 | $1.08 | 13d | 1 | 0.99mi |
| 4120 Parrakeet Ave Toledo, OH | 3.0 | 2.0 | 1410 | $1,450 | $1.03 | 43d | 1 | 1.00mi |
| 3541 Willys Pkwy Toledo, OH | 3.0 | 1.0 | 1113 | $1,400 | $1.26 | 43d | 1 | 1.00mi |
| 3713 Hazelhurst Ave Toledo, OH | 3.0 | 1.5 | 1352 | $1,700 | $1.26 | 43d | 1 | 1.05mi |
| 1477 W Sylvania Ave Toledo, OH | 3.0 | 1.0 | 1570 | $1,250 | $0.80 | 43d | 1 | 1.06mi |
| 614 Cadillac Ct Toledo, OH | 3.0 | 1.0 | 1581 | $1,075 | $0.68 | 23d | 1 | 1.08mi |
| 610 Cadillac Ct Toledo, OH | 3.0 | 1.0 | 1409 | $1,050 | $0.75 | 23d | 1 | 1.08mi |
| 4038 Lyman Ave Toledo, OH | 3.0 | 1.0 | 1175 | $1,395 | $1.19 | 43d | 1 | 1.09mi |
| 3606 Revere Dr Toledo, OH | 4.0 | 1.0 | 1320 | $1,500 | $1.14 | 43d | 1 | 1.16mi |
| 4614 Commonwealth Ave Toledo, OH | 3.0 | 1.5 | 1459 | $1,295 | $0.89 | 13d | 1 | 1.18mi |
| 31 W Oakland St Toledo, OH | 4.0 | 1.0 | 1188 | $1,249 | $1.05 | 23d | 1 | 1.20mi |
| 1489 Berdan Ave Toledo, OH | 3.0 | 1.0 | 1068 | $1,250 | $1.17 | 43d | 1 | 1.20mi |
| 927 W Northgate Pkwy Toledo, OH | 2.0 | 1.0 | 896 | $1,100 | $1.23 | 13d | 1 | 1.22mi |
| 59 E Hudson St Toledo, OH | 3.0 | 1.0 | 1368 | $1,100 | $0.80 | 43d | 1 | 1.23mi |
| 405 E Manhattan Blvd Toledo, OH | 2.0 | 1.0 | 1000 | $900 | $0.90 | 13d | 1 | 1.39mi |
| 2907 Rockwood Pl Toledo, OH | 3.0 | 1.0 | 1494 | $1,100 | $0.74 | 13d | 1 | 1.40mi |
| 4315 Garden Park Dr Toledo, OH | 3.0 | 1.0 | 1268 | $1,423 | $1.12 | 23d | 1 | 1.41mi |
| 425 Boston Pl Unit A Toledo, OH | 2.0 | 1.0 | 1200 | $895 | $0.75 | 23d | 1 | 1.47mi |
| 424 E Lake St Toledo, OH | 3.0 | 1.0 | 1228 | $1,075 | $0.88 | 13d | 1 | 1.48mi |
Listing history 37 events
-
2026-03-16status Pending
-
2026-01-14price $90,000
-
2025-12-24status Active
-
2025-12-12status Pending
-
2025-10-14price $84,500 222-char remark
Show marketing remark (265 chars)
GREAT OPPORTUNITY! FEATURES LARGE LIVING ROOM, FORMAL DINING, GOOD SIZE KITCHEN WITH BREAKFAST NOOK, UPDATED HALF BATH, 3 GOOD SIZE BED ROOMS, AND DETACHED GARAGE. Selling as-is. Must submit proof of funds with offer and allow 2-3 business days for seller response.
-
2025-10-14price $22,000 265-char remark
Show marketing remark (265 chars)
GREAT OPPORTUNITY! FEATURES LARGE LIVING ROOM, FORMAL DINING, GOOD SIZE KITCHEN WITH BREAKFAST NOOK, UPDATED HALF BATH, 3 GOOD SIZE BED ROOMS, AND DETACHED GARAGE. Selling as-is. Must submit proof of funds with offer and allow 2-3 business days for seller response.
-
2025-10-09price $78,500
-
2025-09-25$94,500 Active
-
2023-07-31soldstatus $1,315,000
-
2023-07-21soldstatus $46,964 Closed
-
2023-03-17status Pending
-
2023-03-17price $46,964
-
2023-02-19$35,000 Active
-
2014-04-18soldstatus $22,000 265-char remark
Show marketing remark (265 chars)
GREAT OPPORTUNITY! FEATURES LARGE LIVING ROOM, FORMAL DINING, GOOD SIZE KITCHEN WITH BREAKFAST NOOK, UPDATED HALF BATH, 3 GOOD SIZE BED ROOMS, AND DETACHED GARAGE. Selling as-is. Must submit proof of funds with offer and allow 2-3 business days for seller response.
-
2014-03-18price $22,900 265-char remark
Show marketing remark (265 chars)
GREAT OPPORTUNITY! FEATURES LARGE LIVING ROOM, FORMAL DINING, GOOD SIZE KITCHEN WITH BREAKFAST NOOK, UPDATED HALF BATH, 3 GOOD SIZE BED ROOMS, AND DETACHED GARAGE. Selling as-is. Must submit proof of funds with offer and allow 2-3 business days for seller response.
-
2014-03-12$22,900 265-char remark
Show marketing remark (265 chars)
GREAT OPPORTUNITY! FEATURES LARGE LIVING ROOM, FORMAL DINING, GOOD SIZE KITCHEN WITH BREAKFAST NOOK, UPDATED HALF BATH, 3 GOOD SIZE BED ROOMS, AND DETACHED GARAGE. Selling as-is. Must submit proof of funds with offer and allow 2-3 business days for seller response.
-
2013-10-15historical
-
2013-04-15$29,900
-
2008-01-20historical
-
2007-01-19$78,000
-
2007-01-11historical
-
2006-10-11historical
-
2006-04-11$85,900
-
2006-04-11$89,900
-
2005-10-26historical
-
2005-04-26$88,900
-
2005-04-13historical
-
2004-10-13$97,900
-
2002-12-17soldstatus $84,500
-
2002-12-13soldstatus $84,500 222-char remark
Show marketing remark (222 chars)
Updated Kitchen and baths, electric updated in 2001, majority of windows are new, new carpet in bedrooms, rubber roofing on Airing deck, new furnace, siding and shutters. Priced below market. Great house for a great price.
-
2002-09-16$84,900 222-char remark
Show marketing remark (222 chars)
Updated Kitchen and baths, electric updated in 2001, majority of windows are new, new carpet in bedrooms, rubber roofing on Airing deck, new furnace, siding and shutters. Priced below market. Great house for a great price.
-
2001-04-03soldstatus $78,500
-
2001-03-29soldstatus $78,500
-
2000-12-04$85,000
-
1988-10-26soldstatus $40,000
-
1986-11-05soldstatus $40,000
-
1981-03-27soldstatus $40,900
ⓘ Source: listings_history table (triggers on properties + properties_extension) + one-shot
backfill from property_details.listing_events for pre-trigger history.
Tax reassessment forecast OH · Partial reset (capped growth)
- Current annual tax
- $1,167 · $97/mo
- Projected year-2 tax
- $1,286 · $107/mo
- Expected delta
- +$118/yr (+$10/mo · 10.2%)
ⓘ Screening estimate from a state-policy table — verify with the county assessor before closing.
Climate risk First Street
- Flood 7/10 Severe FEMA zone X (unshaded) · 78% chance over 30 yrs
- Wildfire 1/10 Low
- Heat 3/10 Moderate 7 d/yr ≥101°F today · 16 d/yr by 30 yrs out
- Wind 2/10 Low
- Air quality 2/10 Low 1 unhealthy d/yr today · 3 by 30 yrs out
Nearby sold comps map
Loading sold comps map…
Walkable amenities ~0.75 mi
Loading nearby amenities…
Taxation est. · year 1
- Rental income
- $14,751
- − Mortgage interest
- −$5,041
- − Property taxes
- −$1,167
- − Insurance
- −$1,116
- − Repairs & maintenance
- −$1,180
- − Management
- −$1,180
- − Depreciation
- −$2,618
- Taxable income
- $2,448
- Est. tax owed @ 24.0%
- −$588
- After-tax cash flow
- $3,119/yr
For passive investors: Depreciation is non-cash, so a rental often shows a tax loss while cash-flowing — sheltering income. Rental losses are passive: they offset passive income freely, and up to $25,000/yr can offset ordinary (W-2) income if you actively participate and your MAGI is under $100k (phasing out to $0 by $150k); unused losses carry forward. On sale, claimed depreciation is recaptured at up to 25%, and gains may owe capital-gains tax (a 1031 exchange can defer both). Figures are a year-1 estimate at your 24.0% rate — not tax advice; consult a CPA.
Schools (NCES district)
- District
- Toledo City
- NCES district ID
- 3904490
- Math proficiency
- 15% ▼ -16.00%
- Reading proficiency
- 24% ▼ -13.00%
- Median HH income
- $32,137
- Composite
- 15.76/100
- National rank
- #9276
- State rank
- #634 of 656 in OH
Livability — Toledo
- Score
- 66/100
- State rank
- #645
- US rank
- #11442
Category grades
Schools grade is shown separately in the Schools card above.
Census & demographics
- Census place
- Toledo, OH
- County
- Lucas County · 380,724 people
- City population
- 280,811
- Metro
- Toledo, OH
- Population (ZIP)
- 28,480
- Household income
- $50,728
- Rent vs Own
- Severe rent burden
- 1203.0
Population outlook (Lucas County) Hauer SSP2
- Today (2025)
- 420,751 people
- By 2030
- 410,187 · -2.5%
- By 2040
- 384,019 · -8.7%
- By 2050
- 355,125 · -15.6%
- By 2075
- 291,683 · -30.7%
- By 2100
- 233,670 · -44.5%
Race, ethnicity, and origin ACS 2023
- Neighborhood character
- Majority White (63%)
- Race & ethnicity
- White 63% Black 23% Two or more races 10% Hispanic / Latino 9%
- Hispanic origin (detail)
- Mexican 6% Puerto Rican 2%
- Common ancestry
- Romanian 9% Lithuanian 3% Italian 1%
- Foreign-born
- 2% · Canada
- Languages at home
- 96% English-only · Spanish 2% French/Haitian/Cajun 1%
Political lean MEDSL · Lucas
- 2024 margin
- D (+12.6) · D 55.8% · R 43.2%
- 2008→2024 swing
- -18.9pp toward R · 2008: 31.4pp · 2024: 12.6pp
- All cycles
- 2024: D+12.6 2020: D+16.8 2016: D+17.4 2012: D+30.4 2008: D+31.4
Not yet ingested
- Civics
- —
Market trends
- HPI YoY
- ▼ -50.05%
- Current HPI
- 235.5389
- Rent YoY
- ▲ 6.01%
- Metro
- Toledo, OH
- State GDP YoY
- ▲ 1.98%
- F500 in state
- 48
Industry mix (Fortune 500 HQ in OH)
| Industry | F500 HQs | Revenue |
|---|---|---|
| Insurance | 3 | $145B |
|
||
| Industrial Machinery | 3 | $49B |
|
||
| Financial Services | 3 | $24B |
|
||
| Consumer Goods | 2 | $93B |
|
||
| Aerospace / Defense | 2 | $47B |
|
||
| Utilities | 2 | $33B |
|
||
Price history
+120.0% since first listed37 events — show timeline
- 2026-03-16 Pending — NORIS
- 2026-01-14 Price Changed $90,000 NORIS
- 2025-12-24 Relisted — NORIS
- 2025-12-12 Pending — NORIS
- 2025-10-14 Price Changed $84,500 NORIS
- 2025-10-14 Price Changed $22,000 NORIS
- 2025-10-09 Price Changed $78,500 NORIS
- 2025-09-25 Listed $94,500 NORIS
- 2023-07-31 Sold (Public Records) $1,315,000 Public Records
- 2023-07-21 Sold (MLS) $46,964 NORIS
- 2023-03-17 Pending — NORIS
- 2023-03-17 Price Changed $46,964 NORIS
- 2023-02-19 Listed $35,000 NORIS
- 2014-04-18 Sold (MLS) $22,000 NORIS
- 2014-03-18 Price Changed $22,900 NORIS
- 2014-03-12 Listed $22,900 NORIS
- 2013-10-15 Listing Removed — NORIS
- 2013-04-15 Listed $29,900 NORIS
- 2008-01-20 Listing Removed — NORIS
- 2007-01-19 Listed $78,000 NORIS
- 2007-01-11 Listing Removed — NORIS
- 2006-10-11 Listing Removed — NORIS
- 2006-04-11 Listed $89,900 NORIS
- 2006-04-11 Listed $85,900 NORIS
- 2005-10-26 Listing Removed — NORIS
- 2005-04-26 Listed $88,900 NORIS
- 2005-04-13 Listing Removed — NORIS
- 2004-10-13 Listed $97,900 NORIS
- 2002-12-17 Sold (Public Records) $84,500 Public Records
- 2002-12-13 Sold (MLS) $84,500 NORIS
- 2002-09-16 Listed $84,900 NORIS
- 2001-04-03 Sold (Public Records) $78,500 Public Records
- 2001-03-29 Sold (MLS) $78,500 NORIS
- 2000-12-04 Listed $85,000 NORIS
- 1988-10-26 Sold (Public Records) $40,000 Public Records
- 1986-11-05 Sold (Public Records) $40,000 Public Records
- 1981-03-27 Sold (Public Records) $40,900 Public Records
Property tax history
-1.6%/yrLatest (2025): $1,167 · +31.2% YoY. Source: county tax records.
Cash-flow waterfall
monthlySold comps — $/sqft
last 12 mo · ≤1 miLoading sold comps…