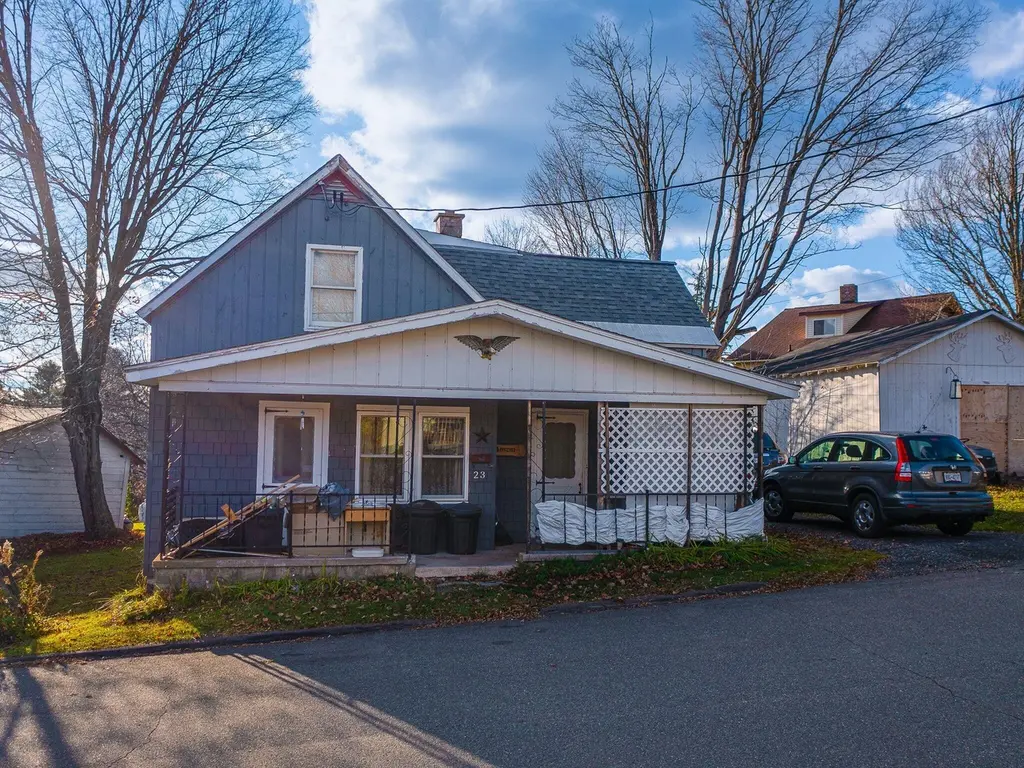
23 Front St · Tupper Lake, NY
Flood risk 1/10 · Minimal
- FEMA flood zone
- —
- Chance of flooding over 30 yrs
- 0.0%
- Est. flood insurance / yr
- —
Fire risk 1/10 · Minimal
- Est. fire insurance / yr
- $691 – $1,283
Heat risk 1/10 · Minimal
- Hot days now (above 88°F)
- 8 days/yr
- Hot days in 30 yrs
- 18 days/yr
Wind risk 1/10 · Minimal
- Chance of severe wind over 30 yrs
- —
Air-quality risk 1/10 · Minimal
- Unhealthy air days now
- 0 days/yr
- Unhealthy air days in 30 yrs
- 0 days/yr
Risk factors via First Street. Map © Google.
Why this score? — see what drove the B+ grade
The composite is a weighted blend of 9 inputs, each scored 0–100. Each bar is that input's sub-score; the figure is the points it added to the 100-point composite (weight × sub-score).
- Cash flow +30.0/30.0
- 1% rule +10.0/10.0
- DSCR +10.0/10.0
- ARV discount +7.5/15.0
- Appreciation +7.0/10.0
- Livability +3.3/5.0
- Schools +2.9/10.0
- Rent growth +2.5/5.0
- Condition / age +2.5/5.0
$70,000
🖨 Deal sheet 📄 Offer letter ✓ Due diligence
Listing remarks MLS
Bring your tools and imagination to 23 Front Street! This fixer-upper offers a convenient location in the heart of Tupper Lake, close to local shops, restaurants, and the scenic waterfront. Whether you're an investor, contractor, or ambitious homeowner, this ''as-is'' sale presents a chance to transform this diamond in the rough into something special.
Key facts
- Close to restaurants
- Scenic waterfront
- Heart of tupper lake
Tags
Neighborhood map
What this means for you Summary
Snapshot
- This is a 3-bed/1.0-bath single-family listed at $70k.
Deal economics
- At list price, monthly cash flow is $284 ($3k/yr) — positive.
- The deal already cash-flows at list — no discount required.
- Meets the 1% rule at list price ($1k rent vs $70k).
- Recommended offer: $62k (12.0% below list) — sets the bar for market timing.
- Cap rate 11.2% vs local median 1.7% in Tupper Lake — top-decile yield for the area; either an underpriced asset or a hidden risk that comps aren't pricing in. Stress-test before assuming the spread holds.
Location & tenants
- Location reads 66/100 on livability (#661 in NY) — a middle-class / working-renter tenant base. Strengths: cost of living A+, housing B+, crime B; Watch: health & safety C-, employment D+, schools D-.
- Tupper Lake Central School District (rural): math 36% / reading 31% proficiency, ranked #561 of 590 in NY (top 95%) — families likely to look elsewhere, expect single-tenant / working-renter base with shorter leases.
- Market conditions: 61 active listings in the ZIP; 124 units permitted in Franklin County in 2024 (0 in 5+ unit buildings).
Forward outlook
- In year one you build about $3k of equity ($484 loan paydown + $3k appreciation (4.0% local appreciation)).
- Franklin County population projected at -14% by 2050 — secular population decline; favor cash flow + early exit over multi-decade hold.
- At projected returns (4.0% appreciation + 3.0% rent growth), your $20k cash investment doubles in ~3 years — after that, you're playing with house money.
- By year 10, paydown + projected appreciation supports a ~$32k cash-out refi (75% LTV) — recoverable capital for the next deal without selling this one.
Negotiation context
- It's been on market 247 days — a 12% lower offer ($62k) is reasonable based on typical stale-listing flexibility.
- 3 sale attempts since 9y ago; this cycle's ask has dropped $10k (12%) from the opening price — seller is motivated, your offer sets the floor, not the list.
- Current owner paid $60k; 17% above their basis — modest negotiation headroom, anchor on the comps not their cost.
Risks & watch-outs
- Watch-outs: property tax is 2.8% of price; built in 1900 — expect roof / HVAC / electrical / plumbing capex.
Questions for the listing agent
- It's been on market 247 days. Have you received any prior offers? Is the seller open to a 12% concession, seller financing, or rate buy-down credit?
- Built in 1900 — when were the roof, HVAC, electrical panel, plumbing, and water heater last replaced?
- Property tax is high relative to price — has the assessment been appealed recently, and will the sale trigger a re-assessment?
- Why hasn't it sold? Are there any deal-killer items the seller is aware of (foundation, flood, title, zoning, code violations)?
- Is there a deadline driving the sale (1031 exchange, divorce, estate, relocation)? That informs how much negotiation room exists.
- Schools are D-rated, which usually means shorter tenancies and higher turnover. Who's the typical renter profile here, and what's been the actual vacancy rate?
- What's the average days-on-market for RENTAL listings here right now (not sales)? A rising rental-DOM trend means longer vacancies and softer asking-rent achievability than the comps imply.
- What's the recent tenant-quality profile in this submarket — average credit score on applications, eviction rate, late-payment / NSF rate, and stable-employment percentage? A property-management company in the area should have these aggregated.
- How much new for-sale + rental construction is in the pipeline within 1–3 miles? Heavy new supply typically softens prices + rents 12–24 months out; constrained supply supports both.
Investment metrics
- 1% rule
- 1.53% ✓
- Cap rate
- 11.15%
- Cash-on-cash
- 17.36%
- DSCR
- 1.77
- GRM
- 5.5
CMA / ARV
- ARV (median comp)
- $175,312
- List price
- $70,000
- Delta
- -60.07%
- Verdict
- UNDERPRICED
- Comps
- 20 within 1.0 mi
Show comp detail 11 sales within ~0.75 mi
| Address | Dist | Beds/Ba | Sqft | Sold | Price | $/sf | Match |
|---|---|---|---|---|---|---|---|
| 63 Wawbeek Ave | 0.05mi | 3/2.0 | 1,107 (+4%) | 8mo | $179,000 | $162 | 80 |
| 44 Lakeview Ave Ave | 0.27mi | 3/1.0 | 1,124 (+6%) | 8mo | $68,000 | $60 | 71 |
| 37 Broad St | 0.19mi | 3/1.5 | 1,160 (+9%) | 4mo | $180,000 | $155 | 70 |
| 28 High St | 0.10mi | 2/1.5 (-1) | 1,122 (+6%) | 18mo | $187,200 | $167 | 64 |
| 6 Mclaughlin Avenue Ave | 0.26mi | 3/1.5 | 1,200 (+13%) | 9mo | $190,000 | $158 | 57 |
| 12 Pleasant Ave | 0.36mi | 3/2.0 | 1,000 (-6%) | 19mo | $195,000 | $195 | 54 |
| 228 Park St | 0.36mi | 3/1.5 | 1,144 (+8%) | 20mo | $187,500 | $164 | 52 |
| 5 Cassell Lane Ln | 0.15mi | 4/2.0 (+1) | 1,207 (+14%) | 12mo | $236,500 | $196 | 51 |
| 83 Mclaughlin Ave Ave | 0.39mi | 2/1.0 (-1) | 988 (-7%) | 19mo | $165,000 | $167 | 50 |
| 14 Lindsay Ave | 0.33mi | 3/1.0 | 1,200 (+13%) | 22mo | $139,900 | $117 | 45 |
| 5 Becky Avenue Ave | 0.68mi | 3/2.0 | 1,152 (+8%) | 19mo | $252,000 | $219 | 34 |
Match score weights: distance 35% · size 25% · config 20% · recency 20%. Top-matched comps best support the ARV.
Projected returns pro-forma
3.95% appreciation · 3.0% rent growth · sell at horizon
- IRR
- 25.8%
- Equity multiple
- 2.54×
- Total profit
- $30,141
- Equity at exit
- $35,285
- IRR
- 25.8%
- Equity multiple
- 4.97×
- Total profit
- $77,830
- Equity at exit
- $57,549
Cash invested: $19,600 (down + closing). Projections, not guarantees.
Landlord ↔ Tenant lean methodology
- Overall (STATE)
- 15 Strongly Tenant-Friendly
- State New York
- 15 Strongly Tenant-Friendly · D+10
- County
- — inherits STATE
- City
- — inherits STATE
ZIP-level market 12986
- Home prices YoY
- 1.4%
- Active inventory
- 61
- Price-to-rent
- 5.5×
Monthly cashflow live
- Estimated rent
- $1,068 medium interval (Pro) →
- Mortgage (P&I)
- −$367
- Tax from tax record
- −$164 /mo · $1,965/yr
- Insurance
- −$29
- HOA
- −$0
- Vacancy / Maint / Mgmt
- −$224
- Net cashflow
- $284
Break-even live
UW: 25.0% down · 7.5% · 30yr · 1.5% tax · 5.0% vac · 8.0% maint · 8.0% mgmt
Financing live
Cash to close
- Down payment
- $17,500
- Closing costs
- $2,100
- Reserves months
- —
- Total cash needed
- —
Loan-product check · same deal, 3 products live
Conventional
25% down · 7.5% · 30yr
- Down + closing
- —
- Monthly P&I
- —
- Monthly cashflow
- —
- DSCR
- —
- Eligible?
- —
Personal DTI + credit; lowest rate.
DSCR
20% down · 8.5% · 30yr
- Down + closing
- —
- Monthly P&I
- —
- Monthly cashflow
- —
- DSCR
- —
- Eligible?
- —
No personal income docs; deal must DSCR.
Hard money
10% down · 12.0% · 12mo
- Down + closing
- —
- Monthly P&I
- —
- Monthly cashflow
- —
- DSCR
- —
- Eligible?
- —
Short-term bridge; refi at stabilization.
Listing history 26 events
-
2026-06-18days on market $70,000 Active 247 DOM
-
2026-06-17days on market $70,000 Active 246 DOM
-
2026-06-16days on market $70,000 Active 245 DOM
-
2026-06-15days on market $70,000 Active 244 DOM
-
2026-06-13days on market $70,000 Active 242 DOM
-
2026-06-12days on market $70,000 Active 241 DOM
-
2026-06-09days on market $70,000 Active 238 DOM
-
2026-06-08days on market $70,000 Active 237 DOM
-
2026-06-07days on market $70,000 Active 236 DOM
-
2026-06-07days on market $70,000 Active 235 DOM
-
2026-06-04days on market $70,000 Active 232 DOM
-
2026-06-02days on market $70,000 Active 231 DOM
-
2026-06-01days on market $70,000 Active 230 DOM
-
2026-05-31days on market $70,000 Active 229 DOM
-
2026-04-12price $70,000 355-char remark
Show marketing remark (355 chars)
Bring your tools and imagination to 23 Front Street! This fixer-upper offers a convenient location in the heart of Tupper Lake, close to local shops, restaurants, and the scenic waterfront. Whether you're an investor, contractor, or ambitious homeowner, this ''as-is'' sale presents a chance to transform this diamond in the rough into something special.
-
2025-10-14$79,900 Active 355-char remark
Show marketing remark (355 chars)
Bring your tools and imagination to 23 Front Street! This fixer-upper offers a convenient location in the heart of Tupper Lake, close to local shops, restaurants, and the scenic waterfront. Whether you're an investor, contractor, or ambitious homeowner, this ''as-is'' sale presents a chance to transform this diamond in the rough into something special.
-
2024-05-07soldstatus $60,000
-
2024-05-06soldstatus $60,000 Closed 139-char remark
Show marketing remark (139 chars)
Motivated seller. Bring an offer! This home is within walking distance to the TLHS and Park St businesses. This home is being sold 'AS IS'
-
2024-03-31status Pending 139-char remark
Show marketing remark (139 chars)
Motivated seller. Bring an offer! This home is within walking distance to the TLHS and Park St businesses. This home is being sold 'AS IS'
-
2024-03-01price $65,000 139-char remark
Show marketing remark (139 chars)
Motivated seller. Bring an offer! This home is within walking distance to the TLHS and Park St businesses. This home is being sold 'AS IS'
-
2024-02-26price $89,900 139-char remark
Show marketing remark (139 chars)
Motivated seller. Bring an offer! This home is within walking distance to the TLHS and Park St businesses. This home is being sold 'AS IS'
-
2023-11-20price $94,900 139-char remark
Show marketing remark (139 chars)
Motivated seller. Bring an offer! This home is within walking distance to the TLHS and Park St businesses. This home is being sold 'AS IS'
-
2023-11-06$99,900 Active 139-char remark
Show marketing remark (139 chars)
Motivated seller. Bring an offer! This home is within walking distance to the TLHS and Park St businesses. This home is being sold 'AS IS'
-
2018-06-06soldstatus $10,000
-
2017-10-05$24,900
-
2006-07-31soldstatus $63,600
ⓘ Source: listings_history table (triggers on properties + properties_extension) + one-shot
backfill from property_details.listing_events for pre-trigger history.
Tax reassessment forecast NY · Partial reset (capped growth)
- Current annual tax
- $1,965 · $164/mo
- Projected year-2 tax
- $1,965 · $164/mo
- Expected delta
- $0/yr ($0/mo · 0.0%)
ⓘ Screening estimate from a state-policy table — verify with the county assessor before closing.
Climate risk First Street
- Flood 1/10 Low 0% chance over 30 yrs
- Wildfire 1/10 Low
- Heat 1/10 Low 8 d/yr ≥88°F today · 18 d/yr by 30 yrs out
- Wind 1/10 Low
- Air quality 1/10 Low 0 unhealthy d/yr today · 0 by 30 yrs out
Nearby sold comps map
Loading sold comps map…
Walkable amenities ~0.75 mi
Loading nearby amenities…
Taxation est. · year 1
- Rental income
- $12,815
- − Mortgage interest
- −$3,921
- − Property taxes
- −$1,965
- − Insurance
- −$350
- − Repairs & maintenance
- −$1,025
- − Management
- −$1,025
- − Depreciation
- −$2,036
- Taxable income
- $2,492
- Est. tax owed @ 24.0%
- −$598
- After-tax cash flow
- $2,805/yr
For passive investors: Depreciation is non-cash, so a rental often shows a tax loss while cash-flowing — sheltering income. Rental losses are passive: they offset passive income freely, and up to $25,000/yr can offset ordinary (W-2) income if you actively participate and your MAGI is under $100k (phasing out to $0 by $150k); unused losses carry forward. On sale, claimed depreciation is recaptured at up to 25%, and gains may owe capital-gains tax (a 1031 exchange can defer both). Figures are a year-1 estimate at your 24.0% rate — not tax advice; consult a CPA.
Schools (NCES district)
- District
- Tupper Lake Central School District
- NCES district ID
- 3629160
- Math proficiency
- 36% ▲ 1.00%
- Reading proficiency
- 31% ▼ -1.00%
- Median HH income
- $50,543
- Composite
- 29.18/100
- National rank
- #6572
- State rank
- #561 of 590 in NY
Livability — Tupper Lake
- Score
- 66/100
- State rank
- #661
- US rank
- #12343
Category grades
Schools grade is shown separately in the Schools card above.
Census & demographics
- Census place
- Tupper Lake, NY
- City population
- 5,304
- Population (ZIP)
- 5,304
Population outlook (Franklin County) Hauer SSP2
- Today (2025)
- 48,098 people
- By 2030
- 46,790 · -2.7%
- By 2040
- 44,400 · -7.7%
- By 2050
- 41,256 · -14.2%
- By 2075
- 32,190 · -33.1%
- By 2100
- 23,407 · -51.3%
Race, ethnicity, and origin ACS 2023
- Neighborhood character
- Predominantly White (95%)
- Race & ethnicity
- White 95% Two or more races 2% Black 2% Hispanic / Latino 1%
- Common ancestry
- Lithuanian 20% Iranian 2% Slovak 2%
- Foreign-born
- 2% · Canada
- Languages at home
- 98% English-only · French/Haitian/Cajun 1%
Political lean MEDSL · Franklin
- 2024 margin
- Lean R (+9.0) · D 45.5% · R 54.5%
- 2008→2024 swing
- -31.2pp toward R · 2008: 22.2pp · 2024: -9.0pp
- All cycles
- 2024: R+9.0 2020: R+2.2 2016: R+7.4 2012: D+26.3 2008: D+22.2
Not yet ingested
- Civics
- —
Market trends
- HPI YoY
- ▲ 3.95%
- Current HPI
- 281.1979
- Rent YoY
- —
- Metro
- —
- State GDP YoY
- ▲ 2.60%
- F500 in state
- 92
Industry mix (Fortune 500 HQ in NY)
| Industry | F500 HQs | Revenue |
|---|---|---|
| Financial Services | 10 | $950B |
|
||
| Consumer Goods | 9 | $162B |
|
||
| Insurance | 4 | $225B |
|
||
| Telecommunications | 2 | $144B |
|
||
| Pharmaceuticals | 2 | $112B |
|
||
| Media / Entertainment | 2 | $69B |
|
||
Price history
+10.1% since first listed12 events — show timeline
- 2026-04-12 Price Changed $70,000 ACVMLS
- 2025-10-14 Listed $79,900 ACVMLS
- 2024-05-07 Sold (Public Records) $60,000 Public Records
- 2024-05-06 Sold (MLS) $60,000 ACVMLS
- 2024-03-31 Pending — ACVMLS
- 2024-03-01 Price Changed $65,000 ACVMLS
- 2024-02-26 Price Changed $89,900 ACVMLS
- 2023-11-20 Price Changed $94,900 ACVMLS
- 2023-11-06 Listed $99,900 ACVMLS
- 2018-06-06 Sold (MLS) $10,000 ACVMLS
- 2017-10-05 Listed $24,900 ACVMLS
- 2006-07-31 Sold (Public Records) $63,600 Public Records
Property tax history
+2.3%/yrLatest (2025): $1,965 · +4.0% YoY. Source: county tax records.
Cash-flow waterfall
monthlySold comps — $/sqft
last 12 mo · ≤1 miLoading sold comps…