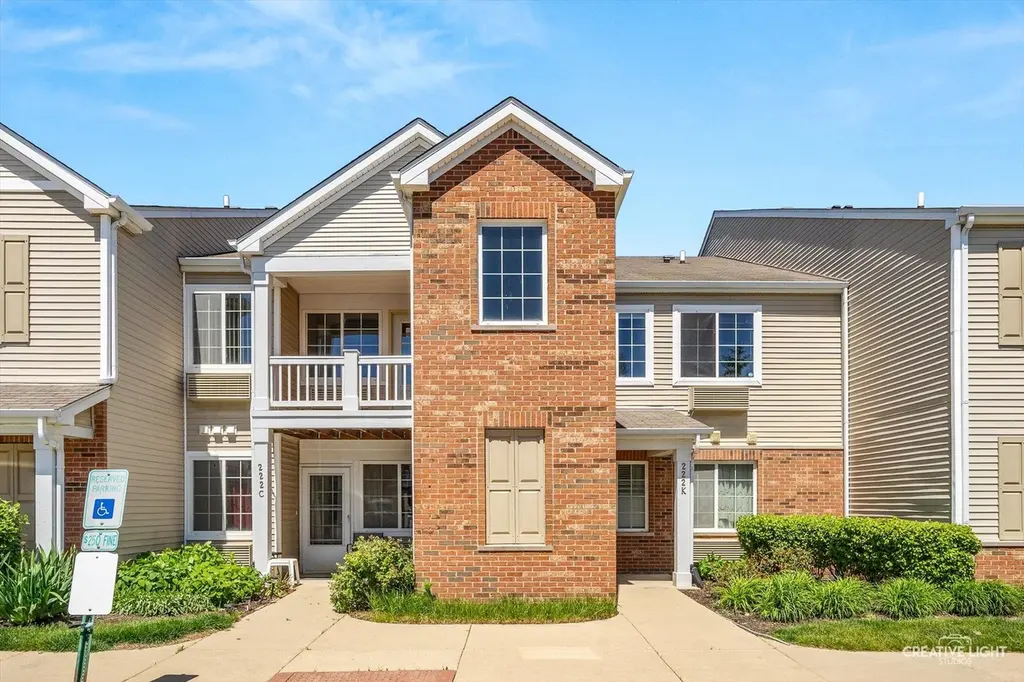
222 Bertram Dr Unit K · Yorkville, IL
Flood risk 1/10 · Minimal
- FEMA flood zone
- X (unshaded)
- Chance of flooding over 30 yrs
- 0.0%
- Est. flood insurance / yr
- $507 – $1,088
Fire risk 1/10 · Minimal
- Est. fire insurance / yr
- $804 – $1,492
Heat risk 3/10 · Minor
- Hot days now (above 102°F)
- 7 days/yr
- Hot days in 30 yrs
- 15 days/yr
Wind risk 2/10 · Minimal
- Chance of severe wind over 30 yrs
- 1.0%
Air-quality risk 3/10 · Minor
- Unhealthy air days now
- 3 days/yr
- Unhealthy air days in 30 yrs
- 4 days/yr
Risk factors via First Street. Map © Google.
Why this score? — see what drove the D grade
The composite is a weighted blend of 9 inputs, each scored 0–100. Each bar is that input's sub-score; the figure is the points it added to the 100-point composite (weight × sub-score).
- Cash flow +12.7/30.0
- ARV discount +7.5/15.0
- 1% rule +5.0/10.0
- Livability +4.3/5.0
- DSCR +3.8/10.0
- Schools +3.6/10.0
- Rent growth +2.5/5.0
- Condition / age +2.5/5.0
- Appreciation +0.0/10.0
$200,000
🖨 Deal sheet (PDF) 📄 Offer letter ✓ Due diligence
Listing remarks MLS
Clean 1 bedroom and Den, 1 bath condo sold "as is". Kitchen pass through to dining room and opens to living room. All kitchen appliances are in unit. Nice big bedroom and an open floor plan. Big walk in closet in the master bedroom. Price includes one car detached garage. This home is sold As-Is. Case #137-345635. List Date 5/5/2011. Information deemed reliable but not guaranteed.
Key facts
- Private deck
- Clubhouse
- Bonus room
Tags
Property features AI
Finance
- Other: Special service area present
- HOA & community: Condo association fee $348 annually; Association covers water, parking, clubhouse, exercise facilities, pool, exterior maintenance, lawn care, and snow removal; On-site management Monday through Friday; Pets allowed (cats and dogs)
Exterior
- Parking: Detached garage (owned), total parking for 2 vehicles, 1 garage space
- Utilities: Public water; Public sewer
- Home design: Attached single, condo ownership; Entry level: 2; Estimated living area; Condo building with 16 units
- Construction: Built approximately 16–20 years ago; Vinyl siding and brick exterior; Asphalt roof; Concrete perimeter foundation
- Exterior features: Balcony; Common grounds
Interior
- Kitchen: Range; Microwave; Dishwasher; Refrigerator; Freezer
- Bedrooms: Master bedroom on the main level (16 x 11) with blinds; Additional bedrooms (two listed)
- Flooring: Carpet in living room, dining area, master bedroom, and bonus room; Vinyl in kitchen
- Bathrooms: 1 full bathroom with soaking tub
- Heating & cooling: Forced air heating; Zoned cooling
- Interior features: Walk-in closet(s); Open floor plan; 5 total rooms; Some photos virtually staged
- Laundry & utility: In-unit laundry in a laundry closet (5 x 3); Washer; Dryer
Neighborhood map
What this means for you Summary
Snapshot
- This is a 1-bed/1.0-bath condo listed at $200k.
Deal economics
- At list price, monthly cash flow is $-20 ($-241/yr) — negative.
- To cash-flow at today's rent, offer at most $196k (1.8% below list).
- Meets the 1% rule at list price ($2k rent vs $200k).
- Recommended offer: $194k (3.0% below list) — sets the bar for market timing.
- Cap rate 6.2% vs local median 4.0% in Yorkville — top-decile yield for the area; either an underpriced asset or a hidden risk that comps aren't pricing in. Stress-test before assuming the spread holds.
Location & tenants
- Location reads 86/100 on livability (#25 in IL, #458 nationally) — a professional / high-income tenant draw. Strengths: crime A+, amenities A+, employment A+; Watch: commute F.
- Yorkville CUSD 115 (suburban): math 34% / reading 42% proficiency, ranked #131 of 620 in IL (top 21%) — families likely to look elsewhere, expect single-tenant / working-renter base with shorter leases; only 17% free/reduced lunch — higher-income household profile.
- Zoned schools: Bristol Bay Elem Sch (math 38% / reading 39%, grade F, #443 of 2,056 statewide, top 22%, 683 students, 0% FRL); Yorkville Middle School (math 33% / reading 47%, grade F, #140 of 665 statewide, top 22%, 1,105 students, 0% FRL); Yorkville High School (math 32% / reading 39%, grade F, #121 of 693 statewide, top 18%, 2,118 students, 0% FRL) — zoned schools average 0% FRL vs 17% district-wide (17 pts lower); this property's tenant base skews higher-income than the district average.
- Market conditions: 208 active listings in the ZIP; 4 comparable units currently listed for rent nearby; rentals leasing fast (median 4d on market — plan ~1-2 weeks tenant-placement turnaround); high-income renter base; 706 units permitted in Kendall County in 2024 (263 in 5+ unit buildings).
Forward outlook
- Local home prices are declining (-3.0%/yr); year-one equity from $1k of loan paydown is wiped out by about $6k of value loss. Plan a longer hold.
- Kendall County population projected at +20% by 2050 — long-run rental-demand tailwind backs the buy-and-hold thesis.
Negotiation context
- It's been on market 31 days — a 3% lower offer ($194k) is reasonable based on typical stale-listing flexibility.
- 6 sale attempts since 17y ago with the ask held roughly flat each time — persistent listings suggest the price (not the market) is what's stuck; bring a comps-based counter.
- Current owner paid $34k; list at $200k implies a 480% gain — meaningful room to come down on a strong offer.
Risks & watch-outs
- Watch-outs: property tax is 2.7% of price.
Questions for the listing agent
- What do current leases actually rent for vs. the listed asking? Can we see a recent rent roll and the last 12 months of T-12 income?
- It's been on market 31 days. Have you received any prior offers? Is the seller open to a 3% concession, seller financing, or rate buy-down credit?
- Property tax is high relative to price — has the assessment been appealed recently, and will the sale trigger a re-assessment?
- What does the HOA fee cover, when was the last increase, and are there any pending special assessments or reserve-fund shortfalls?
- Any open or pending special assessments — roof, HVAC, plumbing, elevator, façade? What's the per-unit balance and payoff schedule, and is the seller paying it off at close or rolling it to the buyer?
- Is there a deadline driving the sale (1031 exchange, divorce, estate, relocation)? That informs how much negotiation room exists.
- The area grade is low — what's the realistic commute time and amenity access for the typical tenant pool here? Any planned neighborhood developments (good or bad) we should know about?
- What's the average days-on-market for RENTAL listings here right now (not sales)? A rising rental-DOM trend means longer vacancies and softer asking-rent achievability than the comps imply.
- What's the recent tenant-quality profile in this submarket — average credit score on applications, eviction rate, late-payment / NSF rate, and stable-employment percentage? A property-management company in the area should have these aggregated.
- How much new apartment / multifamily construction is in the pipeline within 1–3 miles? Heavy new supply (>2% of stock underway) typically softens rents 12–24 months out; light construction supports rent growth.
Investment metrics
- 1% rule
- 1.00% ✓
- Cap rate
- 6.17%
- Cash-on-cash
- -0.43%
- DSCR
- 0.98
- GRM
- 8.3
CMA / ARV
No comps found within radius.
Projected returns pro-forma
-3.0% appreciation · 3.0% rent growth · sell at horizon
- IRR
- -16.9%
- Equity multiple
- 0.40×
- Total profit
- $-33,523
- Equity at exit
- $29,821
- IRR
- -8.6%
- Equity multiple
- 0.46×
- Total profit
- $-30,163
- Equity at exit
- $17,292
Cash invested: $56,000 (down + closing). Projections, not guarantees.
Landlord ↔ Tenant lean methodology
- Overall (STATE)
- 43 Moderately Tenant-Leaning
- State Illinois
- 43 Moderately Tenant-Leaning · D+7
- County
- — inherits STATE
- City
- — inherits STATE
ZIP-level market 60560
- Active inventory
- 208
- Price-to-rent
- 8.3×
Monthly cashflow live
- Estimated rent
- $2,006 medium interval (Pro) →
- Mortgage (P&I)
- −$1,049
- Tax from tax record
- −$443 /mo · $5,321/yr
- Insurance
- −$83
- HOA
- −$29
- Vacancy / Maint / Mgmt
- −$421
- Net cashflow
- $-20
Break-even live
Sensitivity live
| Price | -10% $93 | -5% $36 | +0% $-20 | +5% $-77 | +10% $-133 |
|---|---|---|---|---|---|
| Rent | -10% $-179 | -5% $-99 | +0% $-20 | +5% $59 | +10% $138 |
| Rate | -1.0pp $81 | -0.5pp $31 | base $-20 | +0.5pp $-72 | +1.0pp $-125 |
UW: 25.0% down · 7.5% · 30yr · 1.5% tax · 5.0% vac · 8.0% maint · 8.0% mgmt
Financing live
Cash to close
- Down payment
- $50,000
- Closing costs
- $6,000
- Reserves months
- —
- Total cash needed
- —
Loan-product check · same deal, 3 products live
Conventional
25% down · 7.5% · 30yr
- Down + closing
- —
- Monthly P&I
- —
- Monthly cashflow
- —
- DSCR
- —
- Eligible?
- —
Personal DTI + credit; lowest rate.
DSCR
20% down · 8.5% · 30yr
- Down + closing
- —
- Monthly P&I
- —
- Monthly cashflow
- —
- DSCR
- —
- Eligible?
- —
No personal income docs; deal must DSCR.
Hard money
10% down · 12.0% · 12mo
- Down + closing
- —
- Monthly P&I
- —
- Monthly cashflow
- —
- DSCR
- —
- Eligible?
- —
Short-term bridge; refi at stabilization.
Rent comps 4 comps
| Address | Beds | Baths | Sqft | Rent | $/sqft | DOM | Units | Dist |
|---|---|---|---|---|---|---|---|---|
| 222 Bertram Dr Unit I Yorkville, IL | 2.0 | 2.0 | 1150 | $2,100 | $1.83 | 19d | 1 | 0.02mi |
| 4575 Camden Ln Unit B Yorkville, IL | 2.0 | 1.5 | 1225 | $1,900 | $1.55 | 0d | 1 | 0.24mi |
| 4561 Garritano St Unit B Yorkville, IL | 2.0 | 1.5 | 1170 | $1,850 | $1.58 | 3d | 1 | 0.25mi |
| 271 Barrett Dr Yorkville, IL | 2.0–3.0 | 2.5 | 1606 | $2,650 | $1.65 | 0d | 9 | 0.31mi |
HOA detail condo
- Monthly dues
- $29 · $348/yr
- Assessments
- None detected in remarks — confirm with the listing agent.
Listing history 30 events
-
2026-06-21days on market $200,000 Active 31 DOM
-
2026-06-18days on market $200,000 Active 28 DOM
-
2026-06-17days on market $200,000 Active 27 DOM
-
2026-06-16days on market $200,000 Active 26 DOM
-
2026-06-15days on market $200,000 Active 25 DOM
-
2026-06-13days on market $200,000 Active 23 DOM
-
2026-06-13days on market $200,000 Active 22 DOM
-
2026-06-09days on market $200,000 Active 19 DOM
-
2026-06-08days on market $200,000 Active 18 DOM
-
2026-06-08days on market $200,000 Active 17 DOM
-
2026-06-04days on market $200,000 Active 14 DOM
-
2026-06-03days on market $200,000 Active 13 DOM
-
2026-06-02days on market $200,000 Active 12 DOM
-
2026-06-01days on market $200,000 Active 11 DOM
-
2026-05-31days on market $200,000 Active 10 DOM
-
2026-05-21$200,000 Active
-
2011-08-01soldstatus $34,500 Closed Sale 396-char remark
Show marketing remark (396 chars)
Clean 1 bedroom and Den, 1 bath condo sold "as is". Kitchen pass through to dining room and opens to living room. All kitchen appliances are in unit. Nice big bedroom and an open floor plan. Big walk in closet in the master bedroom. Price includes one car detached garage. This home is sold As-Is. Case #137-345635. List Date 5/5/2011. Information deemed reliable but not guaranteed.
-
2011-05-19status Pending 396-char remark
Show marketing remark (396 chars)
Clean 1 bedroom and Den, 1 bath condo sold "as is". Kitchen pass through to dining room and opens to living room. All kitchen appliances are in unit. Nice big bedroom and an open floor plan. Big walk in closet in the master bedroom. Price includes one car detached garage. This home is sold As-Is. Case #137-345635. List Date 5/5/2011. Information deemed reliable but not guaranteed.
-
2011-05-05$34,000 New 396-char remark
Show marketing remark (396 chars)
Clean 1 bedroom and Den, 1 bath condo sold "as is". Kitchen pass through to dining room and opens to living room. All kitchen appliances are in unit. Nice big bedroom and an open floor plan. Big walk in closet in the master bedroom. Price includes one car detached garage. This home is sold As-Is. Case #137-345635. List Date 5/5/2011. Information deemed reliable but not guaranteed.
-
2011-05-05historical
Show marketing remark (396 chars)
Clean 1 bedroom and Den, 1 bath condo sold "as is". Kitchen pass through to dining room and opens to living room. All kitchen appliances are in unit. Nice big bedroom and an open floor plan. Big walk in closet in the master bedroom. Price includes one car detached garage. This home is sold As-Is. Case #137-345635. List Date 5/5/2011. Information deemed reliable but not guaranteed.
-
2011-05-02historical
-
2011-05-02New
-
2011-03-29New
-
2011-03-29historical
-
2011-02-11New
-
2010-01-01historical
-
2009-08-11price Price Change
-
2009-06-08price
-
2009-03-13price
-
2009-02-17
ⓘ Source: listings_history table (triggers on properties + properties_extension) + one-shot
backfill from property_details.listing_events for pre-trigger history.
Tax reassessment forecast IL · Partial reset (capped growth)
- Current annual tax
- $5,321 · $443/mo
- Projected year-2 tax
- $5,321 · $443/mo
- Expected delta
- $0/yr ($0/mo · 0.0%)
ⓘ Screening estimate from a state-policy table — verify with the county assessor before closing.
Climate risk First Street
- Flood 1/10 Low FEMA zone X (unshaded) · 0% chance over 30 yrs
- Wildfire 1/10 Low
- Heat 3/10 Moderate 7 d/yr ≥102°F today · 15 d/yr by 30 yrs out
- Wind 2/10 Low 100% chance of damaging wind over 30 yrs
- Air quality 3/10 Moderate 3 unhealthy d/yr today · 4 by 30 yrs out
Nearby sold comps map
Loading sold comps map…
Walkable amenities ~0.75 mi
Loading nearby amenities…
Taxation est. · year 1
- Rental income
- $24,068
- − Mortgage interest
- −$11,203
- − Property taxes
- −$5,321
- − Insurance
- −$1,000
- − Repairs & maintenance
- −$1,925
- − Management
- −$1,925
- − HOA
- −$348
- − Depreciation
- −$5,818
- Taxable loss
- −$3,473
- Est. tax savings @ 24.0%
- +$834
- After-tax cash flow
- $592/yr
For passive investors: Depreciation is non-cash, so a rental often shows a tax loss while cash-flowing — sheltering income. Rental losses are passive: they offset passive income freely, and up to $25,000/yr can offset ordinary (W-2) income if you actively participate and your MAGI is under $100k (phasing out to $0 by $150k); unused losses carry forward. On sale, claimed depreciation is recaptured at up to 25%, and gains may owe capital-gains tax (a 1031 exchange can defer both). Figures are a year-1 estimate at your 24.0% rate — not tax advice; consult a CPA.
Schools (NCES district)
- District
- Yorkville CUSD 115
- NCES district ID
- 1743960
- Math proficiency
- 34% ▼ -4.00%
- Reading proficiency
- 42% ▼ -8.00%
- Median HH income
- $84,742
- Composite
- 36.13/100
- National rank
- #4746
- State rank
- #131 of 620 in IL
Livability — Yorkville
- Score
- 86/100
- State rank
- #25
- US rank
- #458
Category grades
Schools grade is shown separately in the Schools card above.
Census & demographics
- Census place
- Yorkville, IL
- County
- Kendall County · 71,842 people
- City population
- 28,795
- Metro
- Chicago-Naperville-Elgin, IL-IN-WI
- Population (ZIP)
- 28,795
- Household income
- $110,326
- Rent vs Own
- Severe rent burden
- 224.0
Population outlook (Kendall County) Hauer SSP2
- Today (2025)
- 138,283 people
- By 2030
- 144,935 · +4.8%
- By 2040
- 156,944 · +13.5%
- By 2050
- 165,424 · +19.6%
- By 2075
- 174,715 · +26.3%
- By 2100
- 168,523 · +21.9%
Race, ethnicity, and origin ACS 2023
- Neighborhood character
- Predominantly White (73%)
- Race & ethnicity
- White 73% Hispanic / Latino 18% Two or more races 11% Black 5% Asian 3%
- Hispanic origin (detail)
- Mexican 17%
- Common ancestry
- Romanian 7% Lithuanian 2% Scotch-Irish 2%
- Foreign-born
- 6% · Canada, China
- Languages at home
- 84% English-only · Spanish 12% Other Indo-European 2%
Political lean MEDSL · Kendall
- 2024 margin
- Toss-up / Even · D 50.0% · R 48.5% · Other 1.6%
- 2008→2024 swing
- -5.7pp toward R · 2008: 7.2pp · 2024: 1.5pp
- All cycles
- 2024: D+1.5 2020: D+5.7 2016: R+1.5 2012: R+4.1 2008: D+7.2
Not yet ingested
- Civics
- —
Market trends
- HPI YoY
- ▼ -122.51%
- Current HPI
- 208.8709
- Rent YoY
- —
- Metro
- Chicago-Naperville-Elgin, IL-IN-WI
- State GDP YoY
- ▲ 1.59%
- F500 in state
- 60
Industry mix (Fortune 500 HQ in IL)
| Industry | F500 HQs | Revenue |
|---|---|---|
| Insurance | 4 | $201B |
|
||
| Consumer Goods | 4 | $87B |
|
||
| Industrial Machinery | 3 | $64B |
|
||
| Healthcare | 2 | $55B |
|
||
| Retail / Pharmacy | 1 | $148B |
|
||
| Agriculture / Food | 1 | $86B |
|
||
Price history
+488.2% since first listed15 events — show timeline
- 2026-05-21 Listed $200,000 MRED as Distributed by MLS Grid
- 2011-08-01 Sold (MLS) $34,500 MRED as Distributed by MLS Grid
- 2011-05-19 Pending — MRED as Distributed by MLS Grid
- 2011-05-05 Listed $34,000 MRED as Distributed by MLS Grid
- 2011-05-05 Listing Removed — MRED as Distributed by MLS Grid
- 2011-05-02 Listing Removed — MRED as Distributed by MLS Grid
- 2011-05-02 Listed — MRED as Distributed by MLS Grid
- 2011-03-29 Listed — MRED as Distributed by MLS Grid
- 2011-03-29 Listing Removed — MRED as Distributed by MLS Grid
- 2011-02-11 Listed — MRED as Distributed by MLS Grid
- 2010-01-01 Listing Removed — MRED as Distributed by MLS Grid
- 2009-08-11 Price Changed — MRED as Distributed by MLS Grid
- 2009-06-08 Price Changed — MRED as Distributed by MLS Grid
- 2009-03-13 Price Changed — MRED as Distributed by MLS Grid
- 2009-02-17 Listed — MRED as Distributed by MLS Grid
Property tax history
+4.6%/yrLatest (2024): $5,321 · +1.8% YoY. Source: county tax records.
Cash-flow waterfall
monthlySold comps — $/sqft
last 12 mo · ≤1 miLoading sold comps…