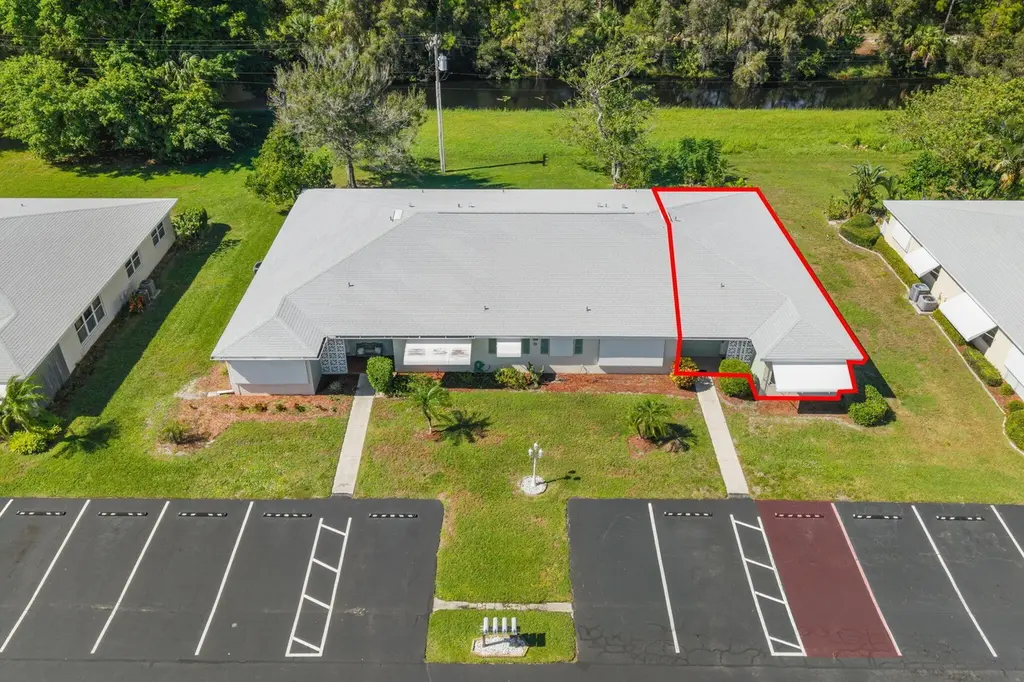
109 Lakes End Dr Unit D · Fort Pierce, FL
Flood risk 4/10 · Minor
- FEMA flood zone
- X (unshaded)
- Chance of flooding over 30 yrs
- 0.22%
- Est. flood insurance / yr
- $507 – $1,088
Fire risk 3/10 · Minor
- Est. fire insurance / yr
- $947 – $1,759
Heat risk 10/10 · Severe
- Hot days now (above 106°F)
- 8 days/yr
- Hot days in 30 yrs
- 27 days/yr
Wind risk 10/10 · Severe
- Chance of severe wind over 30 yrs
- 99.0%
Air-quality risk 2/10 · Minimal
- Unhealthy air days now
- 1 days/yr
- Unhealthy air days in 30 yrs
- 1 days/yr
Risk factors via First Street. Map © Google.
Why this score? — see what drove the C- grade
The composite is a weighted blend of 9 inputs, each scored 0–100. Each bar is that input's sub-score; the figure is the points it added to the 100-point composite (weight × sub-score).
- Cash flow +15.2/30.0
- 1% rule +10.0/10.0
- ARV discount +7.5/15.0
- DSCR +4.7/10.0
- Rent growth +4.4/5.0
- Livability +3.8/5.0
- Schools +3.7/10.0
- Condition / age +2.5/5.0
- Appreciation +0.0/10.0
$109,000
🖨 Deal sheet (PDF) 📄 Offer letter ✓ Due diligence
Listing remarks
Light & Bright furnished corner unit that is close to POOL & Club House. Tile floors in living areas, indoor/outdoor carpet in FL RM, & carpet in bedrooms. Crown molding throughout, FL RM has AC vent therefore is including in total living area. Electric panel has been changed. Kitchen equipped with all major appliances & features newer Formica counters. Sellers installed additional storage cabinets in Guest Bedroom. AC new in 2016; water pipes are PVC through attic. Accordion shutters on all windows except for front FL RM window which had been changed. Disappearing screen doors on front & back doors. Open Patio with outdoor furniture + grill. Unit is situated on
Key facts
- $627 HOA
- Parking
- Community pool
Property features AI
Finance
- Other: Association fee includes cable TV, insurance, internet, grounds and structure maintenance, pest control, security, sewer, trash, water, common areas, common real estate tax, reserve funds, roof repairs, recreation facility and pool service; Not a land-lease property; Senior community
- Financial info: Pets allowed (cats only; pet restrictions possible); Community contains 812 units
- HOA & community: Active homeowners association (High Point of Ft Pierce Section 1); Quarterly association fee; Association amenities include clubhouse, pool, billiard room, shuffleboard, bocce ball, jogging path, picnic area, community room, library, kitchen facilities, laundry, manager on site, parking, courtesy bus, maintained community, recreation facilities, internet included, security
Exterior
- Parking: Assigned parking; Guest parking; Asphalt parking; 1 open parking space (total 1)
- Security: Gated community with guard; Security gate; Security guard; Closed-circuit cameras; Security lights; Smoke detectors
- Utilities: Public water; Public sewer; Cable available; Electricity available; Underground utilities; Water available; Sewer available
- Home design: Condominium; One story; Entry-level living area; Faces east; Resale condition
- Construction: Block/Concrete/CBS construction; Composition/fiberglass/shingle roof; Slab foundation; Built in public records (living area 1,284)
- Exterior features: Open patio; Patio; Paved private road frontage; Not waterfront
Interior
- Kitchen: Dishwasher; Electric range; Microwave; Refrigerator; Garbage disposal; Trash compactor; Electric water heater
- Bedrooms: 2 bedrooms on the main level
- Flooring: Carpet; Ceramic tile
- Bathrooms: 2 full bathrooms on the main level
- Heating & cooling: Central heating (electric); Central air; Ceiling fan(s)
- Interior features: Built-in features; Entrance foyer; Walk-in closet(s); Closet cabinetry; Pull-down stairs; Bedroom layout - stacked
- Laundry & utility: Laundry room; Common area laundry
Neighborhood map
What this means for you Summary
Snapshot
- This is a 2-bed/2.0-bath condo listed at $109k.
Deal economics
- At list price, monthly cash flow is $39 ($465/yr) — positive.
- The deal already cash-flows at list — no discount required.
- Meets the 1% rule at list price ($2k rent vs $109k).
- Recommended offer: $106k (3.0% below list) — sets the bar for market timing.
Location & tenants
- Location reads 76/100 on livability (#226 in FL, #3,360 nationally) — a middle-class / working-renter tenant base. Strengths: commute A+, cost of living A+, housing A+; Watch: crime D+, amenities F, employment F.
- St. Lucie (urban): math 40% / reading 48% proficiency, ranked #51 of 73 in FL (top 70%) — families likely to look elsewhere, expect single-tenant / working-renter base with shorter leases.
- Zoned schools: Weatherbee Elementary School (math 32% / reading 32%, grade F, #1,797 of 2,144 statewide, top 86%, 672 students, 90% FRL); Dan Mccarty Middle School (math 23% / reading 23%, grade F, #542 of 571 statewide, top 95%, 747 students, 88% FRL); Fort Pierce Central High School (math 15% / reading 45%, grade F, #441 of 667 statewide, top 67%, 3,091 students, 62% FRL) — zoned schools average 80% FRL vs 59% district-wide (21 pts higher); higher-poverty schools than district average — tighter screening recommended.
- Zoned-school proficiency averages 28% at this address vs 44% district-wide (-16 pts) — the specific schools serving this property underperform the St. Lucie average; the district grade overstates school quality for this exact location.
- Market conditions: Rents rising fast (+7.4%/yr); 336 active listings in the ZIP; 28 comparable units currently listed for rent nearby; rentals at typical pace (median 25d on market — plan ~3-4 weeks tenant-placement turnaround); 4,868 units permitted in St. Lucie County in 2024 (268 in 5+ unit buildings).
Forward outlook
- Local home prices are declining (-3.0%/yr); year-one equity from $754 of loan paydown is wiped out by about $3k of value loss. Plan a longer hold.
- St. Lucie County population projected at +20% by 2050 — long-run rental-demand tailwind backs the buy-and-hold thesis.
- At projected returns (-3.0% appreciation + 7.4% rent growth), your $31k cash investment doubles in ~9 years — after that, you're playing with house money.
Negotiation context
- It's been on market 43 days — a 3% lower offer ($106k) is reasonable based on typical stale-listing flexibility.
- 10 sale attempts since 21y ago with the ask held roughly flat each time — persistent listings suggest the price (not the market) is what's stuck; bring a comps-based counter.
- Current owner paid $32k; list at $109k implies a 241% gain — meaningful room to come down on a strong offer.
Risks & watch-outs
- Watch-outs: HOA is 34% of rent.
- Climate carrying-cost: severe wind risk, 99% chance of damaging wind over 30y; extreme-heat days projected 8→27/yr by 2055 (HVAC capex compounding) — expect insurance premiums to compound above CPI over the hold.
Questions for the listing agent
- It's been on market 43 days. Have you received any prior offers? Is the seller open to a 3% concession, seller financing, or rate buy-down credit?
- Built in 1975 — when were the roof, HVAC, electrical panel, plumbing, and water heater last replaced?
- What does the HOA fee cover, when was the last increase, and are there any pending special assessments or reserve-fund shortfalls?
- Any open or pending special assessments — roof, HVAC, plumbing, elevator, façade? What's the per-unit balance and payoff schedule, and is the seller paying it off at close or rolling it to the buyer?
- Is there a deadline driving the sale (1031 exchange, divorce, estate, relocation)? That informs how much negotiation room exists.
- Schools are D-rated, which usually means shorter tenancies and higher turnover. Who's the typical renter profile here, and what's been the actual vacancy rate?
- Crime grade is D in this area — have there been break-ins, vandalism, or insurance claims at this property in the last 3 years? What carrier currently insures it and at what premium?
- What's the average days-on-market for RENTAL listings here right now (not sales)? A rising rental-DOM trend means longer vacancies and softer asking-rent achievability than the comps imply.
- What's the recent tenant-quality profile in this submarket — average credit score on applications, eviction rate, late-payment / NSF rate, and stable-employment percentage? A property-management company in the area should have these aggregated.
- How much new apartment / multifamily construction is in the pipeline within 1–3 miles? Heavy new supply (>2% of stock underway) typically softens rents 12–24 months out; light construction supports rent growth.
Investment metrics
- 1% rule
- 1.69% ✓
- Cap rate
- 6.72%
- Cash-on-cash
- 1.52%
- DSCR
- 1.07
- GRM
- 4.9
CMA / ARV
No comps found within radius.
Projected returns pro-forma
-3.0% appreciation · 7.42% rent growth · sell at horizon
- IRR
- -5.0%
- Equity multiple
- 0.80×
- Total profit
- $-6,189
- Equity at exit
- $16,252
- IRR
- 11.8%
- Equity multiple
- 2.25×
- Total profit
- $38,091
- Equity at exit
- $9,424
Cash invested: $30,520 (down + closing). Projections, not guarantees.
Landlord ↔ Tenant lean methodology
- Overall (STATE)
- 87 Strongly Landlord-Friendly
- State Florida
- 87 Strongly Landlord-Friendly · R+3
- County
- — inherits STATE
- City
- — inherits STATE
ZIP-level market 34982
- Home prices YoY
- -33.4%
- Rents YoY
- 7.4%
- Active inventory
- 336
- Price-to-rent
- 4.9×
Monthly cashflow live
- Estimated rent
- $1,845 high interval (Pro) →
- Mortgage (P&I)
- −$572
- Tax from tax record
- −$175 /mo · $2,096/yr
- Insurance
- −$45
- HOA
- −$627
- Vacancy / Maint / Mgmt
- −$387
- Net cashflow
- $39
Break-even live
Sensitivity live
| Price | -10% $100 | -5% $70 | +0% $39 | +5% $8 | +10% $-23 |
|---|---|---|---|---|---|
| Rent | -10% $-107 | -5% $-34 | +0% $39 | +5% $112 | +10% $184 |
| Rate | -1.0pp $94 | -0.5pp $66 | base $39 | +0.5pp $10 | +1.0pp $-18 |
UW: 25.0% down · 7.5% · 30yr · 1.5% tax · 5.0% vac · 8.0% maint · 8.0% mgmt
Financing live
Cash to close
- Down payment
- $27,250
- Closing costs
- $3,270
- Reserves months
- —
- Total cash needed
- —
Loan-product check · same deal, 3 products live
Conventional
25% down · 7.5% · 30yr
- Down + closing
- —
- Monthly P&I
- —
- Monthly cashflow
- —
- DSCR
- —
- Eligible?
- —
Personal DTI + credit; lowest rate.
DSCR
20% down · 8.5% · 30yr
- Down + closing
- —
- Monthly P&I
- —
- Monthly cashflow
- —
- DSCR
- —
- Eligible?
- —
No personal income docs; deal must DSCR.
Hard money
10% down · 12.0% · 12mo
- Down + closing
- —
- Monthly P&I
- —
- Monthly cashflow
- —
- DSCR
- —
- Eligible?
- —
Short-term bridge; refi at stabilization.
Rent comps 28 comps
| Address | Beds | Baths | Sqft | Rent | $/sqft | DOM | Units | Dist |
|---|---|---|---|---|---|---|---|---|
| 916 Savannas Point Dr Fort Pierce, FL | 2.0 | 2.0 | 1120 | $2,100 | $1.88 | 15d | 1 | 0.05mi |
| 322 Colony Ln Unit C Fort Pierce, FL | 1.0 | 1.5 | 816 | $1,375 | $1.69 | 25d | 1 | 0.24mi |
| 1829 Sandhill Crane Dr Unit B2 Fort Pierce, FL | 2.0 | 2.0 | 1334 | $2,000 | $1.50 | 25d | 1 | 0.28mi |
| 1219 S Lakes End Dr Unit 2 Fort Pierce, FL | 2.0 | 2.0 | 1186 | $1,500 | $1.26 | 15d | 1 | 0.30mi |
| 1804 Blue Heron Ln Unit C Fort Pierce, FL | 2.0 | 2.0 | 1286 | $1,900 | $1.48 | 25d | 1 | 0.37mi |
| 1772 N Dovetail Dr Unit C Fort Pierce, FL | 2.0 | 2.0 | 1230 | $2,100 | $1.71 | 25d | 1 | 0.40mi |
| 1739 N Dovetail Dr Fort Pierce, FL | 2.0 | 2.0 | 1230 | $1,750 | $1.42 | 25d | 1 | 0.42mi |
| 1747 N Dovetail Dr Unit A Fort Pierce, FL | 2.0 | 2.0 | 1286 | $2,100 | $1.63 | 25d | 1 | 0.43mi |
| 3200 S US Highway 1 Fort Pierce, FL | 2.0–3.0 | 1.0–2.0 | 1144 | $1,509 | $1.32 | 15d | 1 | 0.55mi |
| 3300 S 7th St Unit B Fort Pierce, FL | 2.0 | 1.0 | 800 | $1,595 | $1.99 | 25d | 1 | 0.74mi |
| 3030 S US Highway 1 Fort Pierce, FL | 3.0 | 2.0 | 1184 | $1,774 | $1.50 | 15d | 1 | 0.80mi |
| 4166 Gator Trace Villas Cir Unit B Fort Pierce, FL | 3.0 | 2.0 | 1336 | $2,200 | $1.65 | 25d | 1 | 0.84mi |
| 802 N Lake Dr Unit B Fort Pierce, FL | 2.0 | 1.0 | 1000 | $1,550 | $1.55 | 25d | 1 | 0.84mi |
| 928 Fra Mar Pl Fort Pierce, FL | 3.0 | 1.0 | 1440 | $2,000 | $1.39 | 25d | 1 | 0.92mi |
| 800 Kanner Dr Unit B Fort Pierce, FL | 2.0 | 1.0 | 900 | $1,550 | $1.72 | 15d | 1 | 0.95mi |
| 947 Fra Mar Pl Fort Pierce, FL | 2.0 | 1.0 | 768 | $1,700 | $2.21 | 25d | 1 | 0.98mi |
| 4215 Gator Trace Ave Unit G Fort Pierce, FL | 2.0 | 2.0 | 1200 | $2,200 | $1.83 | 25d | 1 | 1.00mi |
| 605 Ixoria Ave Fort Pierce, FL | 2.0 | 2.0 | 744 | $1,450 | $1.95 | 15d | 2 | 1.07mi |
| 605 Ixoria Ave #15 Fort Pierce, FL | 2.0 | 2.0 | 744 | $1,500 | $2.02 | 25d | 1 | 1.10mi |
| 617 Ixoria Ave Unit 2A Fort Pierce, FL | 2.0 | 2.5 | 764 | $1,500 | $1.96 | 25d | 1 | 1.14mi |
| 410 Palm Ave Apt B Fort Pierce, FL | 2.0 | 1.0 | 800 | $1,400 | $1.75 | 15d | 1 | 1.16mi |
| 2902 Oleander Blvd Fort Pierce, FL | 3.0 | 2.0 | 1276 | $2,700 | $2.12 | 25d | 1 | 1.26mi |
| 4210 Gator Trace Cir Fort Pierce, FL | 2.0 | 2.0 | 1316 | $2,100 | $1.60 | 15d | 1 | 1.27mi |
| 115 Maple Ave Fort Pierce, FL | 3.0 | 1.0 | 1008 | $1,999 | $1.98 | 25d | 1 | 1.29mi |
| 2625 Heathcote Dr Unit 2647 Fort Pierce, FL | 2.0 | 2.0 | 1000 | $1,700 | $1.70 | 22d | 1 | 1.29mi |
| 2625 Heathcote Dr Unit 2623 Fort Pierce, FL | 2.0 | 2.0 | 1000 | $1,700 | $1.70 | 25d | 1 | 1.29mi |
| 2625 Heathcote Dr Unit 2631 Fort Pierce, FL | 2.0 | 2.0 | 1000 | $1,700 | $1.70 | 15d | 1 | 1.29mi |
| 4591 Whispering Pines Ln Fort Pierce, FL | 2.0 | 1.0–2.0 | 576 | $1,850 | $3.21 | 25d | 1 | 1.38mi |
HOA detail condo
- Monthly dues
- $627 · $7,524/yr
- Likely covers
- waterelectricpool
- Assessments
- None detected in remarks — confirm with the listing agent.
Listing history 42 events
-
2026-06-18status $109,000 Pending 43 DOM
-
2026-06-17days on market $109,000 Active Under Contract 43 DOM
-
2026-06-16days on market $109,000 Active Under Contract 42 DOM
-
2026-06-15days on market $109,000 Active Under Contract 41 DOM
-
2026-06-14days on market $109,000 Active Under Contract 39 DOM
-
2026-06-13days on market $109,000 Active Under Contract 38 DOM
-
2026-06-10days on market $109,000 Active Under Contract 36 DOM
-
2026-06-09days on market $109,000 Active Under Contract 35 DOM
-
2026-06-08days on market $109,000 Active Under Contract 34 DOM
-
2026-06-07days on market $109,000 Active Under Contract 33 DOM
-
2026-06-05days on market $109,000 Active Under Contract 30 DOM
-
2026-06-03days on market $109,000 Active Under Contract 29 DOM
-
2026-06-02days on market $109,000 Active Under Contract 28 DOM
-
2026-06-01days on market $109,000 Active Under Contract 27 DOM
-
2026-05-31days on market $109,000 Active Under Contract 26 DOM
-
2026-05-30days on market $109,000 Active Under Contract 25 DOM
-
2026-05-05$109,000 Active
-
2026-03-12historical Active Under Contract
-
2026-03-12historical
-
2026-02-26price $109,000
-
2025-10-29$130,000 Active
-
2025-08-05historical
-
2025-04-04$147,500 Active
-
2024-12-04historical
-
2024-06-04$174,500 Active
-
2015-10-09historical
-
2014-10-21historical
-
2014-10-13historical
-
2014-09-27historical
-
2014-04-16soldstatus $32,000
-
2013-09-21historical
-
2012-05-18$37,900
-
2009-02-03$48,500
-
2007-07-10$107,000
-
2007-01-04$106,000
-
2006-03-30soldstatus $105,000
-
2006-03-23soldstatus $105,000
-
2006-02-08historical
-
2005-09-14$110,000
-
2005-03-21$112,000
-
1979-10-01soldstatus $37,000
-
1974-11-01soldstatus $22,500
ⓘ Source: listings_history table (triggers on properties + properties_extension) + one-shot
backfill from property_details.listing_events for pre-trigger history.
Tax reassessment forecast FL · Resets to sale price
- Current annual tax
- $2,096 · $175/mo
- Projected year-2 tax
- $2,096 · $175/mo
- Expected delta
- $0/yr ($0/mo · 0.0%)
ⓘ Screening estimate from a state-policy table — verify with the county assessor before closing.
Climate risk First Street
- Flood 4/10 Moderate FEMA zone X (unshaded) · 22% chance over 30 yrs
- Wildfire 3/10 Moderate
- Heat 10/10 Extreme 8 d/yr ≥106°F today · 27 d/yr by 30 yrs out
- Wind 10/10 Extreme 99% chance of damaging wind over 30 yrs
- Air quality 2/10 Low 1 unhealthy d/yr today · 1 by 30 yrs out
Nearby sold comps map
Loading sold comps map…
Walkable amenities ~0.75 mi
Loading nearby amenities…
Taxation est. · year 1
- Rental income
- $22,138
- − Mortgage interest
- −$6,106
- − Property taxes
- −$2,096
- − Insurance
- −$545
- − Repairs & maintenance
- −$1,771
- − Management
- −$1,771
- − HOA
- −$7,524
- − Depreciation
- −$3,171
- Taxable loss
- −$846
- Est. tax savings @ 24.0%
- +$203
- After-tax cash flow
- $668/yr
For passive investors: Depreciation is non-cash, so a rental often shows a tax loss while cash-flowing — sheltering income. Rental losses are passive: they offset passive income freely, and up to $25,000/yr can offset ordinary (W-2) income if you actively participate and your MAGI is under $100k (phasing out to $0 by $150k); unused losses carry forward. On sale, claimed depreciation is recaptured at up to 25%, and gains may owe capital-gains tax (a 1031 exchange can defer both). Figures are a year-1 estimate at your 24.0% rate — not tax advice; consult a CPA.
Schools (NCES district)
- District
- St. Lucie
- NCES district ID
- 1201770
- Math proficiency
- 40% ▼ -11.00%
- Reading proficiency
- 48% ▼ -4.00%
- Median HH income
- $44,737
- Composite
- 37.28/100
- National rank
- #4449
- State rank
- #51 of 73 in FL
Livability — Fort Pierce
- Score
- 76/100
- State rank
- #226
- US rank
- #3360
Category grades
Schools grade is shown separately in the Schools card above.
Census & demographics
- Census place
- Fort Pierce, FL
- County
- Saint Lucie County · 337,150 people
- City population
- 78,556
- Metro
- Port St. Lucie, FL
- Population (ZIP)
- 31,143
- Household income
- $54,082
- Rent vs Own
- Severe rent burden
- 1086.0
Population outlook (St. Lucie County) Hauer SSP2
- Today (2025)
- 338,016 people
- By 2030
- 355,687 · +5.2%
- By 2040
- 385,521 · +14.1%
- By 2050
- 406,106 · +20.1%
- By 2075
- 441,054 · +30.5%
- By 2100
- 436,885 · +29.2%
Race, ethnicity, and origin ACS 2023
- Neighborhood character
- Majority White (62%)
- Race & ethnicity
- White 62% Hispanic / Latino 22% Two or more races 12% Black 12%
- Hispanic origin (detail)
- Mexican 10% Puerto Rican 3% Cuban 3%
- Common ancestry
- Italian 7% Hispanic 2% Lithuanian 1%
- Foreign-born
- 12% · Canada
- Languages at home
- 80% English-only · Spanish 16% French/Haitian/Cajun 3%
Political lean MEDSL · St. Lucie
- 2024 margin
- Lean R (+9.1) · D 45.1% · R 54.2%
- 2008→2024 swing
- -21.2pp toward R · 2008: 12.1pp · 2024: -9.1pp
- All cycles
- 2024: R+9.1 2020: R+1.6 2016: R+2.5 2012: D+7.9 2008: D+12.1
Not yet ingested
- Civics
- —
Market trends
- HPI YoY
- ▼ -199.47%
- Current HPI
- 397.2649
- Rent YoY
- ▲ 7.42%
- Metro
- Port St. Lucie, FL
- State GDP YoY
- ▲ 3.28%
- F500 in state
- 36
Industry mix (Fortune 500 HQ in FL)
| Industry | F500 HQs | Revenue |
|---|---|---|
| Industrial Technology | 2 | $29B |
|
||
| Insurance | 2 | $17B |
|
||
| Retail | 1 | $60B |
|
||
| Technology Distribution | 1 | $58B |
|
||
| Homebuilding | 1 | $35B |
|
||
| Technology Manufacturing | 1 | $35B |
|
||
Price history
+384.4% since first listed26 events — show timeline
- 2026-05-05 Listed $109,000 Beaches MLS
- 2026-03-12 Contingent — Beaches MLS
- 2026-03-12 Listing Removed — Beaches MLS
- 2026-02-26 Price Changed $109,000 Beaches MLS
- 2025-10-29 Listed $130,000 Beaches MLS
- 2025-08-05 Listing Removed — Beaches MLS
- 2025-04-04 Listed $147,500 Beaches MLS
- 2024-12-04 Listing Removed — Beaches MLS
- 2024-06-04 Listed $174,500 Beaches MLS
- 2015-10-09 Listing Removed — Beaches MLS
- 2014-10-21 Listing Removed — Beaches MLS
- 2014-10-13 Listing Removed — Beaches MLS
- 2014-09-27 Listing Removed — Beaches MLS
- 2014-04-16 Sold (Public Records) $32,000 Public Records
- 2013-09-21 Listing Removed — Beaches MLS
- 2012-05-18 Listed $37,900 Beaches MLS
- 2009-02-03 Listed $48,500 Beaches MLS
- 2007-07-10 Listed $107,000 Beaches MLS
- 2007-01-04 Listed $106,000 Beaches MLS
- 2006-03-30 Sold (Public Records) $105,000 Public Records
- 2006-03-23 Sold (MLS) $105,000 Beaches MLS
- 2006-02-08 Listing Removed — Beaches MLS
- 2005-09-14 Listed $110,000 Beaches MLS
- 2005-03-21 Listed $112,000 Beaches MLS
- 1979-10-01 Sold (Public Records) $37,000 Public Records
- 1974-11-01 Sold (Public Records) $22,500 Public Records
Property tax history
+31.2%/yrLatest (2025): $2,096 · -3.3% YoY. Source: county tax records.
Cash-flow waterfall
monthlySold comps — $/sqft
last 12 mo · ≤1 miLoading sold comps…