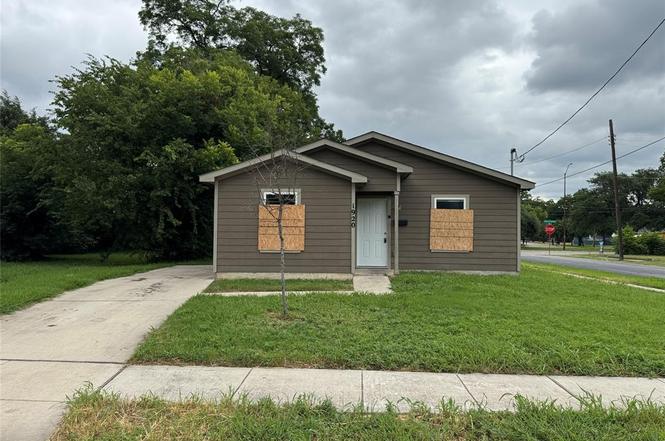
1920 Jb Jackson Jr Blvd Unit J · Dallas, TX
Flood risk 6/10 · Moderate
- FEMA flood zone
- X (unshaded)
- Chance of flooding over 30 yrs
- 0.71%
- Est. flood insurance / yr
- $507 – $1,088
Fire risk 1/10 · Minimal
- Est. fire insurance / yr
- $1,222 – $2,270
Heat risk 7/10 · Major
- Hot days now (above 110°F)
- 7 days/yr
- Hot days in 30 yrs
- 25 days/yr
Wind risk 6/10 · Moderate
- Chance of severe wind over 30 yrs
- 27.0%
Air-quality risk 3/10 · Minor
- Unhealthy air days now
- 2 days/yr
- Unhealthy air days in 30 yrs
- 3 days/yr
Risk factors via First Street. Map © Google.
Why this score? — see what drove the C grade
The composite is a weighted blend of 9 inputs, each scored 0–100. Each bar is that input's sub-score; the figure is the points it added to the 100-point composite (weight × sub-score).
- Cash flow +15.3/30.0
- ARV discount +15.0/15.0
- 1% rule +6.7/10.0
- Appreciation +5.5/10.0
- DSCR +4.7/10.0
- Livability +4.0/5.0
- Schools +2.8/10.0
- Rent growth +2.5/5.0
- Condition / age +2.5/5.0
$119,900
🖨 Deal sheet (PDF) 📄 Offer letter ✓ Due diligence
Listing remarks
Multiple Offers Received- highest & best due 06-18-26. This 3-bedroom home sits on a corner lot and offers a blank canvas for those looking to bring their vision to life. The home features a functional floor plan with living area off the entry, galley kitchen, three bedrooms, two full bathrooms, and utility room with washer & dryer hookups. Nice size backyard with some trees. Open parking in driveway or on street available. Conveniently located in South Dallas- minutes from Fair Park and all that downtown has to offer! Bring your contractor, imagination, and vision to unlock the potential of this property.
Key facts
- Utility room
- Galley kitchen
- Nice size backyard
Tags
Property features AI
Finance
- Other: Municipal utility district: No
- Financial info: Treat as clear loan type; No second mortgage
- HOA & community: No association
Exterior
- Parking: Driveway; No garage or covered/carport spaces
- Utilities: City water; City sewer; Sidewalk
- Home design: Single family residence; One story; Residential property; Preowned (built 2020)
- Construction: Shingle roof; Siding exterior; Slab foundation; Built in 2020
- Exterior features: Corner lot; No fencing
Interior
- Kitchen: Galley kitchen
- Bedrooms: Primary bedroom (level 1) — 10 x 10; Bedroom (level 1) — 9 x 9; Bedroom (level 1) — 9 x 9
- Bathrooms: 2 full bathrooms
- Heating & cooling: Central heating; Central air
- Interior features: Open floorplan; One living area; Galley kitchen
- Laundry & utility: Electric dryer hookup; Utility room — 8 x 3
Neighborhood map
What this means for you Summary
Snapshot
- This is a 3-bed/2.0-bath single-family listed at $120k.
Deal economics
- At list price, monthly cash flow is $44 ($527/yr) — positive.
- The deal already cash-flows at list — no discount required.
- Meets the 1% rule at list price ($1k rent vs $120k).
- Cap rate 6.7% vs local median 2.3% in Dallas — top-decile yield for the area; either an underpriced asset or a hidden risk that comps aren't pricing in. Stress-test before assuming the spread holds.
Location & tenants
- Location reads 81/100 on livability (#24 in TX, #1,380 nationally) — a professional / high-income tenant draw. Strengths: amenities A+, commute A+, housing A+; Watch: crime F.
- Dallas ISD (urban): math 31% / reading 36% proficiency, ranked #559 of 826 in TX (top 68%) — families likely to look elsewhere, expect single-tenant / working-renter base with shorter leases; 83% free/reduced lunch — lower-income household profile, screen leases tightly.
- Zoned schools: Paul L Dunbar Learning Center (math 27% / reading 22%, grade F, #3,052 of 4,322 statewide, top 74%, 531 students, 95% FRL); Billy Earl Dade Middle (math 18% / reading 23%, grade F, #1,407 of 1,662 statewide, top 86%, 636 students, 100% FRL); James Madison H S (math 17% / reading 17%, grade F, #1,491 of 1,632 statewide, top 92%, 359 students, 96% FRL).
- Zoned-school proficiency averages 21% at this address vs 34% district-wide (-13 pts) — the specific schools serving this property underperform the Dallas ISD average; the district grade overstates school quality for this exact location.
- Market conditions: 80 active listings in the ZIP; 35 comparable units currently listed for rent nearby; rentals leasing fast (median 13d on market — plan ~1-2 weeks tenant-placement turnaround); 12,577 units permitted in Dallas County in 2024 (6,829 in 5+ unit buildings).
Forward outlook
- In year one you build about $2k of equity ($829 loan paydown + $1k appreciation (1.1% local appreciation)).
- Dallas County population projected at +35% by 2050 — long-run rental-demand tailwind backs the buy-and-hold thesis.
- At projected returns (1.1% appreciation + 3.0% rent growth), your $34k cash investment doubles in ~9 years — after that, you're playing with house money.
Negotiation context
- Only 6 days on market — expect competitive offers; lowballing is unlikely to land.
Risks & watch-outs
- Watch-outs: property tax is 3.8% of price.
- Climate carrying-cost: major flood risk; major wind risk, 27% chance of damaging wind over 30y; extreme-heat days projected 7→25/yr by 2055 (HVAC capex compounding) — expect insurance premiums to compound above CPI over the hold.
Questions for the listing agent
- Property tax is high relative to price — has the assessment been appealed recently, and will the sale trigger a re-assessment?
- Is there a deadline driving the sale (1031 exchange, divorce, estate, relocation)? That informs how much negotiation room exists.
- Crime grade is F in this area — have there been break-ins, vandalism, or insurance claims at this property in the last 3 years? What carrier currently insures it and at what premium?
- What's the average days-on-market for RENTAL listings here right now (not sales)? A rising rental-DOM trend means longer vacancies and softer asking-rent achievability than the comps imply.
- What's the recent tenant-quality profile in this submarket — average credit score on applications, eviction rate, late-payment / NSF rate, and stable-employment percentage? A property-management company in the area should have these aggregated.
- How much new for-sale + rental construction is in the pipeline within 1–3 miles? Heavy new supply typically softens prices + rents 12–24 months out; constrained supply supports both.
Investment metrics
- 1% rule
- 1.17% ✓
- Cap rate
- 6.73%
- Cash-on-cash
- 1.57%
- DSCR
- 1.07
- GRM
- 7.1
CMA / ARV
- ARV (on-the-fly)
- $155,040
- Comps found
- 12
Show comp detail 12 sales within ~0.75 mi
| Address | Dist | Beds/Ba | Sqft | Sold | Price | $/sf | Match |
|---|---|---|---|---|---|---|---|
| 3519 Frank St | 0.34mi | 2/1.0 (-1) | 924 (+1%) | 4mo | $90,000 | $97 | 70 |
| 3121 Metropolitan Ave | 0.18mi | 2/2.0 (-1) | 843 (-8%) | 12mo | $249,900 | $296 | 64 |
| 3703 Dunbar St | 0.29mi | 2/1.0 (-1) | 978 (+7%) | 6mo | $120,000 | $123 | 61 |
| 3111 Mcdermott Ave | 0.29mi | 3/2.0 | 1,043 (+14%) | 4mo | $226,000 | $217 | 60 |
| 3827 Frank St | 0.50mi | 2/1.0 (-1) | 816 (-10%) | 2mo | $75,500 | $93 | 48 |
| 3238 Spring Ave | 0.51mi | 3/1.0 | 988 (+8%) | 14mo | $149,900 | $152 | 46 |
| 3115 Carpenter | 0.71mi | 2/1.0 (-1) | 842 (-8%) | 6mo | $169,000 | $201 | 40 |
| 2915 Reed Ln | 0.71mi | 2/1.0 (-1) | 836 (-8%) | 5mo | $175,000 | $209 | 40 |
| 2727 Morning Ave | 0.75mi | 3/2.0 | 989 (+8%) | 14mo | $100,000 | $101 | 40 |
| 3716 Dildock St | 0.71mi | 3/1.0 | 1,008 (+10%) | 8mo | $134,900 | $134 | 39 |
| 3022 Pine St | 0.65mi | 2/2.0 (-1) | 1,000 (+10%) | 16mo | $170,000 | $170 | 36 |
| 3600 Reed Ln | 0.68mi | 2/2.0 (-1) | 810 (-11%) | 20mo | $169,900 | $210 | 28 |
Match score weights: distance 35% · size 25% · config 20% · recency 20%. Top-matched comps best support the ARV.
Projected returns pro-forma
1.07% appreciation · 3.0% rent growth · sell at horizon
- IRR
- 3.3%
- Equity multiple
- 1.17×
- Total profit
- $5,597
- Equity at exit
- $41,348
- IRR
- 7.8%
- Equity multiple
- 1.96×
- Total profit
- $32,145
- Equity at exit
- $55,271
Cash invested: $33,572 (down + closing). Projections, not guarantees.
Landlord ↔ Tenant lean methodology
- Overall (STATE)
- 87 Strongly Landlord-Friendly
- State Texas
- 87 Strongly Landlord-Friendly · R+5
- County
- — inherits STATE
- City
- — inherits STATE
ZIP-level market 75210
- Home prices YoY
- 0.6%
- Active inventory
- 80
- Price-to-rent
- 7.1×
Monthly cashflow live
- Estimated rent
- $1,400 high interval (Pro) →
- Mortgage (P&I)
- −$629
- Tax from tax record
- −$383 /mo · $4,602/yr
- Insurance
- −$50
- HOA
- −$0
- Vacancy / Maint / Mgmt
- −$294
- Net cashflow
- $44
Break-even live
Sensitivity live
| Price | -10% $112 | -5% $78 | +0% $44 | +5% $10 | +10% $-24 |
|---|---|---|---|---|---|
| Rent | -10% $-67 | -5% $-11 | +0% $44 | +5% $99 | +10% $155 |
| Rate | -1.0pp $104 | -0.5pp $74 | base $44 | +0.5pp $13 | +1.0pp $-19 |
UW: 25.0% down · 7.5% · 30yr · 1.5% tax · 5.0% vac · 8.0% maint · 8.0% mgmt
Financing live
Cash to close
- Down payment
- $29,975
- Closing costs
- $3,597
- Reserves months
- —
- Total cash needed
- —
Loan-product check · same deal, 3 products live
Conventional
25% down · 7.5% · 30yr
- Down + closing
- —
- Monthly P&I
- —
- Monthly cashflow
- —
- DSCR
- —
- Eligible?
- —
Personal DTI + credit; lowest rate.
DSCR
20% down · 8.5% · 30yr
- Down + closing
- —
- Monthly P&I
- —
- Monthly cashflow
- —
- DSCR
- —
- Eligible?
- —
No personal income docs; deal must DSCR.
Hard money
10% down · 12.0% · 12mo
- Down + closing
- —
- Monthly P&I
- —
- Monthly cashflow
- —
- DSCR
- —
- Eligible?
- —
Short-term bridge; refi at stabilization.
Rent comps 35 comps
| Address | Beds | Baths | Sqft | Rent | $/sqft | DOM | Units | Dist |
|---|---|---|---|---|---|---|---|---|
| 3907 Roberts Ave Dallas, TX | 3.0 | 1.0 | 908 | $1,395 | $1.54 | 17d | 1 | 0.32mi |
| 3529 Herrling St Dallas, TX | 2.0 | 1.0 | 632 | $1,200 | $1.90 | 13d | 1 | 0.37mi |
| 2711 Cross St Dallas, TX | 2.0 | 1.0 | 700 | $1,249 | $1.78 | 1d | 1 | 0.47mi |
| 3408 Spring Ave Dallas, TX | 3.0 | 2.0 | 780 | $1,314 | $1.68 | 1d | 1 | 0.47mi |
| 3639 Pine St Dallas, TX | 3.0 | 2.0 | 1090 | $1,490 | $1.37 | 16d | 1 | 0.55mi |
| 4205 Metropolitan Ave Dallas, TX | 2.0 | 1.0 | 625 | $1,150 | $1.84 | 45d | 1 | 0.59mi |
| 3711 Guaranty St Dallas, TX | 3.0 | 1.0 | 984 | $1,800 | $1.83 | 17d | 1 | 0.62mi |
| 2545 Metropolitan Ave Dallas, TX | 3.0 | 1.0 | 936 | $1,750 | $1.87 | 1d | 1 | 0.66mi |
| 4303 Jamaica St Dallas, TX | 3.0 | 2.0 | 1027 | $1,299 | $1.26 | 1d | 1 | 0.69mi |
| 4024 Myrtle St Dallas, TX | 3.0 | 2.0 | 1106 | $1,595 | $1.44 | 7d | 1 | 0.73mi |
| 4506 Roberts Ave Dallas, TX | 2.0 | 2.0 | 1000 | $1,499 | $1.50 | 0d | 1 | 0.77mi |
| 3501 Latimer St Dallas, TX | 2.0 | 1.0 | 1008 | $1,095 | $1.09 | 5d | 1 | 0.77mi |
| 3526 Elsie Faye Heggins St Dallas, TX | 3.0 | 2.0 | 1113 | $1,795 | $1.61 | 26d | 1 | 0.93mi |
| 3526 Elsie Faye Heggins St Dallas, TX | 3.0 | 2.0 | 1113 | $1,795 | $1.61 | 9d | 1 | 0.93mi |
| 4525 Metropolitan Ave Dallas, TX | 3.0 | 2.0 | 1090 | $1,460 | $1.34 | 1d | 1 | 0.93mi |
| 2408 Meyers St Unit 204 Dallas, TX | 2.0 | 1.0 | 700 | $770 | $1.10 | 16d | 1 | 0.97mi |
| 3627 Sidney St Dallas, TX | 3.0 | 2.0 | 1090 | $1,600 | $1.47 | 1d | 1 | 0.97mi |
| 4722 Meadow St Dallas, TX | 2.0–3.0 | 2.0 | 1107 | $1,475 | $1.33 | 13d | 4 | 0.99mi |
| 2627 Elsie Faye Heggins St Dallas, TX | 3.0 | 2.0 | 876 | $1,280 | $1.46 | 45d | 1 | 1.10mi |
| 2615 Elsie Faye Heggins St Dallas, TX | 3.0 | 2.0 | 876 | $1,280 | $1.46 | 17d | 1 | 1.11mi |
| 2603 Elsie Faye Heggins St Dallas, TX | 3.0 | 2.0 | 876 | $1,385 | $1.58 | 45d | 1 | 1.12mi |
| 2563 Elsie Faye Heggins St Dallas, TX | 3.0 | 2.0 | 876 | $1,240 | $1.42 | 17d | 1 | 1.13mi |
| 2513 Southland St Dallas, TX | 2.0 | 1.0 | 1010 | $1,399 | $1.39 | 22d | 1 | 1.13mi |
| 2513 Southland St Dallas, TX | 2.0 | 1.0 | 1010 | $1,299 | $1.29 | 5d | 1 | 1.13mi |
| 2561 Elsie Faye Heggins St Dallas, TX | 3.0 | 2.0 | 876 | $1,390 | $1.59 | 8d | 1 | 1.13mi |
| 3910 Polly St Dallas, TX | 2.0 | 1.0 | 550 | $1,100 | $2.00 | 9d | 1 | 1.15mi |
| 4717 Owenwood Ave Dallas, TX | 3.0 | 2.0 | 1090 | $1,490 | $1.37 | 16d | 1 | 1.22mi |
| 2829 Oakdale St Dallas, TX | 3.0 | 2.0 | 1028 | $1,814 | $1.76 | 1d | 1 | 1.23mi |
| 1315 S Barry Ave Dallas, TX | 1.0–2.0 | 1.0 | 670 | $1,040 | $1.55 | 13d | 5 | 1.23mi |
| 3900 Commerce St Dallas, TX | 3.0 | 1.0–2.0 | 1217 | $3,925 | $3.22 | 1d | 10 | 1.24mi |
| 1724 Pear St Unit 1 Dallas, TX | 2.0 | 1.0 | 605 | $875 | $1.45 | 45d | 1 | 1.30mi |
| 2216 Marburg St Dallas, TX | 3.0 | 1.0 | 1088 | $1,750 | $1.61 | 0d | 1 | 1.31mi |
| 1630 Poplar St Dallas, TX | 2.0 | 1.0 | 903 | $1,400 | $1.55 | 26d | 1 | 1.33mi |
| 1628 Poplar St Dallas, TX | 2.0 | 1.0 | 903 | $1,400 | $1.55 | 45d | 1 | 1.34mi |
| 5221 Grovewood St Dallas, TX | 3.0 | 1.5 | 840 | $1,400 | $1.67 | 45d | 1 | 1.37mi |
Listing history 6 events
-
2026-06-21days on market $119,900 Active 6 DOM
-
2026-06-18remarks 617-char remark
-
2026-06-18days on market $119,900 Active 3 DOM
-
2026-06-17days on market $119,900 Active 2 DOM
-
2026-06-15remarks 560-char remark
-
2026-06-15$119,900 Active 1 DOM
ⓘ Source: listings_history table (triggers on properties + properties_extension) + one-shot
backfill from property_details.listing_events for pre-trigger history.
Tax reassessment forecast TX · Resets to sale price
- Current annual tax
- $4,602 · $383/mo
- Projected year-2 tax
- $4,602 · $383/mo
- Expected delta
- $0/yr ($0/mo · 0.0%)
ⓘ Screening estimate from a state-policy table — verify with the county assessor before closing.
Climate risk First Street
- Flood 6/10 Major FEMA zone X (unshaded) · 71% chance over 30 yrs
- Wildfire 1/10 Low
- Heat 7/10 Severe 7 d/yr ≥110°F today · 25 d/yr by 30 yrs out
- Wind 6/10 Major 27% chance of damaging wind over 30 yrs
- Air quality 3/10 Moderate 2 unhealthy d/yr today · 3 by 30 yrs out
Nearby sold comps map
Loading sold comps map…
Walkable amenities ~0.75 mi
Loading nearby amenities…
Taxation est. · year 1
- Rental income
- $16,803
- − Mortgage interest
- −$6,716
- − Property taxes
- −$4,602
- − Insurance
- −$600
- − Repairs & maintenance
- −$1,344
- − Management
- −$1,344
- − Depreciation
- −$3,488
- Taxable loss
- −$1,292
- Est. tax savings @ 24.0%
- +$310
- After-tax cash flow
- $837/yr
For passive investors: Depreciation is non-cash, so a rental often shows a tax loss while cash-flowing — sheltering income. Rental losses are passive: they offset passive income freely, and up to $25,000/yr can offset ordinary (W-2) income if you actively participate and your MAGI is under $100k (phasing out to $0 by $150k); unused losses carry forward. On sale, claimed depreciation is recaptured at up to 25%, and gains may owe capital-gains tax (a 1031 exchange can defer both). Figures are a year-1 estimate at your 24.0% rate — not tax advice; consult a CPA.
Schools (NCES district)
- District
- Dallas ISD
- NCES district ID
- 4816230
- Math proficiency
- 31% ▼ -16.00%
- Reading proficiency
- 36% ▼ -4.00%
- Median HH income
- $42,881
- Composite
- 28.41/100
- National rank
- #6763
- State rank
- #559 of 826 in TX
Livability — Dallas
- Score
- 81/100
- State rank
- #24
- US rank
- #1380
Category grades
Schools grade is shown separately in the Schools card above.
Census & demographics
- Census place
- Dallas, TX
- City population
- 1,168,437
- Population (ZIP)
- 7,458
Population outlook (Dallas County) Hauer SSP2
- Today (2025)
- 2,979,839 people
- By 2030
- 3,191,823 · +7.1%
- By 2040
- 3,619,611 · +21.5%
- By 2050
- 4,026,915 · +35.1%
- By 2075
- 4,957,073 · +66.4%
- By 2100
- 5,508,725 · +84.9%
Race, ethnicity, and origin ACS 2023
- Neighborhood character
- Majority Black (56%)
- Race & ethnicity
- Black 56% Hispanic / Latino 39% Two or more races 12% White 3% Asian 2%
- Hispanic origin (detail)
- Mexican 17%
- Foreign-born
- 23% · Canada, Vietnam
- Languages at home
- 66% English-only · Spanish 32% Vietnamese 2%
Political lean MEDSL · Dallas
- 2024 margin
- Strong D (+22.2) · D 60.2% · R 38.0% · Other 1.8%
- 2008→2024 swing
- +6.9pp toward D · 2008: 15.3pp · 2024: 22.2pp
- All cycles
- 2024: D+22.2 2020: D+31.6 2016: D+26.2 2012: D+15.4 2008: D+15.3
Not yet ingested
- Civics
- —
Market trends
- HPI YoY
- ▲ 1.07%
- Current HPI
- 177.2281
- Rent YoY
- —
- Metro
- —
- State GDP YoY
- ▲ 3.95%
- F500 in state
- 110
Industry mix (Fortune 500 HQ in TX)
| Industry | F500 HQs | Revenue |
|---|---|---|
| Energy | 16 | $1,198B |
|
||
| Technology | 5 | $198B |
|
||
| Engineering / Construction | 4 | $72B |
|
||
| Energy Services | 3 | $60B |
|
||
| Utilities | 3 | $41B |
|
||
| Healthcare | 2 | $330B |
|
||
Price history
1 event — show timeline
- 2026-06-15 Listed $119,900 NTREIS
Property tax history
+22.4%/yrLatest (2025): $4,602 · -0.4% YoY. Source: county tax records.
Cash-flow waterfall
monthlySold comps — $/sqft
last 12 mo · ≤1 miLoading sold comps…