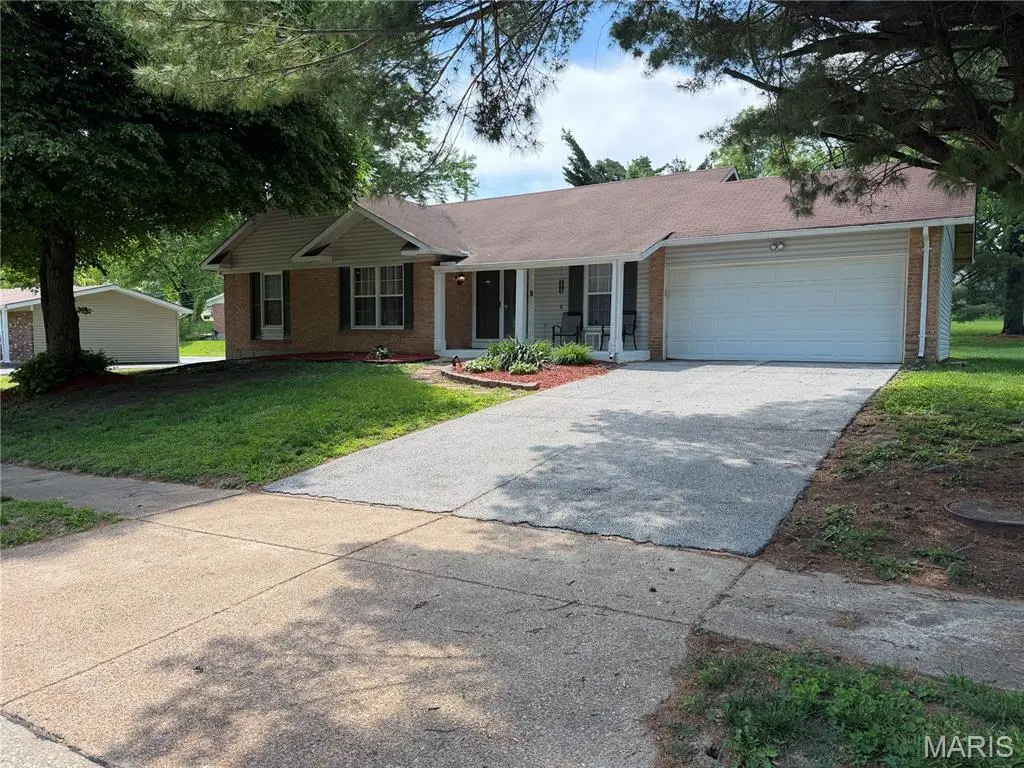
12455 Rocket Dr · Black Jack, MO
Flood risk 1/10 · Minimal
- FEMA flood zone
- X (unshaded)
- Chance of flooding over 30 yrs
- 0.0%
- Est. flood insurance / yr
- $473 – $860
Fire risk 1/10 · Minimal
- Est. fire insurance / yr
- $1,054 – $1,958
Heat risk 5/10 · Moderate
- Hot days now (above 106°F)
- 7 days/yr
- Hot days in 30 yrs
- 21 days/yr
Wind risk 2/10 · Minimal
- Chance of severe wind over 30 yrs
- 1.0%
Air-quality risk 4/10 · Minor
- Unhealthy air days now
- 4 days/yr
- Unhealthy air days in 30 yrs
- 5 days/yr
Risk factors via First Street. Map © Google.
Why this score? — see what drove the C grade
The composite is a weighted blend of 9 inputs, each scored 0–100. Each bar is that input's sub-score; the figure is the points it added to the 100-point composite (weight × sub-score).
- Cash flow +18.2/30.0
- Appreciation +10.0/10.0
- ARV discount +7.3/15.0
- DSCR +5.7/10.0
- 1% rule +4.8/10.0
- Rent growth +4.4/5.0
- Livability +3.5/5.0
- Condition / age +2.5/5.0
- Schools +1.7/10.0
$229,900
🖨 Deal sheet (PDF) 📄 Offer letter ✓ Due diligence
Listing remarks
Great Home!!! The St Louis County occupancy inspection is Completed!!! This home is ready for You to Enjoy!!! This house sets on A Large Lot, It's a Large Ranch home, with a Large Master Bedroom with sitting area, a large entry foyer, updated kitchen and bathrooms, some newer flooring and windows. Separate Living room and Dining room, Main floor family room with woodburning fireplace, main floor laundry room, with a large unfinished lower level. All the kitchen appliance to stay with the home.
Key facts
- 0.27 acre lot
- 2 garage spots
- Built 1973
Property features AI
Finance
- Other: Living area reported as 2,030 sq ft (public records)
- HOA & community: Part of Paddock Forest HOA; Annual HOA fee of $245 (covers common area maintenance and management); Association management and resident management
Exterior
- Parking: Attached garage (2 car)
- Utilities: Public water; Public sewer; Electric service (Ameren); Cable available; Natural gas connected
- Home design: Single-family residence; Attached property; One story; House structure
- Construction: Brick and vinyl siding; Basement present; Shored with poured concrete basement (8 ft+)
- Exterior features: Deck; Front porch; Private entrance; Storm doors; Adjoins open ground; Asphalt road access (county road)
Interior
- Kitchen: Cooktop; Built-in electric oven; Wall oven; Dishwasher; Disposal; Exhaust fan; Refrigerator
- Bedrooms: 4 bedrooms (all on the main level)
- Bathrooms: 2 full bathrooms (both on the main level)
- Heating & cooling: Forced air heating (natural gas); Central air conditioning; Ceiling fans
- Interior features: Eat-in kitchen; Pantry; Storage; Main-level laundry; 8 total rooms; Basement with 8 ft+ poured concrete; Fireplace in family room (masonry, wood-burning)
- Laundry & utility: Main-level laundry; Gas water heater
Neighborhood map
What this means for you Summary
Snapshot
- This is a 4-bed/2.0-bath single-family listed at $230k.
Deal economics
- At list price, monthly cash flow is $205 ($2k/yr) — positive.
- The deal already cash-flows at list — no discount required.
- To meet the 1% rule (rent ≥ 1% of price), the offer needs to be $224k (2.5% below list).
- Recommended offer: $224k (2.5% below list) — sets the bar for 1% rule.
Location & tenants
- Location reads 70/100 on livability (#132 in MO) — a middle-class / working-renter tenant base. Strengths: cost of living A+, housing A+; Watch: health & safety C-, crime D+, amenities F.
- Hazelwood (suburban): math 11% / reading 26% proficiency, ranked #306 of 324 in MO (top 94%) — low school quality limits family demand, transient renter base, plan for 1-2y turnover.
- Zoned schools: Townsend Elem. (math 8% / reading 17%, grade F, #1,007 of 1,115 statewide, top 91%, 371 students, 78% FRL); Central Middle (math 12% / reading 25%, grade F, #348 of 391 statewide, top 89%, 707 students, 68% FRL); Hazelwood Central High (math 12% / reading 33%, grade F, #455 of 521 statewide, top 88%, 1,628 students, 52% FRL).
- Market conditions: Rents rising fast (+7.5%/yr); 221 active listings in the ZIP; 5 comparable units currently listed for rent nearby; rentals at typical pace (median 23d on market — plan ~3-4 weeks tenant-placement turnaround); 920 units permitted in St. Louis County in 2024 (250 in 5+ unit buildings).
- This rent runs 40% of the median local income ($67k/yr) — at the standard rent-burdened threshold; future hikes will face affordability resistance.
Forward outlook
- In year one you build about $25k of equity ($2k loan paydown + $23k appreciation (10.0% local appreciation)).
- At projected returns (10.0% appreciation + 7.5% rent growth), your $64k cash investment doubles in ~3 years — after that, you're playing with house money.
- By year 2, paydown + projected appreciation supports a ~$40k cash-out refi (75% LTV) — recoverable capital for the next deal without selling this one.
Negotiation context
- Only 4 days on market — expect competitive offers; lowballing is unlikely to land.
- Current owner paid $165k; 39% above their basis — modest negotiation headroom, anchor on the comps not their cost.
Risks & watch-outs
- Climate carrying-cost: extreme-heat days projected 7→21/yr by 2055 (HVAC capex compounding) — expect insurance premiums to compound above CPI over the hold.
Questions for the listing agent
- Built in 1973 — when were the roof, HVAC, electrical panel, plumbing, and water heater last replaced?
- What does the HOA fee cover, when was the last increase, and are there any pending special assessments or reserve-fund shortfalls?
- Is there a deadline driving the sale (1031 exchange, divorce, estate, relocation)? That informs how much negotiation room exists.
- Crime grade is D in this area — have there been break-ins, vandalism, or insurance claims at this property in the last 3 years? What carrier currently insures it and at what premium?
- What's the average days-on-market for RENTAL listings here right now (not sales)? A rising rental-DOM trend means longer vacancies and softer asking-rent achievability than the comps imply.
- What's the recent tenant-quality profile in this submarket — average credit score on applications, eviction rate, late-payment / NSF rate, and stable-employment percentage? A property-management company in the area should have these aggregated.
- How much new for-sale + rental construction is in the pipeline within 1–3 miles? Heavy new supply typically softens prices + rents 12–24 months out; constrained supply supports both.
Investment metrics
- 1% rule
- 0.98% ✗
- Cap rate
- 7.36%
- Cash-on-cash
- 3.82%
- DSCR
- 1.17
- GRM
- 8.5
CMA / ARV
- ARV (median comp)
- $228,663
- List price
- $229,900
- Delta
- 0.54%
- Verdict
- FAIR
- Comps
- 20 within 1.0 mi
Show comp detail 12 sales within ~0.75 mi
| Address | Dist | Beds/Ba | Sqft | Sold | Price | $/sf | Match |
|---|---|---|---|---|---|---|---|
| 12455 Rocket Dr | 0.00mi | 4/2.0 | 2,030 (0%) | 1mo | $229,900 | $113 | 99 |
| 6271 Sandycreek Ct | 0.11mi | 4/3.0 | 2,062 (+2%) | 4mo | $225,000 | $109 | 85 |
| 6268 Lake Paddock Dr | 0.27mi | 3/2.5 (-1) | 1,923 (-5%) | 1mo | $159,900 | $83 | 70 |
| 5348 Trailoaks Dr | 0.58mi | 4/3.0 | 1,925 (-5%) | 3mo | $214,000 | $111 | 58 |
| 5325 Springtrail Dr | 0.50mi | 4/3.0 | 1,831 (-10%) | 2mo | $250,000 | $137 | 55 |
| 6945 Lakeside Hills Dr | 0.71mi | 3/3.0 (-1) | 1,960 (-3%) | 1mo | $240,000 | $122 | 51 |
| 6805 Trois Ct | 0.55mi | 3/1.5 (-1) | 1,813 (-11%) | 2mo | $199,000 | $110 | 48 |
| 12050 Maidstone Ct | 0.65mi | 4/2.5 | 1,794 (-12%) | 2mo | $200,000 | $111 | 47 |
| 12796 Merribrook Dr | 0.54mi | 3/3.0 (-1) | 1,818 (-10%) | 2mo | $215,000 | $118 | 46 |
| 12974 Partridge Run Dr | 0.70mi | 3/2.0 (-1) | 2,203 (+8%) | 4mo | $299,900 | $136 | 45 |
| 5227 Suntrail Dr | 0.57mi | 3/2.0 (-1) | 1,728 (-15%) | 2mo | $200,000 | $116 | 42 |
| 5172 Trailbend Dr | 0.69mi | 3/3.0 (-1) | 1,855 (-9%) | 4mo | $170,000 | $92 | 41 |
Match score weights: distance 35% · size 25% · config 20% · recency 20%. Top-matched comps best support the ARV.
Projected returns pro-forma
10.0% appreciation · 7.51% rent growth · sell at horizon
- IRR
- 28.8%
- Equity multiple
- 3.31×
- Total profit
- $148,922
- Equity at exit
- $207,112
- IRR
- 26.4%
- Equity multiple
- 8.06×
- Total profit
- $454,166
- Equity at exit
- $446,645
Cash invested: $64,372 (down + closing). Projections, not guarantees.
Landlord ↔ Tenant lean methodology
- Overall (STATE)
- 81 Strongly Landlord-Friendly
- State Missouri
- 81 Strongly Landlord-Friendly · R+10
- County
- — inherits STATE
- City
- — inherits STATE
ZIP-level market 63033
- Home prices YoY
- 2.5%
- Rents YoY
- 7.5%
- Active inventory
- 221
- Price-to-rent
- 8.5×
Monthly cashflow live
- Estimated rent
- $2,242 high interval (Pro) →
- Mortgage (P&I)
- −$1,206
- Tax from tax record
- −$244 /mo · $2,933/yr
- Insurance
- −$96
- HOA
- −$20
- Vacancy / Maint / Mgmt
- −$471
- Net cashflow
- $205
Break-even live
Sensitivity live
| Price | -10% $335 | -5% $270 | +0% $205 | +5% $140 | +10% $75 |
|---|---|---|---|---|---|
| Rent | -10% $28 | -5% $116 | +0% $205 | +5% $294 | +10% $382 |
| Rate | -1.0pp $321 | -0.5pp $264 | base $205 | +0.5pp $145 | +1.0pp $85 |
UW: 25.0% down · 7.5% · 30yr · 1.5% tax · 5.0% vac · 8.0% maint · 8.0% mgmt
Financing live
Cash to close
- Down payment
- $57,475
- Closing costs
- $6,897
- Reserves months
- —
- Total cash needed
- —
Loan-product check · same deal, 3 products live
Conventional
25% down · 7.5% · 30yr
- Down + closing
- —
- Monthly P&I
- —
- Monthly cashflow
- —
- DSCR
- —
- Eligible?
- —
Personal DTI + credit; lowest rate.
DSCR
20% down · 8.5% · 30yr
- Down + closing
- —
- Monthly P&I
- —
- Monthly cashflow
- —
- DSCR
- —
- Eligible?
- —
No personal income docs; deal must DSCR.
Hard money
10% down · 12.0% · 12mo
- Down + closing
- —
- Monthly P&I
- —
- Monthly cashflow
- —
- DSCR
- —
- Eligible?
- —
Short-term bridge; refi at stabilization.
Rent comps 5 comps
| Address | Beds | Baths | Sqft | Rent | $/sqft | DOM | Units | Dist |
|---|---|---|---|---|---|---|---|---|
| 5320 Springtrail Dr Black Jack, MO | 4.0 | 2.5 | 1712 | $2,390 | $1.40 | 23d | 1 | 0.52mi |
| 5364 Trailview Dr Black Jack, MO | 4.0 | 3.0 | 1992 | $2,330 | $1.17 | 23d | 1 | 0.58mi |
| 12303 Benham Rd Saint Louis, MO | 4.0 | 2.0 | 1845 | $1,721 | $0.93 | 0d | 1 | 0.81mi |
| 12810 Verwood Dr Florissant, MO | 3.0 | 2.0 | 1408 | $2,026 | $1.44 | 45d | 1 | 0.81mi |
| 1911 Redman Rd Saint Louis, MO | 3.0 | 1.0 | 1454 | $1,495 | $1.03 | 3d | 1 | 1.25mi |
HOA detail
- Monthly dues
- $20 · $240/yr
Listing history 4 events
-
2026-05-04status Pending 498-char remark
-
2026-05-01$229,900 Active 498-char remark
-
2026-04-28historical $229,900 498-char remark
-
2007-01-05soldstatus $165,000
ⓘ Source: listings_history table (triggers on properties + properties_extension) + one-shot
backfill from property_details.listing_events for pre-trigger history.
Tax reassessment forecast MO · Resets to sale price
- Current annual tax
- $2,933 · $244/mo
- Projected year-2 tax
- $2,933 · $244/mo
- Expected delta
- $0/yr ($0/mo · 0.0%)
ⓘ Screening estimate from a state-policy table — verify with the county assessor before closing.
Climate risk First Street
- Flood 1/10 Low FEMA zone X (unshaded) · 0% chance over 30 yrs
- Wildfire 1/10 Low
- Heat 5/10 Major 7 d/yr ≥106°F today · 21 d/yr by 30 yrs out
- Wind 2/10 Low 100% chance of damaging wind over 30 yrs
- Air quality 4/10 Moderate 4 unhealthy d/yr today · 5 by 30 yrs out
Nearby sold comps map
Loading sold comps map…
Walkable amenities ~0.75 mi
Loading nearby amenities…
Taxation est. · year 1
- Rental income
- $26,899
- − Mortgage interest
- −$12,878
- − Property taxes
- −$2,933
- − Insurance
- −$1,150
- − Repairs & maintenance
- −$2,152
- − Management
- −$2,152
- − HOA
- −$240
- − Depreciation
- −$6,688
- Taxable loss
- −$1,293
- Est. tax savings @ 24.0%
- +$310
- After-tax cash flow
- $2,771/yr
For passive investors: Depreciation is non-cash, so a rental often shows a tax loss while cash-flowing — sheltering income. Rental losses are passive: they offset passive income freely, and up to $25,000/yr can offset ordinary (W-2) income if you actively participate and your MAGI is under $100k (phasing out to $0 by $150k); unused losses carry forward. On sale, claimed depreciation is recaptured at up to 25%, and gains may owe capital-gains tax (a 1031 exchange can defer both). Figures are a year-1 estimate at your 24.0% rate — not tax advice; consult a CPA.
Schools (NCES district)
- District
- Hazelwood
- NCES district ID
- 2913830
- Math proficiency
- 11% ▼ -13.00%
- Reading proficiency
- 26% ▼ -6.00%
- Median HH income
- $51,621
- Composite
- 16.77/100
- National rank
- #9156
- State rank
- #306 of 324 in MO
Livability — Black Jack
- Score
- 70/100
- State rank
- #132
- US rank
- #7706
Category grades
Schools grade is shown separately in the Schools card above.
Census & demographics
- County
- Saint Louis County · 888,823 people
- City population
- 69,104
- Metro
- St. Louis, MO-IL
- Population (ZIP)
- 43,056
- Household income
- $66,776
- Rent vs Own
- Severe rent burden
- 1429.0
Population outlook (St. Louis County) Hauer SSP2
- Today (2025)
- 1,025,227 people
- By 2030
- 1,028,023 · +0.3%
- By 2040
- 1,020,940 · -0.4%
- By 2050
- 1,007,280 · -1.8%
- By 2075
- 987,277 · -3.7%
- By 2100
- 921,984 · -10.1%
Race, ethnicity, and origin ACS 2023
- Neighborhood character
- Predominantly Black (71%)
- Race & ethnicity
- Black 71% White 23% Two or more races 4% Hispanic / Latino 1%
- Common ancestry
- Romanian 1% Lithuanian 1% Italian 1%
- Foreign-born
- 3% · Canada, Vietnam
- Languages at home
- 95% English-only · Spanish 1% French/Haitian/Cajun 1%
Political lean MEDSL · St. Louis
- 2024 margin
- Strong D (+23.4) · D 60.8% · R 37.4% · Other 1.7%
- 2008→2024 swing
- +3.5pp toward D · 2008: 19.9pp · 2024: 23.4pp
- All cycles
- 2024: D+23.4 2020: D+24.0 2016: D+16.2 2012: D+13.7 2008: D+19.9
Not yet ingested
- Civics
- —
Market trends
- HPI YoY
- ▲ 13.78%
- Current HPI
- 570.6
- Rent YoY
- ▲ 7.51%
- Metro
- St. Louis, MO-IL
- State GDP YoY
- ▲ 1.84%
- F500 in state
- 20
Industry mix (Fortune 500 HQ in MO)
| Industry | F500 HQs | Revenue |
|---|---|---|
| Healthcare | 1 | $163B |
|
||
| Insurance | 1 | $21B |
|
||
| Industrial Technology | 1 | $17B |
|
||
| Retail | 1 | $16B |
|
||
| Industrial Distribution | 1 | $10B |
|
||
| Utilities | 1 | $9B |
|
||
Price history
+39.3% since first listed5 events — show timeline
- 2026-05-28 Sold (MLS) — MARIS as Distributed by MLS Grid
- 2026-05-04 Pending — MARIS as Distributed by MLS Grid
- 2026-05-01 Listed $229,900 MARIS as Distributed by MLS Grid
- 2026-04-28 Coming Soon $229,900 MARIS as Distributed by MLS Grid
- 2007-01-05 Sold (Public Records) $165,000 Public Records
Property tax history
+2.4%/yrLatest (2022): $2,933 · +5.6% YoY. Source: county tax records.
Cash-flow waterfall
monthlySold comps — $/sqft
last 12 mo · ≤1 miLoading sold comps…