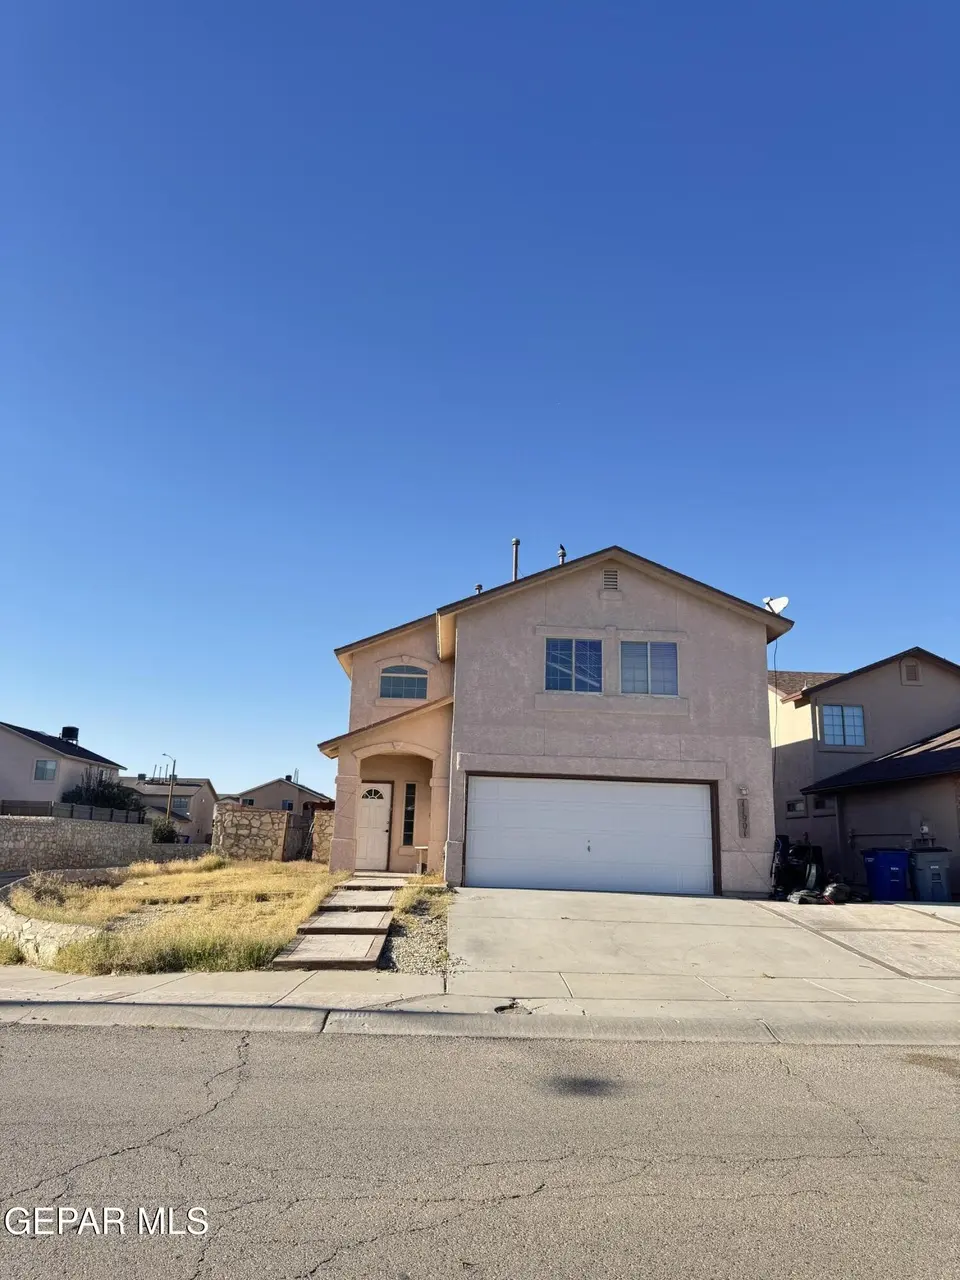
11901 Mesquite Rock Dr · El Paso, TX
Flood risk 1/10 · Minimal
- FEMA flood zone
- X
- Chance of flooding over 30 yrs
- 0.0%
- Est. flood insurance / yr
- $507 – $1,088
Fire risk 4/10 · Minor
- Est. fire insurance / yr
- $1,222 – $2,270
Heat risk 6/10 · Moderate
- Hot days now (above 100°F)
- 5 days/yr
- Hot days in 30 yrs
- 15 days/yr
Wind risk 1/10 · Minimal
- Chance of severe wind over 30 yrs
- —
Air-quality risk 3/10 · Minor
- Unhealthy air days now
- 2 days/yr
- Unhealthy air days in 30 yrs
- 2 days/yr
Risk factors via First Street. Map © Google.
Why this score? — see what drove the D+ grade
The composite is a weighted blend of 9 inputs, each scored 0–100. Each bar is that input's sub-score; the figure is the points it added to the 100-point composite (weight × sub-score).
- ARV discount +15.0/15.0
- Cash flow +12.3/30.0
- 1% rule +6.1/10.0
- Livability +4.0/5.0
- DSCR +3.7/10.0
- Rent growth +2.8/5.0
- Schools +2.6/10.0
- Condition / age +2.5/5.0
- Appreciation +0.0/10.0
$180,000
🖨 Deal sheet (PDF) 📄 Offer letter ✓ Due diligence
Listing remarks MLS
Investor special or perfect opportunity for a buyer ready to add their personal touch! This home is located in a desirable neighborhood and offers great potential to bring it back to life. With some TLC, including completing the kitchen, installing a water heater, refreshing the interior paint, and updating the carpet, this property can truly shine. Priced at a discount to reflect its current condition, this is a great chance to add value and make it your own. Buyer must assume the solar panel/water softener loan
Key facts
- 5,374 sq ft lot
- 2 garage spots
- Built 2007
Neighborhood map
What this means for you Summary
Snapshot
- This is a 3-bed/2.5-bath single-family listed at $180k.
Deal economics
- At list price, monthly cash flow is $-32 ($-381/yr) — negative.
- To cash-flow at today's rent, offer at most $174k (3.1% below list).
- Meets the 1% rule at list price ($2k rent vs $180k).
- Recommended offer: $158k (12.0% below list) — sets the bar for market timing.
Location & tenants
- Location reads 81/100 on livability (#23 in TX, #1,375 nationally) — a professional / high-income tenant draw. Strengths: commute A+, cost of living A+, housing A+; Watch: employment D+.
- Ysleta ISD (urban): math 27% / reading 35% proficiency, ranked #626 of 826 in TX (top 76%) — families likely to look elsewhere, expect single-tenant / working-renter base with shorter leases; 68% free/reduced lunch — lower-income household profile, screen leases tightly.
- Zoned schools: Desertaire El (math 29% / reading 34%, grade F, #2,396 of 4,322 statewide, top 56%, 589 students, 82% FRL); Parkland Pre-Engineering Middle (math 17% / reading 29%, grade F, #1,327 of 1,662 statewide, top 81%, 1,166 students, 83% FRL); Parkland H S (math 29% / reading 42%, grade F, #941 of 1,632 statewide, top 58%, 1,674 students, 71% FRL).
- Market conditions: Rents rising (+1.4%/yr); 296 active listings in the ZIP; 16 comparable units currently listed for rent nearby; rentals at typical pace (median 21d on market — plan ~3-4 weeks tenant-placement turnaround); solid renter incomes; 2,196 units permitted in El Paso County in 2024 (143 in 5+ unit buildings).
- This rent runs 31% of the median local income ($78k/yr) — at the standard rent-burdened threshold; future hikes will face affordability resistance.
Forward outlook
- Local home prices are declining (-3.0%/yr); year-one equity from $1k of loan paydown is wiped out by about $5k of value loss. Plan a longer hold.
- El Paso County population projected at +10% by 2050 — modest demand growth; plan on rents tracking national, not racing it.
Negotiation context
- It's been on market 153 days — a 12% lower offer ($158k) is reasonable based on typical stale-listing flexibility.
- 3 sale attempts since 19y ago; this cycle's ask has dropped $10k (5%) from the opening price — seller is motivated, your offer sets the floor, not the list.
Risks & watch-outs
- Watch-outs: property tax is 4.0% of price.
- Climate carrying-cost: extreme-heat days projected 5→15/yr by 2055 (HVAC capex compounding) — expect insurance premiums to compound above CPI over the hold.
Questions for the listing agent
- What do current leases actually rent for vs. the listed asking? Can we see a recent rent roll and the last 12 months of T-12 income?
- It's been on market 153 days. Have you received any prior offers? Is the seller open to a 12% concession, seller financing, or rate buy-down credit?
- Property tax is high relative to price — has the assessment been appealed recently, and will the sale trigger a re-assessment?
- Why hasn't it sold? Are there any deal-killer items the seller is aware of (foundation, flood, title, zoning, code violations)?
- Is there a deadline driving the sale (1031 exchange, divorce, estate, relocation)? That informs how much negotiation room exists.
- Schools are B-rated — typically a magnet for longer-tenancy family renters. What's the average tenant stay here, and is there a school-zone premium baked into asking?
- The area grade is low — what's the realistic commute time and amenity access for the typical tenant pool here? Any planned neighborhood developments (good or bad) we should know about?
- What's the average days-on-market for RENTAL listings here right now (not sales)? A rising rental-DOM trend means longer vacancies and softer asking-rent achievability than the comps imply.
- What's the recent tenant-quality profile in this submarket — average credit score on applications, eviction rate, late-payment / NSF rate, and stable-employment percentage? A property-management company in the area should have these aggregated.
- How much new for-sale + rental construction is in the pipeline within 1–3 miles? Heavy new supply typically softens prices + rents 12–24 months out; constrained supply supports both.
Investment metrics
- 1% rule
- 1.11% ✓
- Cap rate
- 6.08%
- Cash-on-cash
- -0.76%
- DSCR
- 0.97
- GRM
- 7.5
CMA / ARV
- ARV (median comp)
- $272,219
- List price
- $180,000
- Delta
- -33.88%
- Verdict
- UNDERPRICED
- Comps
- 1 within 2.0 mi
Projected returns pro-forma
-3.0% appreciation · 1.36% rent growth · sell at horizon
- IRR
- -19.8%
- Equity multiple
- 0.32×
- Total profit
- $-34,189
- Equity at exit
- $26,839
- IRR
- -17.6%
- Equity multiple
- 0.12×
- Total profit
- $-44,252
- Equity at exit
- $15,563
Cash invested: $50,400 (down + closing). Projections, not guarantees.
Landlord ↔ Tenant lean methodology
- Overall (STATE)
- 87 Strongly Landlord-Friendly
- State Texas
- 87 Strongly Landlord-Friendly · R+5
- County
- — inherits STATE
- City
- — inherits STATE
ZIP-level market 79934
- Home prices YoY
- -13.1%
- Rents YoY
- 1.4%
- Active inventory
- 296
- Price-to-rent
- 7.5×
Monthly cashflow live
- Estimated rent
- $2,005 high interval (Pro) →
- Mortgage (P&I)
- −$944
- Tax from tax record
- −$597 /mo · $7,162/yr
- Insurance
- −$75
- HOA
- −$0
- Vacancy / Maint / Mgmt
- −$421
- Net cashflow
- $-32
Break-even live
Sensitivity live
| Price | -10% $70 | -5% $19 | +0% $-32 | +5% $-83 | +10% $-134 |
|---|---|---|---|---|---|
| Rent | -10% $-190 | -5% $-111 | +0% $-32 | +5% $47 | +10% $127 |
| Rate | -1.0pp $59 | -0.5pp $14 | base $-32 | +0.5pp $-78 | +1.0pp $-126 |
UW: 25.0% down · 7.5% · 30yr · 1.5% tax · 5.0% vac · 8.0% maint · 8.0% mgmt
Financing live
Cash to close
- Down payment
- $45,000
- Closing costs
- $5,400
- Reserves months
- —
- Total cash needed
- —
Loan-product check · same deal, 3 products live
Conventional
25% down · 7.5% · 30yr
- Down + closing
- —
- Monthly P&I
- —
- Monthly cashflow
- —
- DSCR
- —
- Eligible?
- —
Personal DTI + credit; lowest rate.
DSCR
20% down · 8.5% · 30yr
- Down + closing
- —
- Monthly P&I
- —
- Monthly cashflow
- —
- DSCR
- —
- Eligible?
- —
No personal income docs; deal must DSCR.
Hard money
10% down · 12.0% · 12mo
- Down + closing
- —
- Monthly P&I
- —
- Monthly cashflow
- —
- DSCR
- —
- Eligible?
- —
Short-term bridge; refi at stabilization.
Rent comps 16 comps
| Address | Beds | Baths | Sqft | Rent | $/sqft | DOM | Units | Dist |
|---|---|---|---|---|---|---|---|---|
| 11961 Mesquite Miel Dr El Paso, TX | 4.0 | 2.5 | 2328 | $1,950 | $0.84 | 4d | 1 | 0.12mi |
| 7133 Mesquite Tree Ln El Paso, TX | 3.0 | 2.0 | 1886 | $1,895 | $1.00 | 4d | 1 | 0.26mi |
| 12037 Copper Mine Ln El Paso, TX | 3.0 | 2.0 | 1330 | $1,850 | $1.39 | 25d | 1 | 0.40mi |
| 7041 Falling Leaf Cir El Paso, TX | 4.0 | 2.5 | 1975 | $1,950 | $0.99 | 16d | 1 | 0.40mi |
| 7041 Falling Leaf Cir El Paso, TX | 4.0 | 2.5 | 1974 | $1,950 | $0.99 | 13d | 1 | 0.40mi |
| 7321 Brick Dust St El Paso, TX | 4.0 | 2.5 | 1462 | $1,650 | $1.13 | 45d | 1 | 0.54mi |
| 12148 Cherry Wood Ln El Paso, TX | 3.0 | 2.0 | 1267 | $1,750 | $1.38 | 12d | 1 | 0.61mi |
| 7244 Long Meadow Dr El Paso, TX | 3.0 | 2.0 | 1441 | $1,550 | $1.08 | 21d | 1 | 0.66mi |
| 6952 Black Mesquite Dr El Paso, TX | 3.0 | 2.5 | 1732 | $1,900 | $1.10 | 23d | 1 | 0.73mi |
| 12185 Copper Valley Ln El Paso, TX | 4.0 | 2.5 | 2024 | $2,250 | $1.11 | 4d | 1 | 0.79mi |
| 12185 Copper Valley Ln El Paso, TX | 4.0 | 2.5 | 2024 | $2,250 | $1.11 | 25d | 1 | 0.79mi |
| 12329 Jack Vowell Way El Paso, TX | 4.0 | 2.0 | 1708 | $2,200 | $1.29 | 4d | 1 | 1.07mi |
| 12316 Anson Mills Way El Paso, TX | 3.0 | 2.0 | 1465 | $2,200 | $1.50 | 45d | 1 | 1.13mi |
| 7480 Rio Rimac Dr El Paso, TX | 4.0 | 2.0 | 1455 | $2,000 | $1.37 | 45d | 1 | 1.31mi |
| 12433 Polo Norte Dr El Paso, TX | 3.0 | 2.0 | 1585 | $1,950 | $1.23 | 21d | 1 | 1.36mi |
| 12433 Polo Norte Dr El Paso, TX | 3.0 | 2.0 | 1583 | $1,950 | $1.23 | 45d | 1 | 1.36mi |
Listing history 23 events
-
2026-06-22days on market $180,000 Active 153 DOM
-
2026-06-18days on market $180,000 Active 150 DOM
-
2026-06-17days on market $180,000 Active 149 DOM
-
2026-06-16days on market $180,000 Active 148 DOM
-
2026-06-15days on market $180,000 Active 147 DOM
-
2026-06-13days on market $180,000 Active 145 DOM
-
2026-06-10days on market $180,000 Active 142 DOM
-
2026-06-09days on market $180,000 Active 141 DOM
-
2026-06-08days on market $180,000 Active 140 DOM
-
2026-06-07days on market $180,000 Active 139 DOM
-
2026-06-05days on market $180,000 Active 136 DOM
-
2026-06-03days on market $180,000 Active 135 DOM
-
2026-06-03days on market $180,000 Active 134 DOM
-
2026-06-01days on market $180,000 Active 133 DOM
-
2026-05-31days on market $180,000 Active 132 DOM
-
2026-02-18price $180,000 518-char remark
Show marketing remark (518 chars)
Investor special or perfect opportunity for a buyer ready to add their personal touch! This home is located in a desirable neighborhood and offers great potential to bring it back to life. With some TLC, including completing the kitchen, installing a water heater, refreshing the interior paint, and updating the carpet, this property can truly shine. Priced at a discount to reflect its current condition, this is a great chance to add value and make it your own. Buyer must assume the solar panel/water softener loan
-
2026-01-19$190,000 Active 518-char remark
Show marketing remark (518 chars)
Investor special or perfect opportunity for a buyer ready to add their personal touch! This home is located in a desirable neighborhood and offers great potential to bring it back to life. With some TLC, including completing the kitchen, installing a water heater, refreshing the interior paint, and updating the carpet, this property can truly shine. Priced at a discount to reflect its current condition, this is a great chance to add value and make it your own. Buyer must assume the solar panel/water softener loan
-
2020-09-10soldstatus $159,984
-
2020-09-10soldstatus $159,984
-
2020-08-03status Pending
-
2020-07-17$149,900 Active
-
2007-10-31historical
-
2007-08-24$118,950
ⓘ Source: listings_history table (triggers on properties + properties_extension) + one-shot
backfill from property_details.listing_events for pre-trigger history.
Tax reassessment forecast TX · Resets to sale price
- Current annual tax
- $7,162 · $597/mo
- Projected year-2 tax
- $7,162 · $597/mo
- Expected delta
- $0/yr ($0/mo · 0.0%)
ⓘ Screening estimate from a state-policy table — verify with the county assessor before closing.
Climate risk First Street
- Flood 1/10 Low FEMA zone X · 0% chance over 30 yrs
- Wildfire 4/10 Moderate
- Heat 6/10 Major 5 d/yr ≥100°F today · 15 d/yr by 30 yrs out
- Wind 1/10 Low
- Air quality 3/10 Moderate 2 unhealthy d/yr today · 2 by 30 yrs out
Nearby sold comps map
Loading sold comps map…
Walkable amenities ~0.75 mi
Loading nearby amenities…
Taxation est. · year 1
- Rental income
- $24,060
- − Mortgage interest
- −$10,083
- − Property taxes
- −$7,162
- − Insurance
- −$900
- − Repairs & maintenance
- −$1,925
- − Management
- −$1,925
- − Depreciation
- −$5,236
- Taxable loss
- −$3,170
- Est. tax savings @ 24.0%
- +$761
- After-tax cash flow
- $379/yr
For passive investors: Depreciation is non-cash, so a rental often shows a tax loss while cash-flowing — sheltering income. Rental losses are passive: they offset passive income freely, and up to $25,000/yr can offset ordinary (W-2) income if you actively participate and your MAGI is under $100k (phasing out to $0 by $150k); unused losses carry forward. On sale, claimed depreciation is recaptured at up to 25%, and gains may owe capital-gains tax (a 1031 exchange can defer both). Figures are a year-1 estimate at your 24.0% rate — not tax advice; consult a CPA.
Schools (NCES district)
- District
- Ysleta ISD
- NCES district ID
- 4846680
- Math proficiency
- 27% ▼ -31.00%
- Reading proficiency
- 35% ▼ -11.00%
- Median HH income
- $35,826
- Composite
- 25.65/100
- National rank
- #7400
- State rank
- #626 of 826 in TX
Livability — El Paso
- Score
- 81/100
- State rank
- #23
- US rank
- #1375
Category grades
Schools grade is shown separately in the Schools card above.
Census & demographics
- Census place
- El Paso, TX
- County
- El Paso County · 761,266 people
- City population
- 630,223
- Metro
- El Paso, TX
- Population (ZIP)
- 28,861
- Household income
- $77,754
- Rent vs Own
- Severe rent burden
- 795.0
Population outlook (El Paso County) Hauer SSP2
- Today (2025)
- 897,899 people
- By 2030
- 922,694 · +2.8%
- By 2040
- 960,492 · +7.0%
- By 2050
- 982,919 · +9.5%
- By 2075
- 997,266 · +11.1%
- By 2100
- 900,630 · +0.3%
Race, ethnicity, and origin ACS 2023
- Neighborhood character
- Diverse neighborhood (Simpson 0.56)
- Race & ethnicity
- Hispanic / Latino 63% Two or more races 34% White 19% Black 9% Asian 3%
- Hispanic origin (detail)
- Mexican 57% Puerto Rican 3%
- Common ancestry
- Lithuanian 1% Italian 1% Romanian 1%
- Foreign-born
- 15% · Canada, South Korea, Vietnam
- Languages at home
- 54% English-only · Spanish 42% Korean 1% French/Haitian/Cajun 1%
Political lean MEDSL · El Paso
- 2024 margin
- D (+15.1) · D 57.0% · R 41.8% · Other 1.2%
- 2008→2024 swing
- -17.4pp toward R · 2008: 32.5pp · 2024: 15.1pp
- All cycles
- 2024: D+15.1 2020: D+35.1 2016: D+43.2 2012: D+32.6 2008: D+32.5
Not yet ingested
- Civics
- —
Market trends
- HPI YoY
- ▼ -34.63%
- Current HPI
- 229.688
- Rent YoY
- ▲ 1.36%
- Metro
- El Paso, TX
- State GDP YoY
- ▲ 3.95%
- F500 in state
- 110
Industry mix (Fortune 500 HQ in TX)
| Industry | F500 HQs | Revenue |
|---|---|---|
| Energy | 16 | $1,198B |
|
||
| Technology | 5 | $198B |
|
||
| Engineering / Construction | 4 | $72B |
|
||
| Energy Services | 3 | $60B |
|
||
| Utilities | 3 | $41B |
|
||
| Healthcare | 2 | $330B |
|
||
Price history
+51.3% since first listed8 events — show timeline
- 2026-02-18 Price Changed $180,000 GEPARMLS
- 2026-01-19 Listed $190,000 GEPARMLS
- 2020-09-10 Sold (Public Records) $159,984 Public Records
- 2020-09-10 Sold (Public Records) $159,984 Public Records
- 2020-08-03 Pending — GEPARMLS
- 2020-07-17 Listed $149,900 GEPARMLS
- 2007-10-31 Listing Removed — GEPARMLS
- 2007-08-24 Listed $118,950 GEPARMLS
Property tax history
+6.7%/yrLatest (2025): $7,162 · +8.7% YoY. Source: county tax records.
Cash-flow waterfall
monthlySold comps — $/sqft
last 12 mo · ≤1 miLoading sold comps…