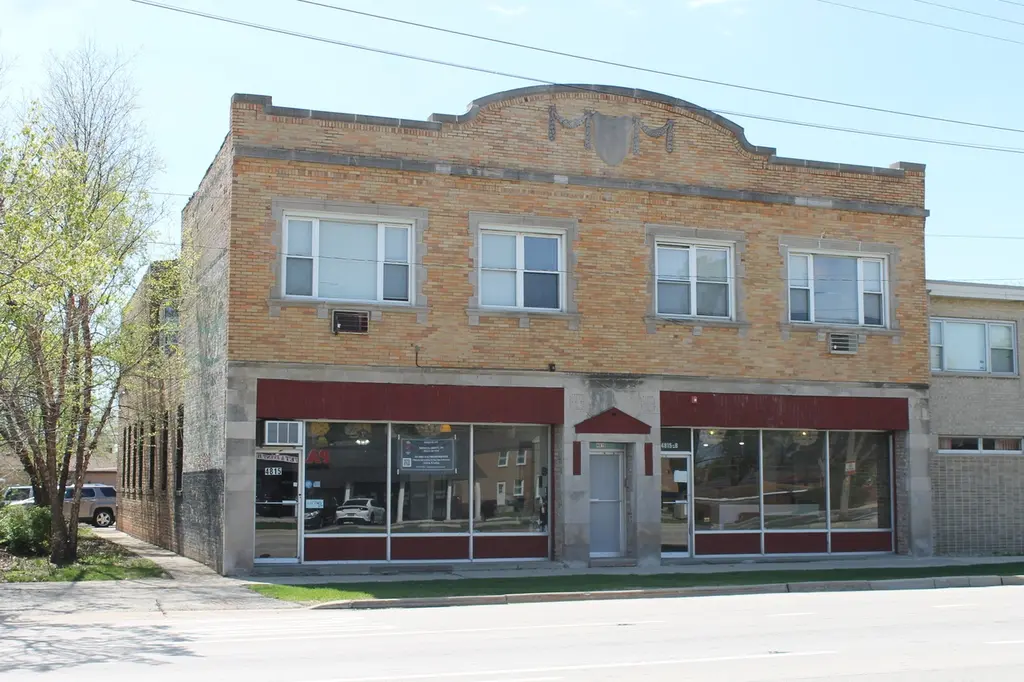
4815 Butterfield Rd · Hillside, IL
Flood risk 1/10 · Minimal
- FEMA flood zone
- X (unshaded)
- Chance of flooding over 30 yrs
- 0.0%
- Est. flood insurance / yr
- $473 – $860
Fire risk 1/10 · Minimal
- Est. fire insurance / yr
- $804 – $1,492
Heat risk 2/10 · Minimal
- Hot days now (above 101°F)
- 7 days/yr
- Hot days in 30 yrs
- 13 days/yr
Wind risk 2/10 · Minimal
- Chance of severe wind over 30 yrs
- —
Air-quality risk 4/10 · Minor
- Unhealthy air days now
- 6 days/yr
- Unhealthy air days in 30 yrs
- 7 days/yr
Risk factors via First Street. Map © Google.
Why this score? — see what drove the F grade
The composite is a weighted blend of 9 inputs, each scored 0–100. Each bar is that input's sub-score; the figure is the points it added to the 100-point composite (weight × sub-score).
- ARV discount +7.5/15.0
- Livability +3.7/5.0
- Rent growth +2.5/5.0
- Condition / age +2.5/5.0
- Schools +1.4/10.0
- Cash flow +0.0/30.0
- 1% rule +0.0/10.0
- DSCR +0.0/10.0
- Appreciation +0.0/10.0
$675,000
🖨 Deal sheet 📄 Offer letter ✓ Due diligence
Listing remarks
This all brick mixed used building is perfect for an investor or an owner user. The first floor salon business and can either stay in place as a tenant or vacate for an owner user. The first floor can easily be divided into two separate units with separately metered gas and electric. It features high ceilings with exposed joists, vinyl flooring, exposed brick, a laundry room, break room, locker room and several storage rooms. There are four apartments upstairs - two one bedroom, one bath units in the front and two, two bedroom one bath units in the rear. Each apartment is separately metered for gas and electric and each has its own furnace and water heater. There is a full basement that is
Key facts
- Mixed used building
- Exposed joists
- High ceilings
Tags
Property features AI
Finance
- Other: 6-unit building
- Financial info: Gross income reported as $101,400; Total monthly income reported as $8,450; Gross rent multiplier 6.89; Reported annual tax amount $30,888; Reported operating expenses include: water/sewer $2,634; electric $772; trash $2,449; insurance $3,600
Exterior
- Parking: Outdoor parking (19–30 spaces); parking behind the building
- Utilities: Electric service with circuit breakers and separate meters (0–100 Amp service range); Water and sewer (expenses reported separately); Trash service (expenses reported separately)
- Home design: Mixed-use property
- Construction: Brick construction; Built before 1978
- Exterior features: Rear parking lot with 19–30 outdoor spaces; Lot dimensions approximately 63 x 186 x 65 x 167; Zoned COMMR
Interior
- Heating & cooling: Forced air (gas); Central air; Window unit(s)
- Interior features: Forced air gas heating; Central air conditioning with window units also present
Neighborhood map
What this means for you Summary
Snapshot
- This is a 6-bed/5.0-bath condo listed at $675k.
Deal economics
- At list price, monthly cash flow is $-4k ($-54k/yr) — negative.
- To cash-flow at today's rent, offer at most $262k (61.2% below list).
- To meet the 1% rule (rent ≥ 1% of price), the offer needs to be $229k (66.0% below list).
- Recommended offer: $229k (66.0% below list) — sets the bar for 1% rule.
Location & tenants
- Location reads 73/100 on livability (#269 in IL) — a middle-class / working-renter tenant base. Strengths: commute A+, housing A+, cost of living A-; Watch: health & safety D+, schools F, amenities F.
- Proviso Twp Hsd 209 (suburban): math 12% / reading 17% proficiency, ranked #507 of 620 in IL (top 82%) — low school quality limits family demand, transient renter base, plan for 1-2y turnover.
- Market conditions: 9 active listings in the ZIP; 6,272 units permitted in Cook County in 2024 (4,658 in 5+ unit buildings).
Forward outlook
- Local home prices are declining (-3.0%/yr); year-one equity from $5k of loan paydown is wiped out by about $20k of value loss. Plan a longer hold.
Negotiation context
- It's been on market 58 days — a 3% lower offer ($655k) is reasonable based on typical stale-listing flexibility.
Risks & watch-outs
- Watch-outs: property tax is 4.4% of price; built in 1927 — expect roof / HVAC / electrical / plumbing capex.
Questions for the listing agent
- What do current leases actually rent for vs. the listed asking? Can we see a recent rent roll and the last 12 months of T-12 income?
- It's been on market 58 days. Have you received any prior offers? Is the seller open to a 66% concession, seller financing, or rate buy-down credit?
- Built in 1927 — when were the roof, HVAC, electrical panel, plumbing, and water heater last replaced?
- Property tax is high relative to price — has the assessment been appealed recently, and will the sale trigger a re-assessment?
- Any open or pending special assessments — roof, HVAC, plumbing, elevator, façade? What's the per-unit balance and payoff schedule, and is the seller paying it off at close or rolling it to the buyer?
- Is there a deadline driving the sale (1031 exchange, divorce, estate, relocation)? That informs how much negotiation room exists.
- Schools are F-rated, which usually means shorter tenancies and higher turnover. Who's the typical renter profile here, and what's been the actual vacancy rate?
- The area grade is low — what's the realistic commute time and amenity access for the typical tenant pool here? Any planned neighborhood developments (good or bad) we should know about?
- What's the average days-on-market for RENTAL listings here right now (not sales)? A rising rental-DOM trend means longer vacancies and softer asking-rent achievability than the comps imply.
- What's the recent tenant-quality profile in this submarket — average credit score on applications, eviction rate, late-payment / NSF rate, and stable-employment percentage? A property-management company in the area should have these aggregated.
- How much new apartment / multifamily construction is in the pipeline within 1–3 miles? Heavy new supply (>2% of stock underway) typically softens rents 12–24 months out; light construction supports rent growth.
Investment metrics
- 1% rule
- 0.34% ✗
- Cap rate
- -1.69%
- Cash-on-cash
- -28.50%
- DSCR
- -0.27
- GRM
- 24.5
CMA / ARV
No comps found within radius.
Projected returns pro-forma
-3.0% appreciation · 3.0% rent growth · sell at horizon
- IRR
- -82.8%
- Equity multiple
- -1.09×
- Total profit
- $-394,185
- Equity at exit
- $100,645
- IRR
- —
- Equity multiple
- -2.74×
- Total profit
- $-707,102
- Equity at exit
- $58,362
Cash invested: $189,000 (down + closing). Projections, not guarantees.
Landlord ↔ Tenant lean methodology
- Overall (STATE)
- 43 Moderately Tenant-Leaning
- State Illinois
- 43 Moderately Tenant-Leaning · D+7
- County
- — inherits STATE
- City
- — inherits STATE
ZIP-level market 60162
- Home prices YoY
- -15.4%
- Active inventory
- 9
- Price-to-rent
- 24.5×
Monthly cashflow live
- Estimated rent
- $2,292 medium interval (Pro) →
- Mortgage (P&I)
- −$3,540
- Tax from tax record
- −$2,478 /mo · $29,732/yr
- Insurance
- −$281
- HOA
- −$0
- Vacancy / Maint / Mgmt
- −$481
- Net cashflow
- $-4,488
Break-even live
UW: 25.0% down · 7.5% · 30yr · 1.5% tax · 5.0% vac · 8.0% maint · 8.0% mgmt
Financing live
Cash to close
- Down payment
- $168,750
- Closing costs
- $20,250
- Reserves months
- —
- Total cash needed
- —
Loan-product check · same deal, 3 products live
Conventional
25% down · 7.5% · 30yr
- Down + closing
- —
- Monthly P&I
- —
- Monthly cashflow
- —
- DSCR
- —
- Eligible?
- —
Personal DTI + credit; lowest rate.
DSCR
20% down · 8.5% · 30yr
- Down + closing
- —
- Monthly P&I
- —
- Monthly cashflow
- —
- DSCR
- —
- Eligible?
- —
No personal income docs; deal must DSCR.
Hard money
10% down · 12.0% · 12mo
- Down + closing
- —
- Monthly P&I
- —
- Monthly cashflow
- —
- DSCR
- —
- Eligible?
- —
Short-term bridge; refi at stabilization.
HOA detail condo
- Monthly dues
- $0 · $0/yr
- Likely covers
- watergaselectric
- Assessments
- None detected in remarks — confirm with the listing agent.
Listing history 16 events
-
2026-06-18days on market $675,000 Active 58 DOM
-
2026-06-17days on market $675,000 Active 57 DOM
-
2026-06-16days on market $675,000 Active 56 DOM
-
2026-06-15days on market $675,000 Active 55 DOM
-
2026-06-13days on market $675,000 Active 53 DOM
-
2026-06-13days on market $675,000 Active 52 DOM
-
2026-06-09days on market $675,000 Active 49 DOM
-
2026-06-08days on market $675,000 Active 48 DOM
-
2026-06-07days on market $675,000 Active 47 DOM
-
2026-06-04days on market $675,000 Active 44 DOM
-
2026-06-03days on market $675,000 Active 43 DOM
-
2026-06-02days on market $675,000 Active 42 DOM
-
2026-06-02price $675,000 Active 41 DOM
-
2026-06-01days on market $699,900 Active 41 DOM
-
2026-05-31days on market $699,900 Active 40 DOM
-
2026-04-21$699,900 Active
ⓘ Source: listings_history table (triggers on properties + properties_extension) + one-shot
backfill from property_details.listing_events for pre-trigger history.
Tax reassessment forecast IL · Partial reset (capped growth)
- Current annual tax
- $29,732 · $2,478/mo
- Projected year-2 tax
- $29,732 · $2,478/mo
- Expected delta
- $0/yr ($0/mo · 0.0%)
ⓘ Screening estimate from a state-policy table — verify with the county assessor before closing.
Climate risk First Street
- Flood 1/10 Low FEMA zone X (unshaded) · 0% chance over 30 yrs
- Wildfire 1/10 Low
- Heat 2/10 Low 7 d/yr ≥101°F today · 13 d/yr by 30 yrs out
- Wind 2/10 Low
- Air quality 4/10 Moderate 6 unhealthy d/yr today · 7 by 30 yrs out
Nearby sold comps map
Loading sold comps map…
Walkable amenities ~0.75 mi
Loading nearby amenities…
Taxation est. · year 1
- Rental income
- $27,503
- − Mortgage interest
- −$37,810
- − Property taxes
- −$29,732
- − Insurance
- −$3,375
- − Repairs & maintenance
- −$2,200
- − Management
- −$2,200
- − Depreciation
- −$19,636
- Taxable loss
- −$67,451
- Est. tax savings @ 24.0%
- +$16,188
- After-tax cash flow
- $-37,668/yr
For passive investors: Depreciation is non-cash, so a rental often shows a tax loss while cash-flowing — sheltering income. Rental losses are passive: they offset passive income freely, and up to $25,000/yr can offset ordinary (W-2) income if you actively participate and your MAGI is under $100k (phasing out to $0 by $150k); unused losses carry forward. On sale, claimed depreciation is recaptured at up to 25%, and gains may owe capital-gains tax (a 1031 exchange can defer both). Figures are a year-1 estimate at your 24.0% rate — not tax advice; consult a CPA.
Schools (NCES district)
- District
- Proviso Twp Hsd 209
- NCES district ID
- 1732910
- Math proficiency
- 12% ▼ -4.00%
- Reading proficiency
- 17% ▼ -3.00%
- Median HH income
- $51,744
- Composite
- 13.5/100
- National rank
- #9518
- State rank
- #507 of 620 in IL
Livability — Hillside
- Score
- 73/100
- State rank
- #269
- US rank
- #5080
Category grades
Schools grade is shown separately in the Schools card above.
Census & demographics
- Census place
- Hillside, IL
- City population
- 8,133
- Population (ZIP)
- 8,133
Population outlook (Cook County) Hauer SSP2
- Today (2025)
- 5,347,519 people
- By 2030
- 5,357,703 · +0.2%
- By 2040
- 5,324,924 · -0.4%
- By 2050
- 5,230,762 · -2.2%
- By 2075
- 4,785,735 · -10.5%
- By 2100
- 4,188,836 · -21.7%
Race, ethnicity, and origin ACS 2023
- Neighborhood character
- Diverse neighborhood (Simpson 0.65)
- Race & ethnicity
- Black 45% Hispanic / Latino 33% White 19% Two or more races 7% Asian 1%
- Hispanic origin (detail)
- Mexican 30% Puerto Rican 1%
- Common ancestry
- Romanian 3% Slovak 1% Iranian 1%
- Foreign-born
- 24% · Canada
- Languages at home
- 58% English-only · Spanish 31% French/Haitian/Cajun 6% Russian/Polish/Slavic 2%
Political lean MEDSL · Cook
- 2024 margin
- Solid D (+42.0) · D 70.4% · R 28.4% · Other 1.2%
- 2008→2024 swing
- -11.4pp toward R · 2008: 53.4pp · 2024: 42.0pp
- All cycles
- 2024: D+42.0 2020: D+50.3 2016: D+53.0 2012: D+49.4 2008: D+53.4
Not yet ingested
- Civics
- —
Market trends
- HPI YoY
- ▼ -47.40%
- Current HPI
- 261.2543
- Rent YoY
- —
- Metro
- —
- State GDP YoY
- ▲ 1.59%
- F500 in state
- 60
Industry mix (Fortune 500 HQ in IL)
| Industry | F500 HQs | Revenue |
|---|---|---|
| Insurance | 4 | $201B |
|
||
| Consumer Goods | 4 | $87B |
|
||
| Industrial Machinery | 3 | $64B |
|
||
| Healthcare | 2 | $55B |
|
||
| Retail / Pharmacy | 1 | $148B |
|
||
| Agriculture / Food | 1 | $86B |
|
||
Price history
1 event — show timeline
- 2026-04-21 Listed $699,900 MRED as Distributed by MLS Grid
Property tax history
+4.6%/yrLatest (2023): $29,732 · +22.7% YoY. Source: county tax records.
Cash-flow waterfall
monthlySold comps — $/sqft
last 12 mo · ≤1 miLoading sold comps…