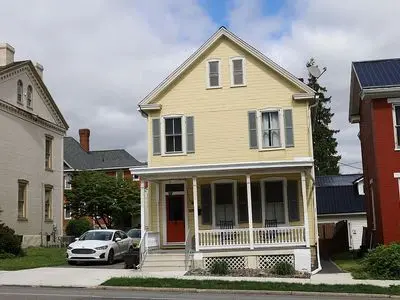
414 Penn St · Hollidaysburg, PA
Flood risk 1/10 · Minimal
- FEMA flood zone
- X (unshaded)
- Chance of flooding over 30 yrs
- 0.0%
- Est. flood insurance / yr
- $507 – $1,088
Fire risk 1/10 · Minimal
- Est. fire insurance / yr
- $511 – $949
Heat risk 4/10 · Minor
- Hot days now (above 95°F)
- 7 days/yr
- Hot days in 30 yrs
- 18 days/yr
Wind risk 2/10 · Minimal
- Chance of severe wind over 30 yrs
- —
Air-quality risk 2/10 · Minimal
- Unhealthy air days now
- 1 days/yr
- Unhealthy air days in 30 yrs
- 3 days/yr
Risk factors via First Street. Map © Google.
Why this score? — see what drove the C grade
The composite is a weighted blend of 9 inputs, each scored 0–100. Each bar is that input's sub-score; the figure is the points it added to the 100-point composite (weight × sub-score).
- Cash flow +18.4/30.0
- ARV discount +15.0/15.0
- DSCR +5.8/10.0
- 1% rule +4.9/10.0
- Schools +4.6/10.0
- Livability +4.0/5.0
- Rent growth +2.5/5.0
- Condition / age +2.5/5.0
- Appreciation +0.0/10.0
$164,900
🖨 Deal sheet (PDF) 📄 Offer letter ✓ Due diligence
Listing remarks MLS
3 BR 1.5 BA 2 story on borough lot. Eat in kitchen leads to back porch overlooking fenced yard.
Key facts
- Wood windows
- Wood siding
- Built 1870
Tags
Neighborhood map
What this means for you Summary
Snapshot
- This is a 3-bed/2.0-bath single-family listed at $165k.
Deal economics
- At list price, monthly cash flow is $154 ($2k/yr) — positive.
- The deal already cash-flows at list — no discount required.
- To meet the 1% rule (rent ≥ 1% of price), the offer needs to be $164k (0.8% below list).
- Recommended offer: $160k (3.0% below list) — sets the bar for market timing.
Location & tenants
- Location reads 81/100 on livability (#184 in PA, #1,549 nationally) — a professional / high-income tenant draw. Strengths: schools A+, crime A+, cost of living A+; Watch: amenities F, commute F.
- Hollidaysburg Area SD (suburban): math 45% / reading 63% proficiency, ranked #129 of 539 in PA (top 24%) — acceptable for families but not a draw, mixed tenant base, ~2y average lease.
- Market conditions: 86 active listings in the ZIP; 1 comparable units currently listed for rent nearby; 99 units permitted in Blair County in 2024 (0 in 5+ unit buildings).
Forward outlook
- Local home prices are declining (-3.0%/yr); year-one equity from $1k of loan paydown is wiped out by about $5k of value loss. Plan a longer hold.
- Blair County population projected at -18% by 2050 — secular population decline; favor cash flow + early exit over multi-decade hold.
Negotiation context
- It's been on market 38 days — a 3% lower offer ($160k) is reasonable based on typical stale-listing flexibility.
- 5 sale attempts since 19y ago with the ask held roughly flat each time — persistent listings suggest the price (not the market) is what's stuck; bring a comps-based counter.
- Current owner paid $120k; 37% above their basis — modest negotiation headroom, anchor on the comps not their cost.
Risks & watch-outs
- Watch-outs: built in 1870 — expect roof / HVAC / electrical / plumbing capex.
Questions for the listing agent
- It's been on market 38 days. Have you received any prior offers? Is the seller open to a 3% concession, seller financing, or rate buy-down credit?
- Built in 1870 — when were the roof, HVAC, electrical panel, plumbing, and water heater last replaced?
- Is there a deadline driving the sale (1031 exchange, divorce, estate, relocation)? That informs how much negotiation room exists.
- Schools are A-rated — typically a magnet for longer-tenancy family renters. What's the average tenant stay here, and is there a school-zone premium baked into asking?
- What's the average days-on-market for RENTAL listings here right now (not sales)? A rising rental-DOM trend means longer vacancies and softer asking-rent achievability than the comps imply.
- What's the recent tenant-quality profile in this submarket — average credit score on applications, eviction rate, late-payment / NSF rate, and stable-employment percentage? A property-management company in the area should have these aggregated.
- How much new for-sale + rental construction is in the pipeline within 1–3 miles? Heavy new supply typically softens prices + rents 12–24 months out; constrained supply supports both.
Investment metrics
- 1% rule
- 0.99% ✗
- Cap rate
- 7.41%
- Cash-on-cash
- 4.00%
- DSCR
- 1.18
- GRM
- 8.4
CMA / ARV
- ARV (on-the-fly)
- $224,485
- Comps found
- 12
Show comp detail 12 sales within ~0.75 mi
| Address | Dist | Beds/Ba | Sqft | Sold | Price | $/sf | Match |
|---|---|---|---|---|---|---|---|
| 619 Mulberry St | 0.13mi | 3/1.5 | 1,628 (+1%) | 4mo | $125,000 | $77 | 87 |
| 419 Penn St | 0.02mi | 3/2.0 | 1,740 (+8%) | 4mo | $200,000 | $115 | 82 |
| 511 Pine St | 0.19mi | 3/2.0 | 1,519 (-6%) | 5mo | $265,000 | $174 | 77 |
| 1006 Union St | 0.44mi | 3/2.0 | 1,623 (+0%) | 2mo | $320,000 | $197 | 77 |
| 1307 Spruce St | 0.43mi | 2/2.0 (-1) | 1,596 (-1%) | 10mo | $165,000 | $103 | 65 |
| 806 Jones St | 0.28mi | 2/2.0 (-1) | 1,477 (-8%) | 6mo | $212,500 | $144 | 62 |
| 439 E Fir St | 0.57mi | 4/1.5 (+1) | 1,629 (+1%) | 4mo | $269,900 | $166 | 62 |
| 423 Cedar Blvd | 0.53mi | 3/2.0 | 1,500 (-7%) | 6mo | $280,000 | $187 | 59 |
| 708 Blair St | 0.23mi | 4/1.5 (+1) | 1,792 (+11%) | 10mo | $110,000 | $61 | 56 |
| 125 Broad St | 0.52mi | 3/2.0 | 1,440 (-11%) | 6mo | $200,000 | $139 | 53 |
| 408 Cedar Blvd | 0.52mi | 3/1.5 | 1,840 (+14%) | 2mo | $230,000 | $125 | 49 |
| 314 Hart St | 0.44mi | 2/1.0 (-1) | 1,440 (-11%) | 5mo | $180,000 | $125 | 48 |
Match score weights: distance 35% · size 25% · config 20% · recency 20%. Top-matched comps best support the ARV.
Projected returns pro-forma
-3.0% appreciation · 3.0% rent growth · sell at horizon
- IRR
- -10.0%
- Equity multiple
- 0.63×
- Total profit
- $-16,896
- Equity at exit
- $24,587
- IRR
- -0.6%
- Equity multiple
- 0.96×
- Total profit
- $-1,997
- Equity at exit
- $14,258
Cash invested: $46,172 (down + closing). Projections, not guarantees.
Landlord ↔ Tenant lean methodology
- Overall (STATE)
- 62 Landlord-Friendly
- State Pennsylvania
- 62 Landlord-Friendly · EVEN
- County
- — inherits STATE
- City
- — inherits STATE
ZIP-level market 16648
- Home prices YoY
- -32.1%
- Active inventory
- 86
- Price-to-rent
- 8.4×
Monthly cashflow live
- Estimated rent
- $1,635 medium interval (Pro) →
- Mortgage (P&I)
- −$865
- Tax from tax record
- −$204 /mo · $2,452/yr
- Insurance
- −$69
- HOA
- −$0
- Vacancy / Maint / Mgmt
- −$343
- Net cashflow
- $154
Break-even live
Sensitivity live
| Price | -10% $247 | -5% $201 | +0% $154 | +5% $107 | +10% $61 |
|---|---|---|---|---|---|
| Rent | -10% $25 | -5% $89 | +0% $154 | +5% $218 | +10% $283 |
| Rate | -1.0pp $237 | -0.5pp $196 | base $154 | +0.5pp $111 | +1.0pp $68 |
UW: 25.0% down · 7.5% · 30yr · 1.5% tax · 5.0% vac · 8.0% maint · 8.0% mgmt
Financing live
Cash to close
- Down payment
- $41,225
- Closing costs
- $4,947
- Reserves months
- —
- Total cash needed
- —
Loan-product check · same deal, 3 products live
Conventional
25% down · 7.5% · 30yr
- Down + closing
- —
- Monthly P&I
- —
- Monthly cashflow
- —
- DSCR
- —
- Eligible?
- —
Personal DTI + credit; lowest rate.
DSCR
20% down · 8.5% · 30yr
- Down + closing
- —
- Monthly P&I
- —
- Monthly cashflow
- —
- DSCR
- —
- Eligible?
- —
No personal income docs; deal must DSCR.
Hard money
10% down · 12.0% · 12mo
- Down + closing
- —
- Monthly P&I
- —
- Monthly cashflow
- —
- DSCR
- —
- Eligible?
- —
Short-term bridge; refi at stabilization.
Rent comps 1 comps
| Address | Beds | Baths | Sqft | Rent | $/sqft | DOM | Units | Dist |
|---|---|---|---|---|---|---|---|---|
| 1152 Four Leaf Ln Hollidaysburg, PA | 2.0–3.0 | 1.5–2.0 | 1517 | $1,635 | $1.08 | 44d | 8 | 1.06mi |
Listing history 32 events
-
2026-06-19days on market $164,900 Active 38 DOM
-
2026-06-18days on market $164,900 Active 37 DOM
-
2026-06-17days on market $164,900 Active 36 DOM
-
2026-06-17price $164,900 Active 35 DOM
-
2026-06-16days on market $169,900 Active 35 DOM
-
2026-06-15days on market $169,900 Active 34 DOM
-
2026-06-14days on market $169,900 Active 32 DOM
-
2026-06-13days on market $169,900 Active 31 DOM
-
2026-06-10days on market $169,900 Active 29 DOM
-
2026-06-09days on market $169,900 Active 28 DOM
-
2026-06-08days on market $169,900 Active 27 DOM
-
2026-06-07days on market $169,900 Active 26 DOM
-
2026-06-05days on market $169,900 Active 23 DOM
-
2026-06-03days on market $169,900 Active 22 DOM
-
2026-06-02days on market $169,900 Active 21 DOM
-
2026-06-01days on market $169,900 Active 20 DOM
-
2026-05-31days on market $169,900 Active 19 DOM
-
2026-05-30days on market $169,900 Active 18 DOM
-
2026-05-12$169,900 Active 382-char remark
-
2021-11-23soldstatus $120,000
-
2021-11-22soldstatus $115,000
Show marketing remark (95 chars)
3 BR 1.5 BA 2 story on borough lot. Eat in kitchen leads to back porch overlooking fenced yard.
-
2021-09-28$124,900
Show marketing remark (95 chars)
3 BR 1.5 BA 2 story on borough lot. Eat in kitchen leads to back porch overlooking fenced yard.
-
2018-05-21soldstatus $132,500
-
2015-05-08$133,000
-
2013-09-27soldstatus $120,000
-
2013-09-27soldstatus $120,000
-
2013-05-28$122,000
-
2007-05-29soldstatus $99,000
-
2007-05-29soldstatus $99,000
-
2007-05-29soldstatus $99,000
-
2007-04-07$105,000
-
2000-05-19soldstatus $54,000
ⓘ Source: listings_history table (triggers on properties + properties_extension) + one-shot
backfill from property_details.listing_events for pre-trigger history.
Tax reassessment forecast PA · Partial reset (capped growth)
- Current annual tax
- $2,452 · $204/mo
- Projected year-2 tax
- $2,529 · $211/mo
- Expected delta
- +$77/yr (+$6/mo · 3.1%)
ⓘ Screening estimate from a state-policy table — verify with the county assessor before closing.
Climate risk First Street
- Flood 1/10 Low FEMA zone X (unshaded) · 0% chance over 30 yrs
- Wildfire 1/10 Low
- Heat 4/10 Moderate 7 d/yr ≥95°F today · 18 d/yr by 30 yrs out
- Wind 2/10 Low
- Air quality 2/10 Low 1 unhealthy d/yr today · 3 by 30 yrs out
Nearby sold comps map
Loading sold comps map…
Walkable amenities ~0.75 mi
Loading nearby amenities…
Taxation est. · year 1
- Rental income
- $19,620
- − Mortgage interest
- −$9,237
- − Property taxes
- −$2,452
- − Insurance
- −$824
- − Repairs & maintenance
- −$1,570
- − Management
- −$1,570
- − Depreciation
- −$4,797
- Taxable loss
- −$829
- Est. tax savings @ 24.0%
- +$199
- After-tax cash flow
- $2,046/yr
For passive investors: Depreciation is non-cash, so a rental often shows a tax loss while cash-flowing — sheltering income. Rental losses are passive: they offset passive income freely, and up to $25,000/yr can offset ordinary (W-2) income if you actively participate and your MAGI is under $100k (phasing out to $0 by $150k); unused losses carry forward. On sale, claimed depreciation is recaptured at up to 25%, and gains may owe capital-gains tax (a 1031 exchange can defer both). Figures are a year-1 estimate at your 24.0% rate — not tax advice; consult a CPA.
Schools (NCES district)
- District
- Hollidaysburg Area SD
- NCES district ID
- 4211940
- Math proficiency
- 45% ▼ -9.00%
- Reading proficiency
- 63% ▼ -8.00%
- Median HH income
- $50,676
- Composite
- 46.1/100
- National rank
- #2511
- State rank
- #129 of 539 in PA
Livability — Hollidaysburg
- Score
- 81/100
- State rank
- #184
- US rank
- #1549
Category grades
Schools grade is shown separately in the Schools card above.
Census & demographics
- Census place
- Hollidaysburg, PA
- Population (ZIP)
- 14,722
Population outlook (Blair County) Hauer SSP2
- Today (2025)
- 121,571 people
- By 2030
- 117,966 · -3.0%
- By 2040
- 109,174 · -10.2%
- By 2050
- 99,542 · -18.1%
- By 2075
- 76,775 · -36.8%
- By 2100
- 54,326 · -55.3%
Race, ethnicity, and origin ACS 2023
- Neighborhood character
- Predominantly White (96%)
- Race & ethnicity
- White 96% Two or more races 3% Hispanic / Latino 1%
- Common ancestry
- Romanian 6% Iranian 2% Slovak 1%
- Foreign-born
- 2% · Canada
- Languages at home
- 97% English-only · Other Indo-European 1% Arabic 1%
Political lean MEDSL · Blair
- 2024 margin
- Solid R (+43.5) · D 27.9% · R 71.4%
- 2008→2024 swing
- -19.2pp toward R · 2008: -24.3pp · 2024: -43.5pp
- All cycles
- 2024: R+43.5 2020: R+43.5 2016: R+46.4 2012: R+33.5 2008: R+24.3
Not yet ingested
- Civics
- —
Market trends
- HPI YoY
- ▼ -77.77%
- Current HPI
- 164.7441
- Rent YoY
- —
- Metro
- —
- State GDP YoY
- ▲ 1.68%
- F500 in state
- 34
Industry mix (Fortune 500 HQ in PA)
| Industry | F500 HQs | Revenue |
|---|---|---|
| Healthcare | 2 | $309B |
|
||
| Insurance | 2 | $27B |
|
||
| Telecommunications / Media | 1 | $124B |
|
||
| Industrial Distribution | 1 | $22B |
|
||
| Financial Services | 1 | $20B |
|
||
| Chemicals / Materials | 1 | $18B |
|
||
Price history
+205.4% since first listed15 events — show timeline
- 2026-06-16 Price Changed $164,900 FSBO.com
- 2026-05-12 Listed $169,900 FSBO.com
- 2021-11-23 Sold (Public Records) $120,000 Public Records
- 2021-11-22 Sold (MLS) $115,000 AHARMLS
- 2021-09-28 Listed $124,900 AHARMLS
- 2018-05-21 Sold (Public Records) $132,500 Public Records
- 2015-05-08 Listed $133,000 AHARMLS
- 2013-09-27 Sold (Public Records) $120,000 Public Records
- 2013-09-27 Sold (MLS) $120,000 AHARMLS
- 2013-05-28 Listed $122,000 AHARMLS
- 2007-05-29 Sold (Public Records) $99,000 Public Records
- 2007-05-29 Sold (Public Records) $99,000 Public Records
- 2007-05-29 Sold (MLS) $99,000 AHARMLS
- 2007-04-07 Listed $105,000 AHARMLS
- 2000-05-19 Sold (Public Records) $54,000 Public Records
Property tax history
+8.8%/yrLatest (2025): $2,452 · +2.0% YoY. Source: county tax records.
Cash-flow waterfall
monthlySold comps — $/sqft
last 12 mo · ≤1 miLoading sold comps…