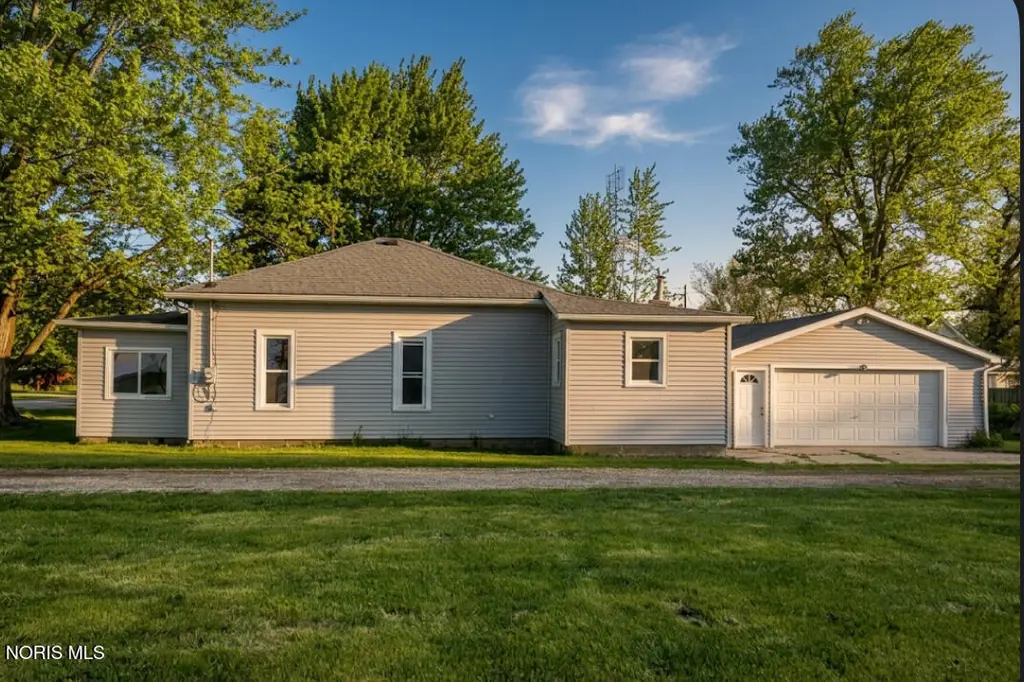
10555 Farmer Mark Rd · Cecil, OH
Flood risk 1/10 · Minimal
- FEMA flood zone
- X (unshaded)
- Chance of flooding over 30 yrs
- 0.0%
- Est. flood insurance / yr
- $507 – $1,088
Fire risk 1/10 · Minimal
- Est. fire insurance / yr
- $713 – $1,323
Heat risk 3/10 · Minor
- Hot days now (above 101°F)
- 7 days/yr
- Hot days in 30 yrs
- 17 days/yr
Wind risk 2/10 · Minimal
- Chance of severe wind over 30 yrs
- —
Air-quality risk 2/10 · Minimal
- Unhealthy air days now
- 1 days/yr
- Unhealthy air days in 30 yrs
- 2 days/yr
Risk factors via First Street. Map © Google.
Why this score? — see what drove the C- grade
The composite is a weighted blend of 9 inputs, each scored 0–100. Each bar is that input's sub-score; the figure is the points it added to the 100-point composite (weight × sub-score).
- Cash flow +15.6/30.0
- ARV discount +7.5/15.0
- Appreciation +7.2/10.0
- Schools +5.6/10.0
- DSCR +4.8/10.0
- 1% rule +3.1/10.0
- Livability +3.0/5.0
- Rent growth +2.5/5.0
- Condition / age +2.5/5.0
$119,900
🖨 Deal sheet 📄 Offer letter ✓ Due diligence
Listing remarks MLS
Well maintained home with 3 additional lots and utility building. Newer furnace, roof, windows and siding. Now being offered under auction terms, 4/5/2015 thru 4/8/2015. All auction assets will be sold subject to seller approval.
Key facts
- Brand-new flooring
- Fresh paint
- Newer windows
Tags
Property features AI
Finance
- Other: Additional parcels included; Directions provided to property
Exterior
- Parking: Attached garage and driveway; 2-car garage
- Utilities: Electricity connected; Propane service; Private sewer; Well water
- Home design: Single-family residence (house); One story; No common walls; Entry/main level living; Living area reported as 1,160 (appraiser)
- Construction: Vinyl siding; Crawl space foundation
- Exterior features: Shingle roof; Shed(s); Corner lot; City street frontage; Paved road
Interior
- Kitchen: Kitchen on main level (approx. 16 x 10)
- Bedrooms: Bedroom 2 on main level (approx. 14 x 9); Bedroom 3 on main level (approx. 9 x 10)
- Flooring: Carpet; Plank flooring
- Bathrooms: 1 full bathroom
- Heating & cooling: Propane heating
- Interior features: Entrance foyer; Open floorplan; 7 total rooms
- Laundry & utility: Laundry on main level with electric dryer hookup; Mud room on main level (approx. 9 x 13)
Neighborhood map
What this means for you Summary
Snapshot
- This is a 3-bed/1.0-bath single-family listed at $120k.
Deal economics
- At list price, monthly cash flow is $50 ($595/yr) — positive.
- The deal already cash-flows at list — no discount required.
- To meet the 1% rule (rent ≥ 1% of price), the offer needs to be $97k (19.4% below list).
- Recommended offer: $97k (19.4% below list) — sets the bar for 1% rule.
Location & tenants
- Location reads 60/100 on livability (#984 in OH) — a middle-class / working-renter tenant base. Strengths: cost of living A+, housing A, employment B+; Watch: crime D+, amenities F, commute F.
- Central Local (rural): math 66% / reading 66% proficiency, ranked #195 of 656 in OH (top 30%) — acceptable for families but not a draw, mixed tenant base, ~2y average lease.
- Zoned schools: Fairview Elementary School (math 69% / reading 63%, grade B+, #505 of 1,584 statewide, top 32%, 432 students, 39% FRL); Fairview Middle School (math 68% / reading 67%, grade A-, #161 of 654 statewide, top 25%, 222 students, 0% FRL); Fairview High School (math 52% / reading 67%, grade C+, #243 of 781 statewide, top 33%, 261 students, 64% FRL) — zoned schools at 34% FRL track the district average.
- Market conditions: 2 active listings in the ZIP; solid renter incomes; 41 units permitted in Defiance County in 2024 (0 in 5+ unit buildings).
- This rent is only 12% of the median local income ($98k/yr) — well below the 30% rent-burden line; pricing power to push rent on renewal without tenant pushback.
Forward outlook
- In year one you build about $6k of equity ($829 loan paydown + $5k appreciation (4.5% local appreciation)).
- Defiance County population projected at -16% by 2050 — secular population decline; favor cash flow + early exit over multi-decade hold.
- At projected returns (4.5% appreciation + 3.0% rent growth), your $34k cash investment doubles in ~5 years — after that, you're playing with house money.
- By year 6, paydown + projected appreciation supports a ~$33k cash-out refi (75% LTV) — recoverable capital for the next deal without selling this one.
Negotiation context
- It's been on market 28 days — a 2% lower offer ($118k) is reasonable based on typical stale-listing flexibility.
- 6 sale attempts since 21y ago with the ask held roughly flat each time — persistent listings suggest the price (not the market) is what's stuck; bring a comps-based counter.
- Current owner paid $38k; list at $120k implies a 220% gain — meaningful room to come down on a strong offer.
Risks & watch-outs
- Watch-outs: built in 1930 — expect roof / HVAC / electrical / plumbing capex.
Questions for the listing agent
- Built in 1930 — when were the roof, HVAC, electrical panel, plumbing, and water heater last replaced?
- Is there a deadline driving the sale (1031 exchange, divorce, estate, relocation)? That informs how much negotiation room exists.
- Schools are F-rated, which usually means shorter tenancies and higher turnover. Who's the typical renter profile here, and what's been the actual vacancy rate?
- Crime grade is D in this area — have there been break-ins, vandalism, or insurance claims at this property in the last 3 years? What carrier currently insures it and at what premium?
- What's the average days-on-market for RENTAL listings here right now (not sales)? A rising rental-DOM trend means longer vacancies and softer asking-rent achievability than the comps imply.
- What's the recent tenant-quality profile in this submarket — average credit score on applications, eviction rate, late-payment / NSF rate, and stable-employment percentage? A property-management company in the area should have these aggregated.
- How much new for-sale + rental construction is in the pipeline within 1–3 miles? Heavy new supply typically softens prices + rents 12–24 months out; constrained supply supports both.
Investment metrics
- 1% rule
- 0.81% ✗
- Cap rate
- 6.79%
- Cash-on-cash
- 1.77%
- DSCR
- 1.08
- GRM
- 10.3
CMA / ARV
No comps found within radius.
Projected returns pro-forma
4.48% appreciation · 3.0% rent growth · sell at horizon
- IRR
- 13.1%
- Equity multiple
- 1.81×
- Total profit
- $27,217
- Equity at exit
- $64,200
- IRR
- 14.2%
- Equity multiple
- 3.42×
- Total profit
- $81,230
- Equity at exit
- $107,819
Cash invested: $33,572 (down + closing). Projections, not guarantees.
Landlord ↔ Tenant lean methodology
- Overall (STATE)
- 73 Landlord-Friendly
- State Ohio
- 73 Landlord-Friendly · R+6
- County
- — inherits STATE
- City
- — inherits STATE
ZIP-level market 43536
- Home prices YoY
- 2.2%
- Active inventory
- 2
- Price-to-rent
- 10.3×
Monthly cashflow live
- Estimated rent
- $966 medium interval (Pro) →
- Mortgage (P&I)
- −$629
- Tax from tax record
- −$35 /mo · $422/yr
- Insurance
- −$50
- HOA
- −$0
- Vacancy / Maint / Mgmt
- −$203
- Net cashflow
- $50
Break-even live
UW: 25.0% down · 7.5% · 30yr · 1.5% tax · 5.0% vac · 8.0% maint · 8.0% mgmt
Financing live
Cash to close
- Down payment
- $29,975
- Closing costs
- $3,597
- Reserves months
- —
- Total cash needed
- —
Loan-product check · same deal, 3 products live
Conventional
25% down · 7.5% · 30yr
- Down + closing
- —
- Monthly P&I
- —
- Monthly cashflow
- —
- DSCR
- —
- Eligible?
- —
Personal DTI + credit; lowest rate.
DSCR
20% down · 8.5% · 30yr
- Down + closing
- —
- Monthly P&I
- —
- Monthly cashflow
- —
- DSCR
- —
- Eligible?
- —
No personal income docs; deal must DSCR.
Hard money
10% down · 12.0% · 12mo
- Down + closing
- —
- Monthly P&I
- —
- Monthly cashflow
- —
- DSCR
- —
- Eligible?
- —
Short-term bridge; refi at stabilization.
Listing history 31 events
-
2026-06-18days on market $119,900 Active 28 DOM
-
2026-06-17days on market $119,900 Active 27 DOM
-
2026-06-16days on market $119,900 Active 26 DOM
-
2026-06-15days on market $119,900 Active 25 DOM
-
2026-06-13days on market $119,900 Active 23 DOM
-
2026-06-12days on market $119,900 Active 22 DOM
-
2026-06-09days on market $119,900 Active 19 DOM
-
2026-06-08days on market $119,900 Active 18 DOM
-
2026-06-08days on market $119,900 Active 17 DOM
-
2026-06-05statusdays on market $119,900 Active 15 DOM
-
2026-06-04days on market $119,900 Contingent 13 DOM
-
2026-06-02days on market $119,900 Contingent 12 DOM
-
2026-06-01days on market $119,900 Contingent 11 DOM
-
2026-05-31days on market $119,900 Contingent 10 DOM
-
2026-05-21$119,900 Active
-
2025-10-14price $17,593 229-char remark
Show marketing remark (229 chars)
Well maintained home with 3 additional lots and utility building. Newer furnace, roof, windows and siding. Now being offered under auction terms, 4/5/2015 thru 4/8/2015. All auction assets will be sold subject to seller approval.
-
2025-04-04soldstatus $37,507
-
2019-02-27historical
-
2018-12-14$32,900
-
2018-11-07historical
-
2018-09-07$39,900
-
2015-05-19soldstatus $17,600
-
2015-05-11soldstatus $17,593 229-char remark
Show marketing remark (229 chars)
Well maintained home with 3 additional lots and utility building. Newer furnace, roof, windows and siding. Now being offered under auction terms, 4/5/2015 thru 4/8/2015. All auction assets will be sold subject to seller approval.
-
2015-04-24price $40,850 229-char remark
Show marketing remark (229 chars)
Well maintained home with 3 additional lots and utility building. Newer furnace, roof, windows and siding. Now being offered under auction terms, 4/5/2015 thru 4/8/2015. All auction assets will be sold subject to seller approval.
-
2014-08-05soldstatus $34,000
-
2014-07-22$40,850 229-char remark
Show marketing remark (229 chars)
Well maintained home with 3 additional lots and utility building. Newer furnace, roof, windows and siding. Now being offered under auction terms, 4/5/2015 thru 4/8/2015. All auction assets will be sold subject to seller approval.
-
2013-05-31historical
-
2013-01-30$79,900
-
2006-03-31soldstatus $71,000
-
2005-12-31historical
-
2005-08-26$72,500
ⓘ Source: listings_history table (triggers on properties + properties_extension) + one-shot
backfill from property_details.listing_events for pre-trigger history.
Tax reassessment forecast OH · Partial reset (capped growth)
- Current annual tax
- $422 · $35/mo
- Projected year-2 tax
- $1,146 · $96/mo
- Expected delta
- +$724/yr (+$60/mo · 171.8%)
ⓘ Screening estimate from a state-policy table — verify with the county assessor before closing.
Climate risk First Street
- Flood 1/10 Low FEMA zone X (unshaded) · 0% chance over 30 yrs
- Wildfire 1/10 Low
- Heat 3/10 Moderate 7 d/yr ≥101°F today · 17 d/yr by 30 yrs out
- Wind 2/10 Low
- Air quality 2/10 Low 1 unhealthy d/yr today · 2 by 30 yrs out
Nearby sold comps map
Loading sold comps map…
Walkable amenities ~0.75 mi
Loading nearby amenities…
Taxation est. · year 1
- Rental income
- $11,597
- − Mortgage interest
- −$6,716
- − Property taxes
- −$422
- − Insurance
- −$600
- − Repairs & maintenance
- −$928
- − Management
- −$928
- − Depreciation
- −$3,488
- Taxable loss
- −$1,484
- Est. tax savings @ 24.0%
- +$356
- After-tax cash flow
- $951/yr
For passive investors: Depreciation is non-cash, so a rental often shows a tax loss while cash-flowing — sheltering income. Rental losses are passive: they offset passive income freely, and up to $25,000/yr can offset ordinary (W-2) income if you actively participate and your MAGI is under $100k (phasing out to $0 by $150k); unused losses carry forward. On sale, claimed depreciation is recaptured at up to 25%, and gains may owe capital-gains tax (a 1031 exchange can defer both). Figures are a year-1 estimate at your 24.0% rate — not tax advice; consult a CPA.
Schools (NCES district)
- District
- Central Local
- NCES district ID
- 3904671
- Math proficiency
- 66% ▼ -12.00%
- Reading proficiency
- 66% ▼ -9.00%
- Median HH income
- $52,402
- Composite
- 56.29/100
- National rank
- #1169
- State rank
- #195 of 656 in OH
Livability — Cecil
- Score
- 60/100
- State rank
- #984
- US rank
- #19210
Category grades
Schools grade is shown separately in the Schools card above.
Census & demographics
- County
- Defiance · 37,898 people
- Population (ZIP)
- 252
- Household income
- $97,969
- Rent vs Own
Population outlook (Defiance County) Hauer SSP2
- Today (2025)
- 37,051 people
- By 2030
- 36,013 · -2.8%
- By 2040
- 33,583 · -9.4%
- By 2050
- 31,309 · -15.5%
- By 2075
- 26,980 · -27.2%
- By 2100
- 23,416 · -36.8%
Race, ethnicity, and origin ACS 2023
- Neighborhood character
- Predominantly White (100%)
- Race & ethnicity
- White 100%
- Common ancestry
- Slovak 29% Romanian 3%
Political lean MEDSL · Defiance
- 2024 margin
- Solid R (+39.9) · D 29.6% · R 69.5%
- 2008→2024 swing
- -29.4pp toward R · 2008: -10.5pp · 2024: -39.9pp
- All cycles
- 2024: R+39.9 2020: R+36.4 2016: R+34.8 2012: R+14.1 2008: R+10.5
Not yet ingested
- Civics
- —
Market trends
- HPI YoY
- ▲ 4.48%
- Current HPI
- 211.3743
- Rent YoY
- —
- Metro
- —
- State GDP YoY
- ▲ 1.98%
- F500 in state
- 48
Industry mix (Fortune 500 HQ in OH)
| Industry | F500 HQs | Revenue |
|---|---|---|
| Insurance | 3 | $145B |
|
||
| Industrial Machinery | 3 | $49B |
|
||
| Financial Services | 3 | $24B |
|
||
| Consumer Goods | 2 | $93B |
|
||
| Aerospace / Defense | 2 | $47B |
|
||
| Utilities | 2 | $33B |
|
||
Price history
+65.4% since first listed17 events — show timeline
- 2026-05-21 Listed $119,900 NORIS
- 2025-10-14 Price Changed $17,593 NORIS
- 2025-04-04 Sold (Public Records) $37,507 Public Records
- 2019-02-27 Listing Removed — NORIS
- 2018-12-14 Listed $32,900 NORIS
- 2018-11-07 Listing Removed — NORIS
- 2018-09-07 Listed $39,900 NORIS
- 2015-05-19 Sold (Public Records) $17,600 Public Records
- 2015-05-11 Sold (MLS) $17,593 NORIS
- 2015-04-24 Price Changed $40,850 NORIS
- 2014-08-05 Sold (Public Records) $34,000 Public Records
- 2014-07-22 Listed $40,850 NORIS
- 2013-05-31 Listing Removed — NORIS
- 2013-01-30 Listed $79,900 NORIS
- 2006-03-31 Sold (Public Records) $71,000 Public Records
- 2005-12-31 Listing Removed — NORIS
- 2005-08-26 Listed $72,500 NORIS
Property tax history
+30.8%/yrLatest (2025): $422 · +2.5% YoY. Source: county tax records.
Cash-flow waterfall
monthlySold comps — $/sqft
last 12 mo · ≤1 miLoading sold comps…