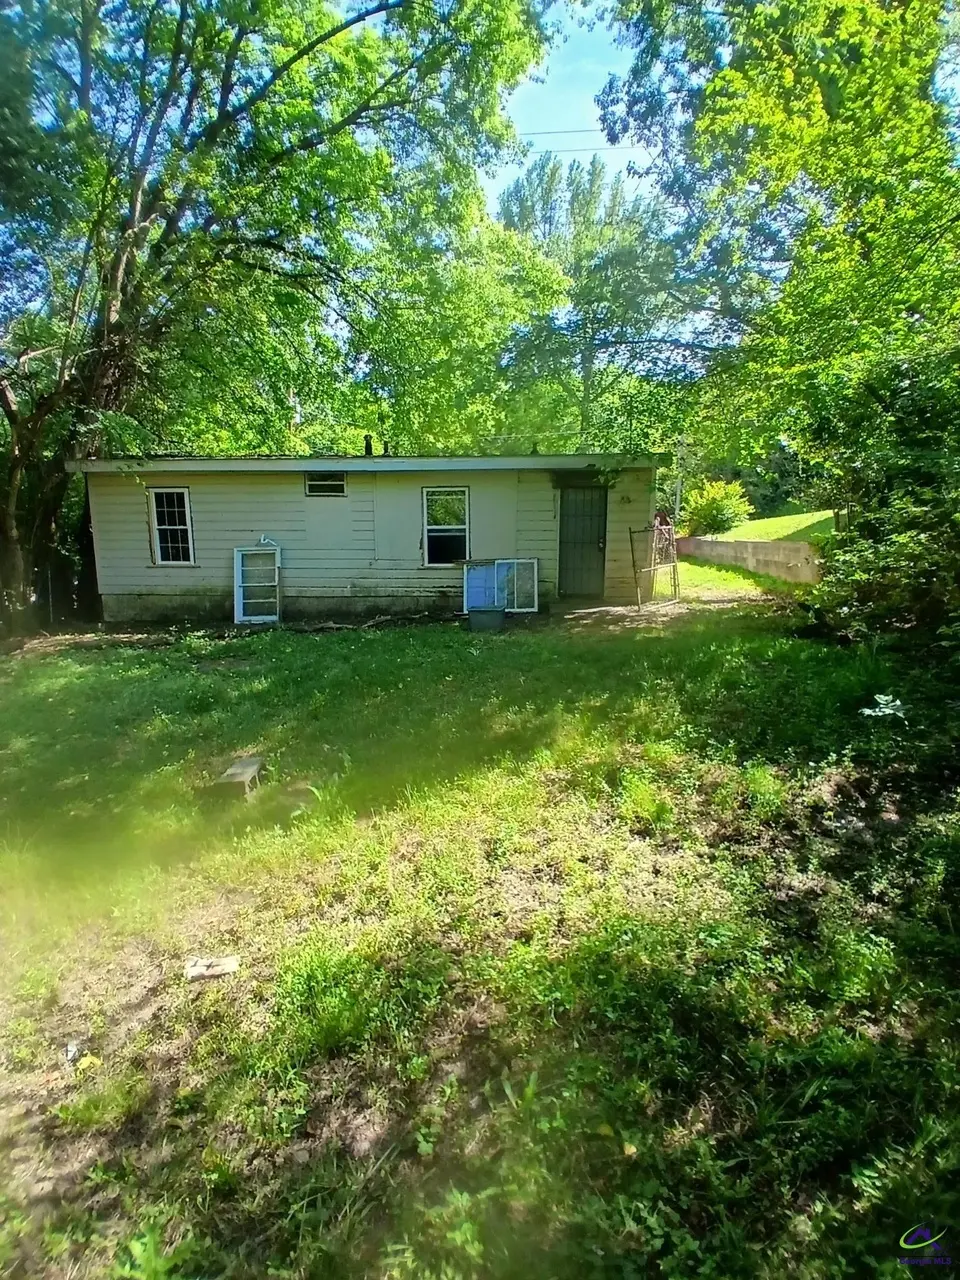
4035 Villa Ave · Macon-Bibb County, GA
Flood risk 6/10 · Moderate
- FEMA flood zone
- X (unshaded)
- Chance of flooding over 30 yrs
- 0.72%
- Est. flood insurance / yr
- $507 – $1,088
Fire risk 2/10 · Minimal
- Est. fire insurance / yr
- $963 – $1,789
Heat risk 6/10 · Moderate
- Hot days now (above 108°F)
- 7 days/yr
- Hot days in 30 yrs
- 16 days/yr
Wind risk 6/10 · Moderate
- Chance of severe wind over 30 yrs
- 68.0%
Air-quality risk 4/10 · Minor
- Unhealthy air days now
- 3 days/yr
- Unhealthy air days in 30 yrs
- 5 days/yr
Risk factors via First Street. Map © Google.
Why this score? — see what drove the B- grade
The composite is a weighted blend of 9 inputs, each scored 0–100. Each bar is that input's sub-score; the figure is the points it added to the 100-point composite (weight × sub-score).
- Cash flow +30.0/30.0
- 1% rule +10.0/10.0
- DSCR +10.0/10.0
- ARV discount +7.5/15.0
- Rent growth +3.7/5.0
- Livability +2.5/5.0
- Condition / age +2.5/5.0
- Schools +1.2/10.0
- Appreciation +0.0/10.0
$23,000
🖨 Deal sheet 📄 Offer letter ✓ Due diligence
Listing remarks MLS
INVESTOR SPECIAL/ Fix & FLIP or Add to Rental Portfolio GREAT 2/1 ready for your vision
Key facts
- 0.35 acre lot
- Built 1955
- Listed 58 days
Neighborhood map
What this means for you Summary
Snapshot
- This is a 2-bed/1.0-bath single-family listed at $23k.
Deal economics
- At list price, monthly cash flow is $575 ($7k/yr) — positive.
- The deal already cash-flows at list — no discount required.
- Meets the 1% rule at list price ($933 rent vs $23k).
- Recommended offer: $22k (3.0% below list) — sets the bar for market timing.
- Cap rate 36.3% vs local median 5.4% in Macon-Bibb County — top-decile yield for the area; either an underpriced asset or a hidden risk that comps aren't pricing in. Stress-test before assuming the spread holds.
Location & tenants
- Location reads: area grade B — affects rentability + tenant quality, not the cash-flow math above.
- Bibb County (urban): math 11% / reading 18% proficiency, ranked #161 of 174 in GA (top 92%) — low school quality limits family demand, transient renter base, plan for 1-2y turnover; 75% free/reduced lunch — lower-income household profile, screen leases tightly.
- Market conditions: Rents rising fast (+4.6%/yr); 255 active listings in the ZIP; 28 comparable units currently listed for rent nearby; rentals at typical pace (median 21d on market — plan ~3-4 weeks tenant-placement turnaround); lower-income renter base — watch delinquency; 154 units permitted in Bibb County in 2024 (0 in 5+ unit buildings).
Forward outlook
- Local home prices are declining (-3.0%/yr); year-one equity from $159 of loan paydown is wiped out by about $690 of value loss. Plan a longer hold.
- Bibb County population projected at -12% by 2050 — secular population decline; favor cash flow + early exit over multi-decade hold.
- At projected returns (-3.0% appreciation + 4.6% rent growth), your $6k cash investment doubles in ~2 years — after that, you're playing with house money.
Negotiation context
- It's been on market 58 days — a 3% lower offer ($22k) is reasonable based on typical stale-listing flexibility.
- 3 sale attempts; this cycle's ask has dropped $22k (49%) from the opening price — seller is motivated, your offer sets the floor, not the list.
- Current owner paid $14k; list at $23k implies a 64% gain — meaningful room to come down on a strong offer.
Risks & watch-outs
- Watch-outs: built in 1955 — expect roof / HVAC / electrical / plumbing capex.
- Climate carrying-cost: major flood risk; major wind risk, 68% chance of damaging wind over 30y; extreme-heat days projected 7→16/yr by 2055 (HVAC capex compounding) — expect insurance premiums to compound above CPI over the hold.
Questions for the listing agent
- It's been on market 58 days. Have you received any prior offers? Is the seller open to a 3% concession, seller financing, or rate buy-down credit?
- Built in 1955 — when were the roof, HVAC, electrical panel, plumbing, and water heater last replaced?
- Is there a deadline driving the sale (1031 exchange, divorce, estate, relocation)? That informs how much negotiation room exists.
- What's the average days-on-market for RENTAL listings here right now (not sales)? A rising rental-DOM trend means longer vacancies and softer asking-rent achievability than the comps imply.
- What's the recent tenant-quality profile in this submarket — average credit score on applications, eviction rate, late-payment / NSF rate, and stable-employment percentage? A property-management company in the area should have these aggregated.
- How much new for-sale + rental construction is in the pipeline within 1–3 miles? Heavy new supply typically softens prices + rents 12–24 months out; constrained supply supports both.
Investment metrics
- 1% rule
- 4.06% ✓
- Cap rate
- 36.29%
- Cash-on-cash
- 107.15%
- DSCR
- 5.77
- GRM
- 2.1
CMA / ARV
- ARV (on-the-fly)
- $49,088
- Comps found
- 9
Show comp detail 9 sales within ~0.75 mi
| Address | Dist | Beds/Ba | Sqft | Sold | Price | $/sf | Match |
|---|---|---|---|---|---|---|---|
| 3975 Fairmont Ave | 0.07mi | 2/1.5 | 864 (+4%) | 13mo | $23,000 | $27 | 78 |
| 3966 George St | 0.28mi | 2/1.0 | 776 (-7%) | 13mo | $48,000 | $62 | 64 |
| 4583 Shadow Lawn Dr | 0.54mi | 2/1.0 | 825 (-1%) | 11mo | $85,000 | $103 | 64 |
| 3555 Plymouth Dr | 0.64mi | 3/1.0 (+1) | 864 (+4%) | 2mo | $49,000 | $57 | 57 |
| 3469 Charleston Cir | 0.71mi | 3/1.0 (+1) | 856 (+3%) | 2mo | $49,900 | $58 | 55 |
| 3653 Morgan Dr | 0.69mi | 2/1.0 | 852 (+2%) | 15mo | $50,000 | $59 | 52 |
| 3975 Forest Ave W | 0.32mi | 3/1.0 (+1) | 912 (+10%) | 18mo | $24,000 | $26 | 49 |
| 3640 Hillcrest Ave | 0.69mi | 2/1.0 | 880 (+6%) | 14mo | $75,000 | $85 | 47 |
| 3641 Dawn St | 0.55mi | 1/1.0 (-1) | 746 (-10%) | 12mo | $49,500 | $66 | 43 |
Match score weights: distance 35% · size 25% · config 20% · recency 20%. Top-matched comps best support the ARV.
Projected returns pro-forma
-3.0% appreciation · 4.61% rent growth · sell at horizon
- IRR
- —
- Equity multiple
- 6.35×
- Total profit
- $34,449
- Equity at exit
- $3,429
- IRR
- —
- Equity multiple
- 14.00×
- Total profit
- $83,734
- Equity at exit
- $1,989
Cash invested: $6,440 (down + closing). Projections, not guarantees.
Landlord ↔ Tenant lean methodology
- Overall (STATE)
- 90 Strongly Landlord-Friendly
- State Georgia
- 90 Strongly Landlord-Friendly · R+3
- County
- — inherits STATE
- City
- — inherits STATE
ZIP-level market 31204
- Rents YoY
- 4.6%
- Active inventory
- 255
- Price-to-rent
- 2.1×
Monthly cashflow live
- Estimated rent
- $933 high interval (Pro) →
- Mortgage (P&I)
- −$121
- Tax from tax record
- −$32 /mo · $383/yr
- Insurance
- −$10
- HOA
- −$0
- Vacancy / Maint / Mgmt
- −$196
- Net cashflow
- $575
Break-even live
UW: 25.0% down · 7.5% · 30yr · 1.5% tax · 5.0% vac · 8.0% maint · 8.0% mgmt
Financing live
Cash to close
- Down payment
- $5,750
- Closing costs
- $690
- Reserves months
- —
- Total cash needed
- —
Loan-product check · same deal, 3 products live
Conventional
25% down · 7.5% · 30yr
- Down + closing
- —
- Monthly P&I
- —
- Monthly cashflow
- —
- DSCR
- —
- Eligible?
- —
Personal DTI + credit; lowest rate.
DSCR
20% down · 8.5% · 30yr
- Down + closing
- —
- Monthly P&I
- —
- Monthly cashflow
- —
- DSCR
- —
- Eligible?
- —
No personal income docs; deal must DSCR.
Hard money
10% down · 12.0% · 12mo
- Down + closing
- —
- Monthly P&I
- —
- Monthly cashflow
- —
- DSCR
- —
- Eligible?
- —
Short-term bridge; refi at stabilization.
Rent comps 28 comps
| Address | Beds | Baths | Sqft | Rent | $/sqft | DOM | Units | Dist |
|---|---|---|---|---|---|---|---|---|
| 4126 Ayers Rd Macon, GA | 2.0 | 1.0 | 900 | $750 | $0.83 | 13d | 1 | 0.17mi |
| 3808 Fairmont Ave Unit A Macon, GA | 1.0 | 1.0 | 793 | $595 | $0.75 | 43d | 1 | 0.18mi |
| 4033 N Napier Ave Unit 6 Macon, GA | 2.0 | 1.5 | 1000 | $850 | $0.85 | 43d | 1 | 0.21mi |
| 3834 Mercer St Macon, GA | 2.0 | 1.0 | 1000 | $875 | $0.88 | 43d | 1 | 0.26mi |
| 4250 Ayers Rd Macon, GA | 2.0 | 1.0 | 1008 | $1,100 | $1.09 | 13d | 1 | 0.27mi |
| 4357 Azalea Dr Unit 4357 Macon, GA | 2.0 | 1.0 | 750 | $750 | $1.00 | 43d | 1 | 0.36mi |
| 3576 Vineville Ave Unit 3550-D-LT Macon, GA | 2.0 | 2.0 | 863 | $995 | $1.15 | 13d | 1 | 0.41mi |
| 4353 Barrington Pl Macon, GA | 2.0 | 1.5 | 1108 | $1,000 | $0.90 | 13d | 1 | 0.44mi |
| 4342 Barrington Pl Macon, GA | 2.0 | 1.5 | 1092 | $950 | $0.87 | 21d | 1 | 0.46mi |
| 140 Prentice Pl Apt F Macon, GA | 1.0 | 1.0 | 600 | $785 | $1.31 | 43d | 1 | 0.51mi |
| 140 Prentice Pl Apt E Macon, GA | 1.0 | 1.0 | 600 | $1,400 | $2.33 | 43d | 1 | 0.51mi |
| 133 Auburn Ave Macon, GA | 2.0 | 1.0 | 880 | $895 | $1.02 | 43d | 1 | 0.52mi |
| 3634 Dawn St Macon, GA | 3.0 | 1.0 | 999 | $850 | $0.85 | 43d | 1 | 0.63mi |
| 3324 Vineville Ave Unit 57C Macon, GA | 2.0 | 1.0 | 914 | $1,050 | $1.15 | 13d | 1 | 0.67mi |
| 3324 Vineville Ave Unit 63B Macon, GA | 2.0 | 1.0 | 1125 | $1,050 | $0.93 | 21d | 1 | 0.67mi |
| 3324 Vineville Ave Unit 57A Macon, GA | 1.0 | 1.0 | 680 | $800 | $1.18 | 21d | 1 | 0.67mi |
| 3495 Charleston Cir Macon, GA | 3.0 | 1.0 | 1048 | $875 | $0.83 | 43d | 1 | 0.70mi |
| 3495 Charleston Cir Macon, GA | 3.0 | 1.0 | 1048 | $799 | $0.76 | 21d | 1 | 0.70mi |
| 3330 Ridge Ave Unit D4 Macon, GA | 2.0 | 1.5 | 1056 | $1,050 | $0.99 | 13d | 1 | 0.71mi |
| 200 Charter Ln Macon, GA | 1.0–3.0 | 1.0–2.0 | 1088 | $1,322 | $1.21 | 13d | 18 | 0.93mi |
| 3266 Highpoint Dr Unit 593-B Macon, GA | 2.0 | 1.5 | 1120 | $1,100 | $0.98 | 43d | 1 | 1.01mi |
| 3346 Shaw Dr Macon, GA | 3.0 | 1.0 | 1094 | $895 | $0.82 | 21d | 1 | 1.04mi |
| 3307 Guthrie Dr Macon, GA | 2.0 | 1.0 | 754 | $900 | $1.19 | 13d | 1 | 1.11mi |
| 3163 High Point Dr Macon, GA | 3.0 | 1.0 | 1100 | $1,125 | $1.02 | 21d | 1 | 1.12mi |
| 3016 Ridge Ave Unit A Macon, GA | 1.0 | 1.0 | 750 | $775 | $1.03 | 43d | 1 | 1.24mi |
| 1076 Carlisle Ave Macon, GA | 3.0 | 1.0 | 1025 | $1,065 | $1.04 | 21d | 1 | 1.32mi |
| 1187 Edna Pl Unit S-1208 Macon, GA | 2.0 | 2.0 | 1000 | $850 | $0.85 | 13d | 1 | 1.42mi |
| 1187 Edna Pl Unit S-1206 Macon, GA | 2.0 | 2.0 | 1000 | $1,060 | $1.06 | 21d | 1 | 1.42mi |
Listing history 21 events
-
2026-06-13statusdays on market $23,000 Pending 58 DOM
-
2026-06-10days on market $23,000 Active 56 DOM
-
2026-06-09days on market $23,000 Active 55 DOM
-
2026-06-09days on market $23,000 Active 54 DOM
-
2026-06-07days on market $23,000 Active 53 DOM
-
2026-06-03days on market $23,000 Active 49 DOM
-
2026-06-02days on market $23,000 Active 48 DOM
-
2026-06-01days on market $23,000 Active 47 DOM
-
2026-05-31days on market $23,000 Active 46 DOM
-
2026-05-30days on market $23,000 Active 45 DOM
-
2026-05-06price $30,000 93-char remark
Show marketing remark (93 chars)
INVESTOR SPECIAL/ Fix & FLIP or Add to Rental Portfolio GREAT 2/1 ready for your vision
-
2026-05-01price $38,000 93-char remark
Show marketing remark (93 chars)
INVESTOR SPECIAL/ Fix & FLIP or Add to Rental Portfolio GREAT 2/1 ready for your vision
-
2026-04-15$45,000 Active 93-char remark
Show marketing remark (93 chars)
INVESTOR SPECIAL/ Fix & FLIP or Add to Rental Portfolio GREAT 2/1 ready for your vision
-
2026-02-14soldstatus $14,000 Sold 27-char remark
Show marketing remark (27 chars)
Investor owner - Sold As-Is
-
2026-02-14soldstatus $14,000 Closed
Show marketing remark (27 chars)
Investor owner - Sold As-Is
-
2026-01-29status Under Contract 27-char remark
Show marketing remark (27 chars)
Investor owner - Sold As-Is
-
2026-01-29status Pending
Show marketing remark (27 chars)
Investor owner - Sold As-Is
-
2026-01-22$15,000 Active
-
2026-01-21$15,000 New 27-char remark
Show marketing remark (27 chars)
Investor owner - Sold As-Is
-
2022-02-11soldstatus $220,000
-
2006-02-03soldstatus $163,000
ⓘ Source: listings_history table (triggers on properties + properties_extension) + one-shot
backfill from property_details.listing_events for pre-trigger history.
Tax reassessment forecast GA · Resets to sale price
- Current annual tax
- $383 · $32/mo
- Projected year-2 tax
- $383 · $32/mo
- Expected delta
- $0/yr ($0/mo · 0.0%)
ⓘ Screening estimate from a state-policy table — verify with the county assessor before closing.
Climate risk First Street
- Flood 6/10 Major FEMA zone X (unshaded) · 72% chance over 30 yrs
- Wildfire 2/10 Low
- Heat 6/10 Major 7 d/yr ≥108°F today · 16 d/yr by 30 yrs out
- Wind 6/10 Major 68% chance of damaging wind over 30 yrs
- Air quality 4/10 Moderate 3 unhealthy d/yr today · 5 by 30 yrs out
Nearby sold comps map
Loading sold comps map…
Walkable amenities ~0.75 mi
Loading nearby amenities…
Taxation est. · year 1
- Rental income
- $11,197
- − Mortgage interest
- −$1,288
- − Property taxes
- −$383
- − Insurance
- −$115
- − Repairs & maintenance
- −$896
- − Management
- −$896
- − Depreciation
- −$669
- Taxable income
- $6,950
- Est. tax owed @ 24.0%
- −$1,668
- After-tax cash flow
- $5,232/yr
For passive investors: Depreciation is non-cash, so a rental often shows a tax loss while cash-flowing — sheltering income. Rental losses are passive: they offset passive income freely, and up to $25,000/yr can offset ordinary (W-2) income if you actively participate and your MAGI is under $100k (phasing out to $0 by $150k); unused losses carry forward. On sale, claimed depreciation is recaptured at up to 25%, and gains may owe capital-gains tax (a 1031 exchange can defer both). Figures are a year-1 estimate at your 24.0% rate — not tax advice; consult a CPA.
Schools (NCES district)
- District
- Bibb County
- NCES district ID
- 1300420
- Math proficiency
- 11% ▼ -14.00%
- Reading proficiency
- 18% ▼ -11.00%
- Median HH income
- $37,426
- Composite
- 12.13/100
- National rank
- #9654
- State rank
- #161 of 174 in GA
Livability — Macon-Bibb County
No livability data for this city. (Only ~50 U.S. cities are tracked.)
Census & demographics
- Census place
- Macon-Bibb County, GA
- County
- Bibb County · 164,332 people
- City population
- 143,186
- Metro
- Macon-Bibb County, GA
- Population (ZIP)
- 32,421
- Household income
- $38,784
- Rent vs Own
- Severe rent burden
- 2674.0
Population outlook (Bibb County) Hauer SSP2
- Today (2025)
- 148,772 people
- By 2030
- 145,904 · -1.9%
- By 2040
- 139,404 · -6.3%
- By 2050
- 131,603 · -11.5%
- By 2075
- 111,050 · -25.4%
- By 2100
- 83,346 · -44.0%
Race, ethnicity, and origin ACS 2023
- Neighborhood character
- Predominantly Black (65%)
- Race & ethnicity
- Black 65% White 28% Hispanic / Latino 3% Two or more races 2% Asian 1%
- Common ancestry
- Serbian 2% Slovak 1% Lithuanian 1%
- Foreign-born
- 2% · Canada
- Languages at home
- 96% English-only · Spanish 2% French/Haitian/Cajun 1%
Political lean MEDSL · Bibb
- 2024 margin
- Strong D (+22.4) · D 61.0% · R 38.5%
- 2008→2024 swing
- +4.4pp toward D · 2008: 18.0pp · 2024: 22.4pp
- All cycles
- 2024: D+22.4 2020: D+23.8 2016: D+20.2 2012: D+20.0 2008: D+18.0
Not yet ingested
- Civics
- —
Market trends
- HPI YoY
- ▼ -135.44%
- Current HPI
- 194.5459
- Rent YoY
- ▲ 4.61%
- Metro
- Macon-Bibb County, GA
- State GDP YoY
- ▲ 2.66%
- F500 in state
- 28
Industry mix (Fortune 500 HQ in GA)
| Industry | F500 HQs | Revenue |
|---|---|---|
| Paper / Packaging | 2 | $29B |
|
||
| Retail | 1 | $160B |
|
||
| Transportation / Logistics | 1 | $91B |
|
||
| Airlines | 1 | $62B |
|
||
| Consumer Goods | 1 | $47B |
|
||
| Utilities | 1 | $25B |
|
||
Price history
-81.6% since first listed11 events — show timeline
- 2026-05-06 Price Changed $30,000 CGMLS
- 2026-05-01 Price Changed $38,000 CGMLS
- 2026-04-15 Listed $45,000 CGMLS
- 2026-02-14 Sold (MLS) $14,000 FMLS
- 2026-02-14 Sold (MLS) $14,000 GAMLS
- 2026-01-29 Pending — GAMLS
- 2026-01-29 Pending — FMLS
- 2026-01-22 Listed $15,000 FMLS
- 2026-01-21 Listed $15,000 GAMLS
- 2022-02-11 Sold (Public Records) $220,000 Public Records
- 2006-02-03 Sold (Public Records) $163,000 Public Records
Property tax history
+10.4%/yrLatest (2025): $383 · +9.7% YoY. Source: county tax records.
Cash-flow waterfall
monthlySold comps — $/sqft
last 12 mo · ≤1 miLoading sold comps…