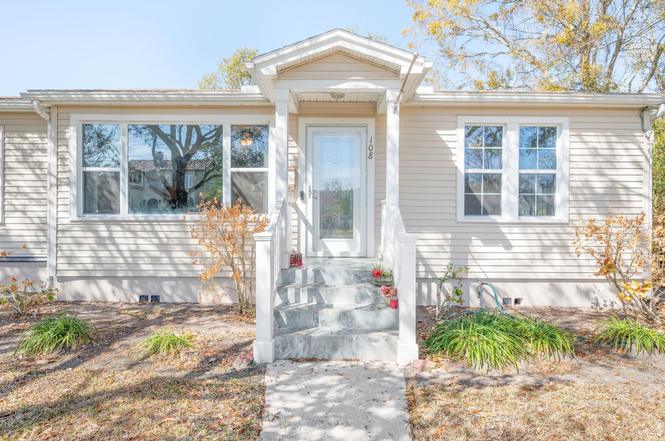
108 Oglethorpe Blvd · St. Augustine, FL
Flood risk 9/10 · Severe
- FEMA flood zone
- AE
- Chance of flooding over 30 yrs
- 0.99%
- Est. flood insurance / yr
- $1,737 – $8,500
Fire risk 2/10 · Minimal
- Est. fire insurance / yr
- $947 – $1,759
Heat risk 9/10 · Severe
- Hot days now (above 106°F)
- 7 days/yr
- Hot days in 30 yrs
- 20 days/yr
Wind risk 10/10 · Severe
- Chance of severe wind over 30 yrs
- 99.0%
Air-quality risk 3/10 · Minor
- Unhealthy air days now
- 3 days/yr
- Unhealthy air days in 30 yrs
- 3 days/yr
Risk factors via First Street. Map © Google.
Why this score? — see what drove the D+ grade
The composite is a weighted blend of 9 inputs, each scored 0–100. Each bar is that input's sub-score; the figure is the points it added to the 100-point composite (weight × sub-score).
- Cash flow +17.8/30.0
- ARV discount +8.8/15.0
- Schools +6.4/10.0
- DSCR +5.6/10.0
- 1% rule +3.8/10.0
- Livability +2.5/5.0
- Condition / age +2.5/5.0
- Rent growth +2.3/5.0
- Appreciation +0.0/10.0
$519,000
🖨 Deal sheet (PDF) 📄 Offer letter ✓ Due diligence
Listing remarks
Ideally located in Davis Shores just a short walk to the Bridge of Lions which a stroll across will lead you to the center of the historic district of St. Augustine. Along with the perfect location, this home boasts charm galore yet includes modern updates to the kitchen, bathrooms, and flooring to enjoy the optimal comforts of home. With arches, large windows offering an abundance of natural light, 42" kitchen cabinetry, newly remodeled bathrooms and luxury vinyl plank flooring and a barn door, this home will warm your soul from the second you arrive. A brand new roof in 2025, a new Trane HVAC system in 2017, and all appliances included make this ready to call home. The outdoors can't
Key facts
- Large windows
- Modern updates
- Historic district
Tags
Property features AI
Exterior
- Parking: Detached 1-car garage; Off-street parking
- Utilities: City water and well; Sewer
- Home design: Single-family property; Ground level entry
- Construction: Vinyl siding and wood construction; Shingle roof; Crawlspace foundation; Built on less than 1/4 acre (approximately 0.18 acres)
- Exterior features: Screened porch (20 x 14); Full fence; Automatic sprinkler / irrigation system; Paved lot; Regular lot shape
Interior
- Kitchen: Range; Refrigerator; Microwave; Dishwasher
- Bedrooms: Master bedroom 12 x 12 (downstairs); Second bedroom 12 x 11
- Flooring: Carpet; Tile; Vinyl
- Bathrooms: 2 bathrooms; Master bathroom with shower only
- Heating & cooling: Central heating (electric); Central air conditioning (electric)
- Interior features: Ceiling fans; Window treatments; Formal dining area; Den/office; Living room
- Laundry & utility: Washer and dryer included; Utility/storage shed; Workshop
Neighborhood map
What this means for you Summary
Snapshot
- This is a 3-bed/2.0-bath single-family listed at $519k.
Deal economics
- At list price, monthly cash flow is $-3 ($-31/yr) — negative.
- To cash-flow at today's rent, offer at most $519k (0.1% below list).
- To meet the 1% rule (rent ≥ 1% of price), the offer needs to be $457k (11.9% below list).
- Recommended offer: $457k (11.9% below list) — sets the bar for 1% rule.
- Cap rate 7.3% vs local median 3.1% in St. Augustine — top-decile yield for the area; either an underpriced asset or a hidden risk that comps aren't pricing in. Stress-test before assuming the spread holds.
Location & tenants
- Location reads: area grade D — affects rentability + tenant quality, not the cash-flow math above.
- St. Johns (rural): math 75% / reading 73% proficiency, ranked #2 of 73 in FL (top 3%) — strong family-tenant draw, lease renewals of 3-5y typical; only 20% free/reduced lunch — higher-income household profile.
- Zoned schools: R. B. Hunt Elementary School (math 76% / reading 80%, grade A, #149 of 2,144 statewide, top 8%, 585 students, 26% FRL); Sebastian Middle School (math 59% / reading 59%, grade B, #144 of 571 statewide, top 26%, 654 students, 42% FRL); St. Augustine High School (math 54% / reading 62%, grade C, #120 of 667 statewide, top 18%, 1,784 students, 38% FRL) — zoned schools average 35% FRL vs 20% district-wide (15 pts higher); higher-poverty schools than district average — tighter screening recommended.
- Market conditions: Rents soft (-1.0%/yr); 534 active listings in the ZIP; 23 comparable units currently listed for rent nearby; rentals leasing fast (median 10d on market — plan ~1-2 weeks tenant-placement turnaround); solid renter incomes; 5,575 units permitted in St. Johns County in 2024 (584 in 5+ unit buildings).
- At $4,573/mo this rent would consume 59% of the median local household income ($93k/yr) (locally 417% of renters already pay >50% of income on rent) — very limited rent-growth headroom before tenants either downsize or default.
Forward outlook
- Local home prices are declining (-3.0%/yr); year-one equity from $4k of loan paydown is wiped out by about $16k of value loss. Plan a longer hold.
- St. Johns County population projected at +60% by 2050 — long-run rental-demand tailwind backs the buy-and-hold thesis.
Negotiation context
- It's been on market 70 days — a 6% lower offer ($488k) is reasonable based on typical stale-listing flexibility.
- Current owner paid $210k; list at $519k implies a 147% gain — meaningful room to come down on a strong offer.
Risks & watch-outs
- Watch-outs: flood insurance adds $427/mo; built in 1948 — expect roof / HVAC / electrical / plumbing capex.
- Climate carrying-cost: in FEMA flood zone AE (mandatory federal flood insurance); severe wind risk, 99% chance of damaging wind over 30y; extreme-heat days projected 7→20/yr by 2055 (HVAC capex compounding) — expect insurance premiums to compound above CPI over the hold.
Questions for the listing agent
- What do current leases actually rent for vs. the listed asking? Can we see a recent rent roll and the last 12 months of T-12 income?
- It's been on market 70 days. Have you received any prior offers? Is the seller open to a 12% concession, seller financing, or rate buy-down credit?
- Built in 1948 — when were the roof, HVAC, electrical panel, plumbing, and water heater last replaced?
- What's the actual annual flood-insurance premium (NFIP or private), and is the property in a SFHA with mandatory coverage?
- Why hasn't it sold? Are there any deal-killer items the seller is aware of (foundation, flood, title, zoning, code violations)?
- Is there a deadline driving the sale (1031 exchange, divorce, estate, relocation)? That informs how much negotiation room exists.
- The area grade is low — what's the realistic commute time and amenity access for the typical tenant pool here? Any planned neighborhood developments (good or bad) we should know about?
- What's the average days-on-market for RENTAL listings here right now (not sales)? A rising rental-DOM trend means longer vacancies and softer asking-rent achievability than the comps imply.
- What's the recent tenant-quality profile in this submarket — average credit score on applications, eviction rate, late-payment / NSF rate, and stable-employment percentage? A property-management company in the area should have these aggregated.
- How much new for-sale + rental construction is in the pipeline within 1–3 miles? Heavy new supply typically softens prices + rents 12–24 months out; constrained supply supports both.
Investment metrics
- 1% rule
- 0.88% ✗
- Cap rate
- 7.27%
- Cash-on-cash
- 3.50%
- DSCR
- 1.16
- GRM
- 9.5
CMA / ARV
- ARV (on-the-fly)
- $534,528
- Comps found
- 12
Show comp detail 12 sales within ~0.75 mi
| Address | Dist | Beds/Ba | Sqft | Sold | Price | $/sf | Match |
|---|---|---|---|---|---|---|---|
| 108 Oglethorpe Blvd | 0.00mi | 3/2.0 | 1,536 (0%) | 1mo | $505,000 | $329 | 99 |
| 410 Arredondo | 0.13mi | 3/2.0 | 1,596 (+4%) | 4mo | $810,000 | $508 | 84 |
| 201 Arpieka Ave | 0.06mi | 2/2.0 (-1) | 1,488 (-3%) | 7mo | $518,000 | $348 | 82 |
| 314 Arpieka | 0.21mi | 3/2.0 | 1,626 (+6%) | 2mo | $780,000 | $480 | 79 |
| 108 Zorayda Ave | 0.09mi | 2/2.0 (-1) | 1,566 (+2%) | 11mo | $575,000 | $367 | 78 |
| 105 Arricola Ave #B | 0.22mi | 3/2.5 | 1,586 (+3%) | 5mo | $450,000 | $284 | 78 |
| 196 Inlet Dr | 0.34mi | 3/2.0 | 1,499 (-2%) | 5mo | $550,000 | $367 | 76 |
| 22 Montrano Ave | 0.25mi | 3/2.0 | 1,405 (-8%) | 1mo | $425,000 | $302 | 74 |
| 407 Arricola Ave | 0.43mi | 3/2.0 | 1,501 (-2%) | 13mo | $410,000 | $273 | 65 |
| 16 Menendez Rd | 0.62mi | 3/1.0 | 1,416 (-8%) | 1mo | $675,000 | $477 | 53 |
| 402 Flagler Blvd | 0.36mi | 3/2.0 | 1,356 (-12%) | 15mo | $472,000 | $348 | 51 |
| 409 Arricola Ave | 0.43mi | 2/2.0 (-1) | 1,327 (-14%) | 2mo | $405,000 | $305 | 50 |
Match score weights: distance 35% · size 25% · config 20% · recency 20%. Top-matched comps best support the ARV.
Projected returns pro-forma
-3.0% appreciation · 0.0% rent growth · sell at horizon
- IRR
- -19.8%
- Equity multiple
- 0.33×
- Total profit
- $-97,578
- Equity at exit
- $77,385
- IRR
- -20.9%
- Equity multiple
- 0.06×
- Total profit
- $-136,620
- Equity at exit
- $44,874
Cash invested: $145,320 (down + closing). Projections, not guarantees.
Landlord ↔ Tenant lean methodology
- Overall (STATE)
- 87 Strongly Landlord-Friendly
- State Florida
- 87 Strongly Landlord-Friendly · R+3
- County
- — inherits STATE
- City
- — inherits STATE
ZIP-level market 32080
- Rents YoY
- -1.0%
- Active inventory
- 534
- Price-to-rent
- 9.5×
Monthly cashflow live
- Estimated rent
- $4,573 high interval (Pro) →
- Mortgage (P&I)
- −$2,722
- Tax from tax record
- −$251 /mo · $3,009/yr
- Insurance
- −$216
- Flood insurance flood zone
- −$427 /mo · $5,118/yr
- HOA
- −$0
- Vacancy / Maint / Mgmt
- −$960
- Net cashflow
- $-3
Break-even live
Sensitivity live
| Price | -10% $291 | -5% $144 | +0% $-3 | +5% $-149 | +10% $-296 |
|---|---|---|---|---|---|
| Rent | -10% $-364 | -5% $-183 | +0% $-3 | +5% $178 | +10% $359 |
| Rate | -1.0pp $259 | -0.5pp $129 | base $-3 | +0.5pp $-137 | +1.0pp $-274 |
UW: 25.0% down · 7.5% · 30yr · 1.5% tax · 5.0% vac · 8.0% maint · 8.0% mgmt
Financing live
Cash to close
- Down payment
- $129,750
- Closing costs
- $15,570
- Reserves months
- —
- Total cash needed
- —
Loan-product check · same deal, 3 products live
Conventional
25% down · 7.5% · 30yr
- Down + closing
- —
- Monthly P&I
- —
- Monthly cashflow
- —
- DSCR
- —
- Eligible?
- —
Personal DTI + credit; lowest rate.
DSCR
20% down · 8.5% · 30yr
- Down + closing
- —
- Monthly P&I
- —
- Monthly cashflow
- —
- DSCR
- —
- Eligible?
- —
No personal income docs; deal must DSCR.
Hard money
10% down · 12.0% · 12mo
- Down + closing
- —
- Monthly P&I
- —
- Monthly cashflow
- —
- DSCR
- —
- Eligible?
- —
Short-term bridge; refi at stabilization.
Rent comps 23 comps
| Address | Beds | Baths | Sqft | Rent | $/sqft | DOM | Units | Dist |
|---|---|---|---|---|---|---|---|---|
| 210 Flagler Blvd Saint Augustine, FL | 4.0 | 2.0 | 1787 | $5,800 | $3.25 | 9d | 1 | 0.21mi |
| 75 Comares Ave Unit 3A Saint Augustine, FL | 2.0 | 2.0 | 1250 | $3,950 | $3.16 | 25d | 1 | 0.34mi |
| 11 Comares Ave Unit 1281955P St. Augustine, FL | 3.0 | 2.0 | 1237 | $4,317 | $3.49 | 9d | 1 | 0.56mi |
| 2A Sanchez Cv Unit 1281958P St. Augustine, FL | 2.0 | 2.5 | 1194 | $7,762 | $6.50 | 25d | 1 | 0.71mi |
| 195 Cabeza St Saint Augustine, FL | 4.0 | 3.0 | 2150 | $3,600 | $1.67 | 19d | 1 | 0.72mi |
| 2 Sanchez Cv Unit 1281986P St. Augustine, FL | 2.0 | 2.5 | 1194 | $7,434 | $6.23 | 22d | 1 | 0.72mi |
| 171 Cordova St Unit B St. Augustine, FL | 2.0 | 2.0 | 1533 | $4,000 | $2.61 | 25d | 1 | 0.76mi |
| 27 Desoto Pl Unit 1281911P St. Augustine, FL | 4.0 | 3.0 | 1991 | $10,893 | $5.47 | 23d | 1 | 0.89mi |
| 35 Desoto Pl Unit 1281968P St. Augustine, FL | 2.0 | 2.0 | 1173 | $5,216 | $4.45 | 14d | 1 | 0.91mi |
| 104 Cedar St Unit 1281914P St. Augustine, FL | 3.0 | 2.0 | 1399 | $7,542 | $5.39 | 5d | 1 | 0.94mi |
| 123 Ferdinand Ave Unit 1281969P St. Augustine, FL | 3.0 | 2.5 | 1689 | $4,766 | $2.82 | 3d | 1 | 0.96mi |
| 114 Cedar St Unit 4 St. Augustine, FL | 4.0 | 3.0 | 1495 | $2,895 | $1.94 | 25d | 1 | 1.00mi |
| 114 Cedar St Saint Augustine, FL | 4.0 | 3.0 | 1495 | $2,895 | $1.94 | 25d | 2 | 1.00mi |
| 146 Blanco St Unit 1281949P St. Augustine, FL | 3.0 | 3.0 | 1872 | $7,178 | $3.83 | 9d | 1 | 1.08mi |
| 68 Saragossa St Saint Augustine, FL | 3.0 | 2.0 | 1704 | $3,800 | $2.23 | 25d | 1 | 1.08mi |
| 140B Martin Luther King Ave Unit 1281977P St. Augustine, FL | 2.0 | 1.0 | 1097 | $3,427 | $3.12 | 3d | 1 | 1.10mi |
| 116 San Marco Ave Unit 1281934P St. Augustine, FL | 1.0–2.0 | 1.0 | 920 | $4,325 | $4.70 | 9d | 2 | 1.15mi |
| 15 Old Mission Ave Unit 1281979P St. Augustine, FL | 2.0 | 2.0 | 1097 | $3,563 | $3.25 | 9d | 1 | 1.17mi |
| 259 Riberia St Unit A St. Augustine, FL | 2.0 | 2.0 | 1115 | $2,600 | $2.33 | 25d | 1 | 1.17mi |
| 17 Old Mission Ave Unit 1281913P St. Augustine, FL | 3.0 | 2.5 | 1291 | $3,714 | $2.88 | 3d | 1 | 1.18mi |
| 134 South St Unit 1281931P St. Augustine, FL | 3.0 | 2.0 | 1291 | $6,455 | $5.00 | 9d | 1 | 1.18mi |
| 171 Twine St Unit 1568459P St. Augustine, FL | 2.0 | 1.5 | 1151 | $4,362 | $3.79 | 3d | 1 | 1.21mi |
| 16 Magnolia Ave Unit 1281942P St. Augustine, FL | 4.0 | 2.0 | 2066 | $5,725 | $2.77 | 9d | 1 | 1.22mi |
Listing history 4 events
-
2026-05-01status Pending
-
2026-04-09historical Contingent- Accepting Backups
-
2026-02-20$519,000 Active
-
2010-11-29soldstatus $210,000
ⓘ Source: listings_history table (triggers on properties + properties_extension) + one-shot
backfill from property_details.listing_events for pre-trigger history.
Tax reassessment forecast FL · Resets to sale price
- Current annual tax
- $3,009 · $251/mo
- Projected year-2 tax
- $4,308 · $359/mo
- Expected delta
- +$1,298/yr (+$108/mo · 43.1%)
ⓘ Screening estimate from a state-policy table — verify with the county assessor before closing.
Climate risk First Street
- Flood 9/10 Extreme FEMA zone AE · 99% chance over 30 yrs
- Wildfire 2/10 Low
- Heat 9/10 Extreme 7 d/yr ≥106°F today · 20 d/yr by 30 yrs out
- Wind 10/10 Extreme 99% chance of damaging wind over 30 yrs
- Air quality 3/10 Moderate 3 unhealthy d/yr today · 3 by 30 yrs out
Nearby sold comps map
Loading sold comps map…
Walkable amenities ~0.75 mi
Loading nearby amenities…
Taxation est. · year 1
- Rental income
- $54,877
- − Mortgage interest
- −$29,072
- − Property taxes
- −$3,009
- − Insurance
- −$7,714
- − Repairs & maintenance
- −$4,390
- − Management
- −$4,390
- − Depreciation
- −$15,098
- Taxable loss
- −$8,797
- Est. tax savings @ 24.0%
- +$2,111
- After-tax cash flow
- $2,081/yr
For passive investors: Depreciation is non-cash, so a rental often shows a tax loss while cash-flowing — sheltering income. Rental losses are passive: they offset passive income freely, and up to $25,000/yr can offset ordinary (W-2) income if you actively participate and your MAGI is under $100k (phasing out to $0 by $150k); unused losses carry forward. On sale, claimed depreciation is recaptured at up to 25%, and gains may owe capital-gains tax (a 1031 exchange can defer both). Figures are a year-1 estimate at your 24.0% rate — not tax advice; consult a CPA.
Schools (NCES district)
- District
- St. Johns
- NCES district ID
- 1201740
- Math proficiency
- 75% ▼ -5.00%
- Reading proficiency
- 73% ▼ -2.00%
- Median HH income
- $66,842
- Composite
- 64.31/100
- National rank
- #556
- State rank
- #2 of 73 in FL
Livability — St. Augustine
No livability data for this city. (Only ~50 U.S. cities are tracked.)
Census & demographics
- Census place
- St. Augustine, FL
- County
- Saint Johns County · 301,599 people
- Metro
- Jacksonville, FL
- Population (ZIP)
- 20,894
- Household income
- $92,531
- Rent vs Own
- Severe rent burden
- 417.0
Population outlook (St. Johns County) Hauer SSP2
- Today (2025)
- 303,941 people
- By 2030
- 342,590 · +12.7%
- By 2040
- 417,328 · +37.3%
- By 2050
- 487,011 · +60.2%
- By 2075
- 635,395 · +109.1%
- By 2100
- 717,469 · +136.1%
Race, ethnicity, and origin ACS 2023
- Neighborhood character
- Predominantly White (90%)
- Race & ethnicity
- White 90% Two or more races 5% Hispanic / Latino 4% Asian 2%
- Common ancestry
- Romanian 4% Lithuanian 4% Slovak 3%
- Foreign-born
- 7% · Canada, Jamaica
- Languages at home
- 95% English-only · Spanish 2% Other Indo-European 2% Russian/Polish/Slavic 1%
Political lean MEDSL · St. Johns
- 2024 margin
- Solid R (+31.4) · D 33.9% · R 65.2%
- 2008→2024 swing
- +0.2pp no change · 2008: -31.6pp · 2024: -31.4pp
- All cycles
- 2024: R+31.4 2020: R+26.7 2016: R+33.4 2012: R+37.8 2008: R+31.6
Not yet ingested
- Civics
- —
Market trends
- HPI YoY
- ▼ -560.06%
- Current HPI
- 301.5733
- Rent YoY
- ▼ -0.97%
- Metro
- Jacksonville, FL
- State GDP YoY
- ▲ 3.28%
- F500 in state
- 36
Industry mix (Fortune 500 HQ in FL)
| Industry | F500 HQs | Revenue |
|---|---|---|
| Industrial Technology | 2 | $29B |
|
||
| Insurance | 2 | $17B |
|
||
| Retail | 1 | $60B |
|
||
| Technology Distribution | 1 | $58B |
|
||
| Homebuilding | 1 | $35B |
|
||
| Technology Manufacturing | 1 | $35B |
|
||
Price history
+147.1% since first listed4 events — show timeline
- 2026-05-01 Pending — St. Augustine and St. Johns County Board of REALTORS®
- 2026-04-09 Contingent — St. Augustine and St. Johns County Board of REALTORS®
- 2026-02-20 Listed $519,000 St. Augustine and St. Johns County Board of REALTORS®
- 2010-11-29 Sold (Public Records) $210,000 Public Records
Property tax history
+2.0%/yrLatest (2025): $3,009 · +8.3% YoY. Source: county tax records.
Cash-flow waterfall
monthlySold comps — $/sqft
last 12 mo · ≤1 miLoading sold comps…